Analysis Summary
Notes:
- 1) No attempt has been made to eliminate the non-significant decimal places.
- 2) This batgrbproduct analysis is done using the HEASARC data.
- 3) This batgrbproduct analysis is using the flight position for the mask-weighting calculation.
======================================================================
BAT GRB EVENT DATA PROCESSING REPORT
Process Script Ver: batgrbproduct v2.46
Process Start Time: Mon Jan 20 07:11:24 EST 2014
Host Name: batevent1
Current Working Dir: /local/data/batevent/batevent_reproc/trigger291728
======================================================================
Trigger: 00291728 Segment: 000
BAT Trigger Time: 212015074.624 [s; MET]
Trigger Stop: 212015075.648 [s; MET]
UTC: 2007-09-20T21:04:32.386340 [includes UTCF correction]
Where From?: TDRSS position message
BAT
RA: 0.144108470626363 Dec: -34.8186092179982 [deg; J2000]
Catalogged Source?: NO
Point Source?: YES
GRB Indicated?: YES [ by BAT flight software ]
Image S/N Ratio: 7.94
Image Trigger?: NO
Rate S/N Ratio: 14.1067359796659 [ if not an image trigger ]
Image S/N Ratio: 7.94
Analysis Position: [ source = BAT ]
RA: 0.144108470626363 Dec: -34.8186092179982 [deg; J2000]
Refined Position: [ source = BAT pre-slew burst ]
RA: 0.118000545972279 Dec: -34.8455819705286 [deg; J2000]
{ 00h 00m 28.3s , -34d 50' 44.1" }
+/- 0.98829579186739 [arcmin] (estimated 90% radius based on SNR)
+/- 0.410696724987387 [arcmin] (formal 1-sigma fit error)
SNR: 30.9330499324815
Angular difference between the analysis and refined position is 2.066981 arcmin
Partial Coding Fraction: 1.03125 [ including projection effects ]
Duration
T90: 22.2560000121593 +/- 2.79212104121582
Measured from: -11.2080000042915
to: 11.0480000078678 [s; relative to TRIGTIME]
T50: 9.41200000047684 +/- 1.20058650862768
Measured from: -4.55200001597404
to: 4.85999998450279 [s; relative to TRIGTIME]
Fluence
Peak Flux (peak 1 second)
Measured from: -1.04399999976158
to: -0.0439999997615814 [s; relative to TRIGTIME]
Total Fluence
Measured from: -14.1200000047684
to: 13.3519999980927 [s; relative to TRIGTIME]
Band 1 Band 2 Band 3 Band 4
15-25 25-50 50-100 100-350 keV
Total 0.491465 0.679196 0.279561 0.050297
0.024552 0.025822 0.022343 0.019248 [error]
Peak 0.031941 0.044404 0.020418 0.008319
0.004850 0.005180 0.004418 0.003793 [error]
[ fluence units of on-axis counts / fully illuminated detector ]
======================================================================
====== Table of the duration information =============================
Value tstart tstop
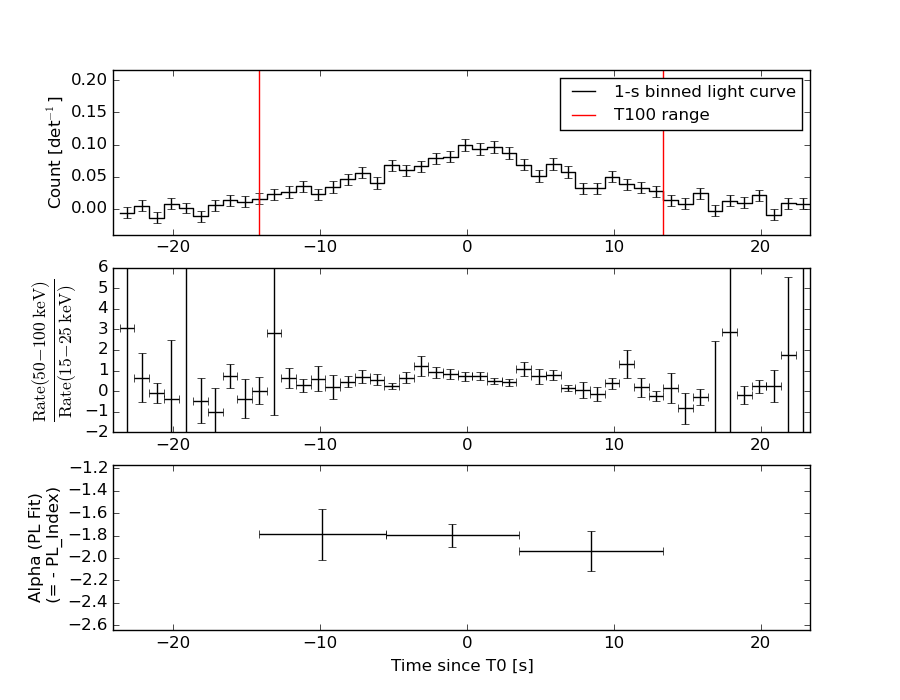
T100 27.472 -14.120 13.352
T90 22.256 -11.208 11.048
T50 9.412 -4.552 4.860
Peak 1.000 -1.044 -0.044
====== Spectral Analysis Summary =====================================
Model : spectral model: simple power-law (PL) and cutoff power-law (CPL)
Ph_index : photon index: E^{Ph_index}
Ph_90err : 90% error of the photon index
Epeak : Epeak in keV
Epeak_90err: 90% error of Epeak
Norm : normalization at 50 keV in both the PL model and CPL model
Nomr_90err : 90% error of the normalization
chi2 : Chi-Squared
dof : degree of freedo
=== Time-averaged spectral analysis ===
(Best model with acceptable fit: CPL)
Model Ph_index Ph_90err_low Ph_90err_hi Epeak Epeak_90err_low Epeak_90err_hi Norm Nomr_90err_low Norm_90err_hi chi2 dof
PL -1.875 -0.094 0.092 - - - 3.21e-03 -1.92e-04 1.90e-04 79.010 57
CPL -0.385 -0.541 0.625 44.717 -3.813 5.192 2.29e-02 -1.17e-02 2.98e-02 51.000 56
=== 1-s peak spectral analysis ===
(Best model with acceptable fit: PL)
Model Ph_index Ph_90err_low Ph_90err_hi Epeak Epeak_90err_low Epeak_90err_hi Norm Nomr_90err_low Norm_90err_hi chi2 dof
PL -1.667 -0.258 0.250 - - - 6.40e-03 -1.01e-03 9.83e-04 54.510 57
CPL -1.675 -0.251 0.269 9999.270 -9999.260 -9999.270 6.36e-03 -9.77e-04 7.63e-03 54.520 56
=== Fluence/Peak Flux Summary ===
Model Band1 Band2 Band3 Band4 Band5 Total
15-25 25-50 50-100 100-350 15-150 15-350 keV
Fluence PL 1.60e-07 2.35e-07 2.56e-07 5.23e-07 8.11e-07 1.17e-06 erg/cm2
90%_error_low -1.23e-08 -1.20e-08 -2.07e-08 -8.05e-08 -4.81e-08 -1.02e-07 erg/cm2
90%_error_hi 1.25e-08 1.20e-08 2.08e-08 8.99e-08 4.86e-08 1.10e-07 erg/cm2
Peak flux PL 3.09e-01 2.82e-01 1.77e-01 1.71e-01 8.40e-01 9.39e-01 ph/cm2/s
90%_error_low -6.45e-02 -3.83e-02 -3.67e-02 -6.12e-02 -1.13e-01 -1.32e-01 ph/cm2/s
90%_error_hi 6.66e-02 3.83e-02 3.68e-02 8.04e-02 1.13e-01 1.33e-01 ph/cm2/s
Fluence CPL 1.39e-07 2.72e-07 2.31e-07 6.69e-08 6.95e-07 7.08e-07 erg/cm2
90%_error_low -1.45e-08 -1.76e-08 -2.93e-08 -3.28e-08 -5.41e-08 -6.25e-08 erg/cm2
90%_error_hi 1.46e-08 1.79e-08 2.77e-08 5.88e-08 5.75e-08 7.96e-08 erg/cm2
Peak flux CPL 3.13e-01 2.77e-01 1.77e-01 1.70e-01 8.44e-01 9.65e-01 ph/cm2/s
90%_error_low -8.04e-02 -4.07e-02 -4.27e-02 N/A -1.39e-01 -2.02e-01 ph/cm2/s
90%_error_hi 7.57e-02 5.36e-02 4.41e-02 N/A 1.31e-01 1.22e-01 ph/cm2/s
======================================================================
Image
Pre-slew 15.0-350.0 keV image (Event data)
#   RAcent    DECcent   POSerr    Theta     Phi              Peak Cts       SNR   Name
    0.1180   -34.8456   0.0062     7.8147   155.7131         1.6092794     30.933 TRIG_00291728

Foreground time interval of the image:
-14.120  13.352 (delta_t =  27.472 [sec])
Background time interval of the image:
-105.723 -14.120 (delta_t =  91.603 [sec])
Light Curves
Note: The mask-weighted lightcurves have units of either count/det or counts/sec/det, where a det is 0.4 x 0.4 = 0.16 sq cm.
Full-time range; 1 s binning
Other quick-look light curves:
- 64 ms binning (zoomed)
- 16 ms binning (zoomed)
- 8 ms binning (zoomed)
- 2 ms binning (zoomed)
- SN=5 or 10 s binning (full-time range)
- Raw light curve
Spectra
- 64 ms binning (zoomed)
- 16 ms binning (zoomed)
- 8 ms binning (zoomed)
- 2 ms binning (zoomed)
- SN=5 or 10 s binning (full-time range)
- Raw light curve
Spectra
Notes:
- 1) The fitting includes the systematic errors.
- 2) When the burst includes telescope slew time periods, the fitting uses an average response file made from multiple 5-s response files through out the slew time plus single time preiod for the non-slew times, and weighted by the total counts in the corresponding time period using addrmf. An average response file is needed becuase a spectral fit using the pre-slew DRM will introduce some errors in both a spectral shape and a normalization if the PHA file contains a lot of the slew/post-slew time interval.
- 3) For fits to more complicated models (e.g. a power-law over a cutoff power-law), the BAT team has decided to require a chi-square improvement of more than 6 for each extra dof.
Time averaged spectrum fit using the average DRM
Power-law model
Time interval is from  -14.120 sec. to   13.352 sec.

Spectral model in power-law:
------------------------------------------------------------
Parameters  : value       lower 90%   higher 90%
Photon index: -1.87483     ( -0.093857   0.0922454 )
Norm@50keV  : 3.21014E-03    ( -0.000191917   0.000190491 )
------------------------------------------------------------
#Fit statistic : Chi-Squared =          79.01 using 59 PHA bins.
# Reduced chi-squared =          1.386 for     57 degrees of freedom
# Null hypothesis probability =   2.844897e-02

Photon flux (15-150 keV)    in 27.47 sec: 0.455873 ( -0.023669  0.023685 ) ph/cm2/s
Energy fluence (15-150 keV)             : 8.10791e-07 ( -4.81173e-08  4.85961e-08 ) ergs/cm2
Cutoff power-law model
Time interval is from  -14.120 sec. to   13.352 sec.
Spectral model in the cutoff power-law:
------------------------------------------------------------
Parameters  : value       lower 90%   higher 90%
Photon index: -0.385418     ( -0.541302   0.624621 )
Epeak [keV] : 44.7173      ( -3.81235 5.19255 )
Norm@50keV  : 2.29283E-02    ( -0.0116758   0.0298197 )
------------------------------------------------------------
#Fit statistic : Chi-Squared =          51.00 using 59 PHA bins.
# Reduced chi-squared =         0.9107 for     56 degrees of freedom
# Null hypothesis probability =   6.641043e-01

Photon flux (15-150 keV)    in 27.47 sec: 0.426138 ( -0.025418  0.025485 ) ph/cm2/s
Energy fluence (15-150 keV)             : 6.94942e-07 ( -5.40882e-08  5.74755e-08 ) ergs/cm2
1-s peak spectrum fit
Power-law model
Time interval is from   -1.044 sec. to   -0.044 sec.

Spectral model in power-law:
------------------------------------------------------------
Parameters  : value       lower 90%   higher 90%
Photon index: -1.66733     ( -0.257682   0.249685 )
Norm@50keV  : 6.39529E-03    ( -0.00101239   0.000983376 )
------------------------------------------------------------
#Fit statistic : Chi-Squared =          54.51 using 59 PHA bins.
# Reduced chi-squared =         0.9563 for     57 degrees of freedom
# Null hypothesis probability =   5.691513e-01

Photon flux (15-150 keV)    in 1 sec: 0.839935 ( -0.113452  0.113468 ) ph/cm2/s
Energy fluence (15-150 keV)             : 5.93882e-08 ( -9.86827e-09  1.0127e-08 ) ergs/cm2
Cutoff power-law model

Time interval is from   -1.044 sec. to   -0.044 sec.
Spectral model in the cutoff power-law:
------------------------------------------------------------
Parameters  : value       lower 90%   higher 90%
Photon index: -1.67464     ( -0.251491   0.268549 )
Epeak [keV] : 9999.27      ( -9999.35 -9999.36 )
Norm@50keV  : 6.36494E-03    ( -0.0010041   0.00760374 )
------------------------------------------------------------
#Fit statistic : Chi-Squared =          54.52 using 59 PHA bins.
# Reduced chi-squared =         0.9735 for     56 degrees of freedom
# Null hypothesis probability =   5.311196e-01

Photon flux (15-150 keV)    in 1 sec: 0.843952 ( -0.139067  0.131006 ) ph/cm2/s
Energy fluence (15-150 keV)             : 0 ( 0  0 ) ergs/cm2
Time-resolved spectra
Distribution
T90 vs. Hardness ratio plot
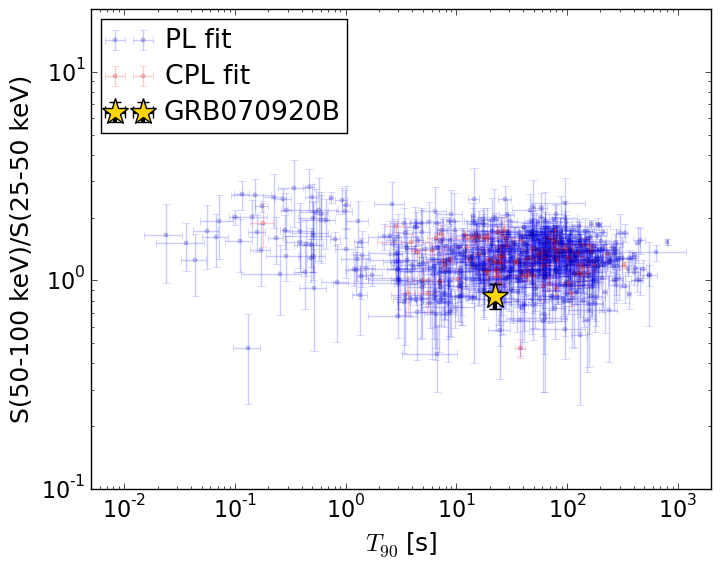
T90                                   = 22.256 sec.
Hardness ratio (energy fluence ratio) = 0.846681256701
S(15-50 keV) vs. S(50-150 keV) plot
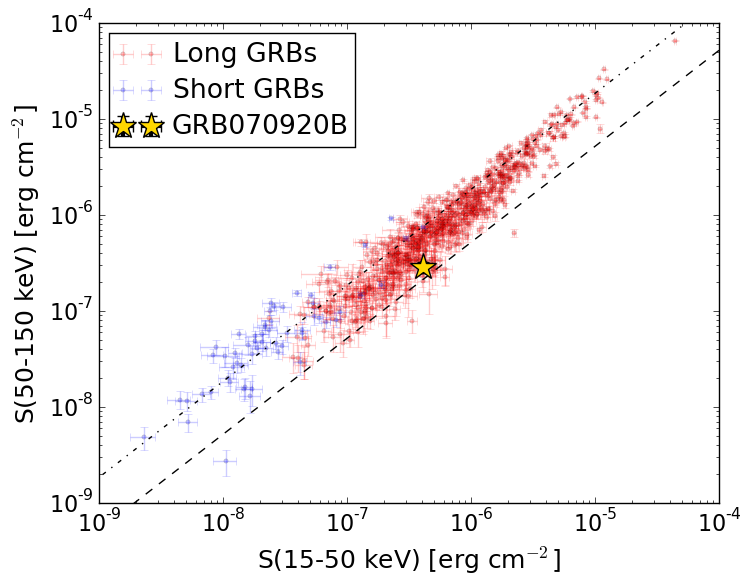
S(15-50 keV)  = 4.10988e-07
S(50-150 keV) = 2.8396456e-07
The dash-dotted line and the dashed line traces the fluences calculated from the Band function with Epeak = 15 and 150 keV, respectively. Both lines assume a canonical values of alpha = -1 and beta = -2.5.
Mask shadow pattern
IMX = -1.250973248164751E-01, IMY = -5.644920245335627E-02
Spacecraft aspect plot
Bright source in the pre-burst/pre-slew/post-slew images
Pre-burst image of 15-350 keV band
Time interval of the image:
-105.723400 -14.120000

# RAcent  DECcent POSerr Theta    Phi  PeakCts   SNR AngSep     Name
#  [deg]    [deg]    ['] [deg]  [deg]                   [']
285.0522 -24.9976   14.0  56.8   -6.9   0.3858   0.8    4.7	HT1900.1-2455
324.5652  -1.2730    2.2  44.6   50.2   2.2713   5.2 ------	UNKNOWN
 58.9484 -63.7931    2.6  46.4 -124.0   1.6872   4.5 ------	UNKNOWN
Pre-slew background subtracted image of 15-350 keV band
Time interval of the image:
-14.120000 13.352000

# RAcent  DECcent POSerr Theta    Phi  PeakCts   SNR AngSep     Name
#  [deg]    [deg]    ['] [deg]  [deg]                   [']
285.0345 -24.8809   12.2  56.9   -6.8   0.2852   1.0    2.4	HT1900.1-2455
329.0418 -30.6612    2.4  20.0   16.5   0.2849   4.9 ------	UNKNOWN
  0.1180 -34.8456    0.4   7.8  155.7   1.6095  30.9 ------	UNKNOWN
Post-slew image of 15-350 keV band
Time interval of the image:
739.676580 962.490400

# RAcent  DECcent POSerr Theta    Phi  PeakCts   SNR AngSep     Name
#  [deg]    [deg]    ['] [deg]  [deg]                   [']
 61.0845   9.9266    2.3  54.9  165.6   4.4443   5.1 ------	UNKNOWN
 49.0320   0.0494    2.7  40.0  159.4   1.1621   4.3 ------	UNKNOWN
 53.7315  -5.0620    2.4  38.5  170.1   1.0740   4.8 ------	UNKNOWN
338.5309 -63.5572    2.5  41.8  -29.2   1.0261   4.7 ------	UNKNOWN