Analysis Summary
Notes:
- 1) No attempt has been made to eliminate the non-significant decimal places.
- 2) This batgrbproduct analysis is done using the HEASARC data.
- 3) This batgrbproduct analysis is using the flight position for the mask-weighting calculation.
======================================================================
BAT GRB EVENT DATA PROCESSING REPORT
Process Script Ver: batgrbproduct v2.46
Process Start Time: Mon Jan 20 07:01:46 EST 2014
Host Name: batevent1
Current Working Dir: /local/data/batevent/batevent_reproc/trigger292826
======================================================================
Trigger: 00292826 Segment: 000
BAT Trigger Time: 212949110.336 [s; MET]
Trigger Stop: 212949112.384 [s; MET]
UTC: 2007-10-01T16:31:48.074080 [includes UTCF correction]
Where From?: TDRSS position message
BAT
RA: 149.76568444715 Dec: -59.7508699680511 [deg; J2000]
Catalogged Source?: NO
Point Source?: YES
GRB Indicated?: YES [ by BAT flight software ]
Image S/N Ratio: 7.13
Image Trigger?: NO
Rate S/N Ratio: 12.8062484748657 [ if not an image trigger ]
Image S/N Ratio: 7.13
Analysis Position: [ source = BAT ]
RA: 149.76568444715 Dec: -59.7508699680511 [deg; J2000]
Refined Position: [ source = BAT pre-slew burst ]
RA: 149.724194593578 Dec: -59.7608845496022 [deg; J2000]
{ 09h 58m 53.8s , -59d 45' 39.2" }
+/- 1.81065542795613 [arcmin] (estimated 90% radius based on SNR)
+/- 0.87762355834265 [arcmin] (formal 1-sigma fit error)
SNR: 13.0251132261004
Angular difference between the analysis and refined position is 1.390410 arcmin
Partial Coding Fraction: 0.8515625 [ including projection effects ]
Duration
T90: 57.4280000030994 +/- 3.87878588845114
Measured from: 0.920000016689301
to: 58.3480000197887 [s; relative to TRIGTIME]
T50: 43.7240000069141 +/- 2.11721422018474
Measured from: 6.41600000858307
to: 50.1400000154972 [s; relative to TRIGTIME]
Fluence
Peak Flux (peak 1 second)
Measured from: 48.1400000154972
to: 49.1400000154972 [s; relative to TRIGTIME]
Total Fluence
Measured from: -0.0439999997615814
to: 61.8000000119209 [s; relative to TRIGTIME]
Band 1 Band 2 Band 3 Band 4
15-25 25-50 50-100 100-350 keV
Total 0.448945 0.544507 0.346716 0.108565
0.039304 0.040356 0.034965 0.030179 [error]
Peak 0.032794 0.048301 0.021345 0.005112
0.005294 0.005421 0.004633 0.003831 [error]
[ fluence units of on-axis counts / fully illuminated detector ]
======================================================================
====== Table of the duration information =============================
Value tstart tstop
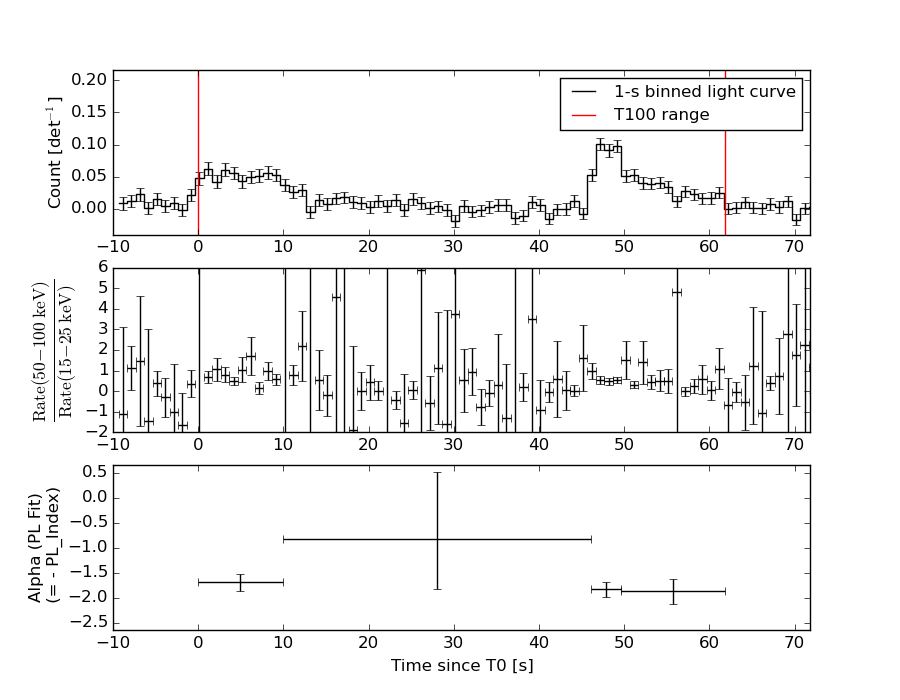
T100 61.844 -0.044 61.800
T90 57.428 0.920 58.348
T50 43.724 6.416 50.140
Peak 1.000 48.140 49.140
====== Spectral Analysis Summary =====================================
Model : spectral model: simple power-law (PL) and cutoff power-law (CPL)
Ph_index : photon index: E^{Ph_index}
Ph_90err : 90% error of the photon index
Epeak : Epeak in keV
Epeak_90err: 90% error of Epeak
Norm : normalization at 50 keV in both the PL model and CPL model
Nomr_90err : 90% error of the normalization
chi2 : Chi-Squared
dof : degree of freedo
=== Time-averaged spectral analysis ===
(Best model with acceptable fit: PL)
Model Ph_index Ph_90err_low Ph_90err_hi Epeak Epeak_90err_low Epeak_90err_hi Norm Nomr_90err_low Norm_90err_hi chi2 dof
PL -1.674 -0.156 0.153 - - - 1.37e-03 -1.29e-04 1.27e-04 42.470 57
CPL -1.356 -0.502 0.353 92.219 -36.625 -92.219 2.04e-03 -7.75e-04 2.55e-03 41.590 56
=== 1-s peak spectral analysis ===
(Best model with acceptable fit: PL)
Model Ph_index Ph_90err_low Ph_90err_hi Epeak Epeak_90err_low Epeak_90err_hi Norm Nomr_90err_low Norm_90err_hi chi2 dof
PL -1.865 -0.250 0.234 - - - 6.03e-03 -1.06e-03 1.04e-03 50.720 57
CPL -0.101 -1.212 1.689 43.827 -8.142 15.556 6.53e-02 -6.53e-02 6.06e-01 43.790 56
=== Fluence/Peak Flux Summary ===
Model Band1 Band2 Band3 Band4 Band5 Total
15-25 25-50 50-100 100-350 15-150 15-350 keV
Fluence PL 1.27e-07 2.11e-07 2.64e-07 6.58e-07 7.86e-07 1.26e-06 erg/cm2
90%_error_low -1.68e-08 -1.78e-08 -3.36e-08 -1.59e-07 -7.82e-08 -1.92e-07 erg/cm2
90%_error_hi 1.73e-08 1.78e-08 3.38e-08 1.91e-07 7.95e-08 2.18e-07 erg/cm2
Peak flux PL 3.53e-01 2.86e-01 1.57e-01 1.27e-01 8.53e-01 9.24e-01 ph/cm2/s
90%_error_low -6.73e-02 -4.08e-02 -3.49e-02 -4.61e-02 -1.21e-01 -1.35e-01 ph/cm2/s
90%_error_hi 6.96e-02 4.08e-02 3.57e-02 5.95e-02 1.21e-01 1.36e-01 ph/cm2/s
Fluence CPL 1.23e-07 2.19e-07 2.65e-07 3.80e-07 7.60e-07 9.86e-07 erg/cm2
90%_error_low -1.92e-08 -2.25e-08 -3.56e-08 -2.29e-07 -9.07e-08 -2.49e-07 erg/cm2
90%_error_hi 1.93e-08 2.35e-08 3.55e-08 3.74e-07 9.16e-08 3.53e-07 erg/cm2
Peak flux CPL 3.04e-01 3.50e-01 1.49e-01 1.81e-02 8.19e-01 8.21e-01 ph/cm2/s
90%_error_low -7.91e-02 -5.89e-02 -4.88e-02 -1.81e-02 -1.22e-01 -1.23e-01 ph/cm2/s
90%_error_hi 7.94e-02 6.20e-02 4.53e-02 4.72e-02 1.22e-01 1.26e-01 ph/cm2/s
======================================================================
Image
Pre-slew 15.0-350.0 keV image (Event data)
#   RAcent    DECcent   POSerr    Theta     Phi              Peak Cts       SNR   Name
  149.7242   -59.7609   0.0149    14.8469    63.4179         0.7075377     13.025 TRIG_00292826

Foreground time interval of the image:
 -0.044  30.565 (delta_t =  30.609 [sec])
Background time interval of the image:
-197.835  -0.044 (delta_t = 197.791 [sec])
Light Curves
Note: The mask-weighted lightcurves have units of either count/det or counts/sec/det, where a det is 0.4 x 0.4 = 0.16 sq cm.
Full-time range; 1 s binning
Other quick-look light curves:
- 64 ms binning (zoomed)
- 16 ms binning (zoomed)
- 8 ms binning (zoomed)
- 2 ms binning (zoomed)
- SN=5 or 10 s binning (full-time range)
- Raw light curve
Spectra
- 64 ms binning (zoomed)
- 16 ms binning (zoomed)
- 8 ms binning (zoomed)
- 2 ms binning (zoomed)
- SN=5 or 10 s binning (full-time range)
- Raw light curve
Spectra
Notes:
- 1) The fitting includes the systematic errors.
- 2) When the burst includes telescope slew time periods, the fitting uses an average response file made from multiple 5-s response files through out the slew time plus single time preiod for the non-slew times, and weighted by the total counts in the corresponding time period using addrmf. An average response file is needed becuase a spectral fit using the pre-slew DRM will introduce some errors in both a spectral shape and a normalization if the PHA file contains a lot of the slew/post-slew time interval.
- 3) For fits to more complicated models (e.g. a power-law over a cutoff power-law), the BAT team has decided to require a chi-square improvement of more than 6 for each extra dof.
Time averaged spectrum fit using the average DRM
Power-law model

Time interval is from   -0.044 sec. to   61.800 sec.

Spectral model in power-law:
------------------------------------------------------------
Parameters  : value       lower 90%   higher 90%
Photon index: -1.67437     ( -0.156142   0.152868 )
Norm@50keV  : 1.37033E-03    ( -0.000129148   0.000127463 )
------------------------------------------------------------
#Fit statistic : Chi-Squared =          42.47 using 59 PHA bins.
# Reduced chi-squared =         0.7451 for     57 degrees of freedom
# Null hypothesis probability =   9.241716e-01

Photon flux (15-150 keV)    in 61.84 sec: 0.180404 ( -0.015306  0.015313 ) ph/cm2/s
Energy fluence (15-150 keV)             : 7.86413e-07 ( -7.824e-08  7.94904e-08 ) ergs/cm2
Cutoff power-law model

Time interval is from   -0.044 sec. to   61.800 sec.
Spectral model in the cutoff power-law:
------------------------------------------------------------
Parameters  : value       lower 90%   higher 90%
Photon index: -1.35593     ( -0.501658   0.353242 )
Epeak [keV] : 92.2193      ( -36.6254 -92.2194 )
Norm@50keV  : 2.04137E-03    ( -0.000775164   0.00254658 )
------------------------------------------------------------
#Fit statistic : Chi-Squared =          41.59 using 59 PHA bins.
# Reduced chi-squared =         0.7427 for     56 degrees of freedom
# Null hypothesis probability =   9.244095e-01

Photon flux (15-150 keV)    in 61.84 sec: 0.177757 ( -0.016054  0.016022 ) ph/cm2/s
Energy fluence (15-150 keV)             : 7.60416e-07 ( -9.0655e-08  9.16432e-08 ) ergs/cm2
1-s peak spectrum fit
Power-law model
Time interval is from   48.140 sec. to   49.140 sec.

Spectral model in power-law:
------------------------------------------------------------
Parameters  : value       lower 90%   higher 90%
Photon index: -1.86537     ( -0.25023   0.234082 )
Norm@50keV  : 6.03364E-03    ( -0.00105962   0.00103747 )
------------------------------------------------------------
#Fit statistic : Chi-Squared =          50.72 using 59 PHA bins.
# Reduced chi-squared =         0.8899 for     57 degrees of freedom
# Null hypothesis probability =   7.081593e-01

Photon flux (15-150 keV)    in 1 sec: 0.853491 ( -0.121295  0.121295 ) ph/cm2/s
Energy fluence (15-150 keV)             : 5.54766e-08 ( -9.53353e-09  9.80638e-09 ) ergs/cm2
Cutoff power-law model
Time interval is from   48.140 sec. to   49.140 sec.
Spectral model in the cutoff power-law:
------------------------------------------------------------
Parameters  : value       lower 90%   higher 90%
Photon index: -0.10112     ( -1.21342   1.68738 )
Epeak [keV] : 43.8269      ( -8.13608 15.562 )
Norm@50keV  : 6.52538E-02    ( -0.0654319   0.605975 )
------------------------------------------------------------
#Fit statistic : Chi-Squared =          43.79 using 59 PHA bins.
# Reduced chi-squared =         0.7819 for     56 degrees of freedom
# Null hypothesis probability =   8.821913e-01

Photon flux (15-150 keV)    in 1 sec: 0.819115 ( -0.121621  0.122296 ) ph/cm2/s
Energy fluence (15-150 keV)             : 4.80784e-08 ( -9.0213e-09  1.02675e-08 ) ergs/cm2
Time-resolved spectra
Distribution
T90 vs. Hardness ratio plot
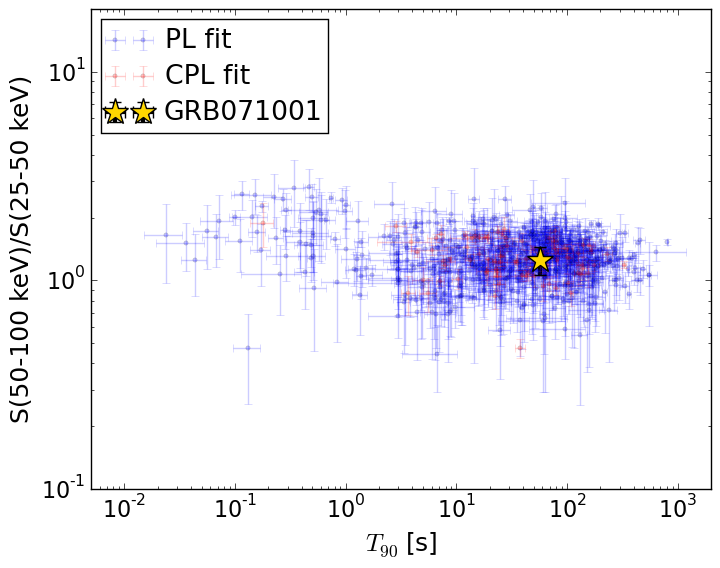
T90                                   = 57.428 sec.
Hardness ratio (energy fluence ratio) = 1.2532273327
S(15-50 keV) vs. S(50-150 keV) plot
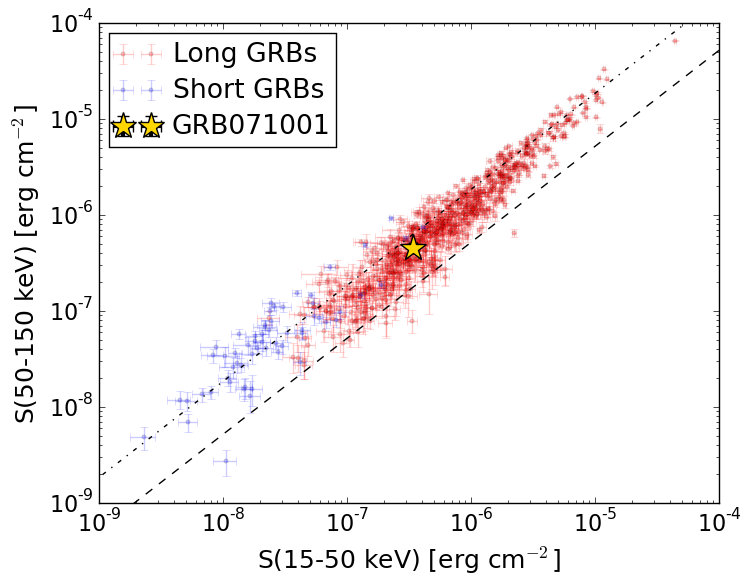
S(15-50 keV)  = 3.380885e-07
S(50-150 keV) = 4.48331e-07
The dash-dotted line and the dashed line traces the fluences calculated from the Band function with Epeak = 15 and 150 keV, respectively. Both lines assume a canonical values of alpha = -1 and beta = -2.5.
Mask shadow pattern
IMX = 1.186208010585904E-01, IMY = -2.370653090943753E-01
Spacecraft aspect plot
Bright source in the pre-burst/pre-slew/post-slew images
Pre-burst image of 15-350 keV band
Time interval of the image:
-197.835400 -0.044000

# RAcent  DECcent POSerr Theta    Phi  PeakCts   SNR AngSep     Name
#  [deg]    [deg]    ['] [deg]  [deg]                   [']
135.5379 -40.4036    0.5  18.8  141.7   3.8106  24.3    9.1	Vela X-1
170.2465 -60.6890    6.1  15.6   23.9   0.2725   1.9    4.5	Cen X-3
186.6560 -62.7707   22.8  22.2    9.8   0.0734   0.5    0.0	GX 301-2
202.2847 -47.5535    2.5  28.4  -29.5   0.6898   4.7 ------	UNKNOWN
180.3431 -21.8092    2.0  29.4  -97.0   1.1912   5.8 ------	UNKNOWN
Pre-slew background subtracted image of 15-350 keV band
Time interval of the image:
-0.044000 30.564620

# RAcent  DECcent POSerr Theta    Phi  PeakCts   SNR AngSep     Name
#  [deg]    [deg]    ['] [deg]  [deg]                   [']
135.5845 -40.4364    2.2  18.8  141.7  -0.3221  -5.3    7.5	Vela X-1
170.0550 -60.5435    9.2  15.4   24.0  -0.0720  -1.2    9.0	Cen X-3
187.0843 -62.7109   98.0  22.3    9.4   0.0068   0.1   12.3	GX 301-2
268.9651 -86.3950    2.4  45.0   37.6   0.8611   4.9 ------	UNKNOWN
149.7243 -59.7609    0.9  14.8   63.4   0.7076  13.0 ------	UNKNOWN
154.0211 -19.6628    2.1  27.1 -150.5   0.3313   5.4 ------	UNKNOWN
Post-slew image of 15-350 keV band
Time interval of the image:
71.364610 962.724000

# RAcent  DECcent POSerr Theta    Phi  PeakCts   SNR AngSep     Name
#  [deg]    [deg]    ['] [deg]  [deg]                   [']
135.5303 -40.4455    0.3  21.3 -163.9  14.5250  34.8    6.6	Vela X-1
170.4664 -60.8216    0.0  10.3  -27.9  -0.9957  -2.1   12.7	Cen X-3
186.5808 -62.6650    3.4  17.7  -17.5   1.3129   3.3    6.7	GX 301-2
124.9698  -9.3419    2.4  53.7 -163.7   5.8509   4.8 ------	UNKNOWN
201.2593 -42.9741    2.4  35.1  -47.8   2.9011   4.9 ------	UNKNOWN
189.8649 -33.6022    4.2  37.0  -69.7   3.3368   2.7 ------	UNKNOWN
139.5342  -5.0666    6.2  55.2 -145.3   6.3355   1.9 ------	UNKNOWN
152.6242 -11.8984    2.6  47.9 -129.1   8.8594   4.5 ------	UNKNOWN
207.1411 -31.2923    3.2  47.1  -53.6   7.6491   3.6 ------	UNKNOWN