Analysis Summary
Notes:
- 1) No attempt has been made to eliminate the non-significant decimal places.
- 2) This batgrbproduct analysis is done using the HEASARC data.
- 3) This batgrbproduct analysis is using the flight position for the mask-weighting calculation.
==========================================================================
           BAT GROUND-DETECTED GRB DATA PROCESSING REPORT
    Process Script Ver: batgrbproduct v2.46
    Process Start Time: Thu Dec 17 19:49:49 EST 2015
             Host Name: bat1
   Current Working Dir: /local/data/bat1/alien/Swift_3rdBATcatalog/event/batevent_reproc/trigger293250
======================================================================

  Trigger: 00293250      Segment: 000

  BAT Trigger Time: 213345699.2
               UTC: 2007-10-06T06:41:36.928   [includes UTCF correction]
       Where From?: Ground analysis (best_duration.txt)
  NOTE: BAT trigger time for ground-detected burst is the T100 start time.

  Analysis Position:   [ source = GCN ]
    RA: 335.282   Dec: -23.152  [deg; J2000]

  Refined Position:   [ source = BAT pre-slew image ]
    RA: 335.281762676   Dec: -23.1520164772  [deg; J2000]
        { 22h 21m 07.6s , -23d -9' -7.3" }
        +/- 2.21989738823 [arcmin] (estimated 90% radius based on SNR)
    SNR: 9.73674758712


  Angular difference between the analysis and refined position is 0.013130 arcmin

  Partial Coding Fraction: 0.05566406    [ including projection effects ]

  Duration
     T90: 43.2000000178814 +/- 1.6
        Measured from: 1.6
                   to: 44.8     [s; relative to TRIGTIME]
     T50: 24.0000000298023 +/- 1.6
        Measured from: 11.2
                   to: 35.2     [s; relative to TRIGTIME]


====== Table of the duration information =============================

        Value   tstart    tstop
T100   46.400    0.000   46.400
T90    43.200    1.600   44.800
T50    24.000   11.200   35.200
Peak    1.000   35.500   36.500


====== Spectral Analysis Summary =====================================

Model      : spectral model: simple power-law (PL) and cutoff power-law (CPL)
Ph_index   : photon index: E^{Ph_index}
Ph_90err   : 90% error of the photon index
Epeak      : Epeak in keV
Epeak_90err: 90% error of Epeak
Norm       : normalization at 50 keV in both the PL model and CPL model
Nomr_90err : 90% error of the normalization
chi2       : Chi-Squared
dof        : degree of freedo

=== Time-averaged spectral analysis ===
(Best model with acceptable fit: N/A)

Model Ph_index Ph_90err_low Ph_90err_hi  Epeak  Epeak_90err_low  Epeak_90err_hi  Norm       Nomr_90err_low    Norm_90err_hi    chi2    dof
PL      N/A        N/A       N/A          -           -               -           N/A           N/A               N/A         N/A        N/A
CPL     N/A        N/A        N/A          N/A         N/A           N/A           N/A           N/A               N/A         N/A        N/A


=== 1-s peak spectral analysis ===
(Best model with acceptable fit: N/A)

Model Ph_index Ph_90err_low Ph_90err_hi  Epeak  Epeak_90err_low  Epeak_90err_hi  Norm       Nomr_90err_low    Norm_90err_hi    chi2    dof
PL      N/A         N/A       N/A          -           -               -           N/A           N/A               N/A         N/A        N/A
CPL     N/A         N/A       N/A          N/A         N/A           N/A           N/A           N/A               N/A         N/A        N/A


=== Fluence/Peak Flux Summary ===

              Model    Band1     Band2     Band3     Band4     Band5     Total
                       15-25     25-50    50-100    100-350    15-150    15-350    keV
Fluence         PL    N/A      N/A      N/A      N/A      N/A      N/A      erg/cm2
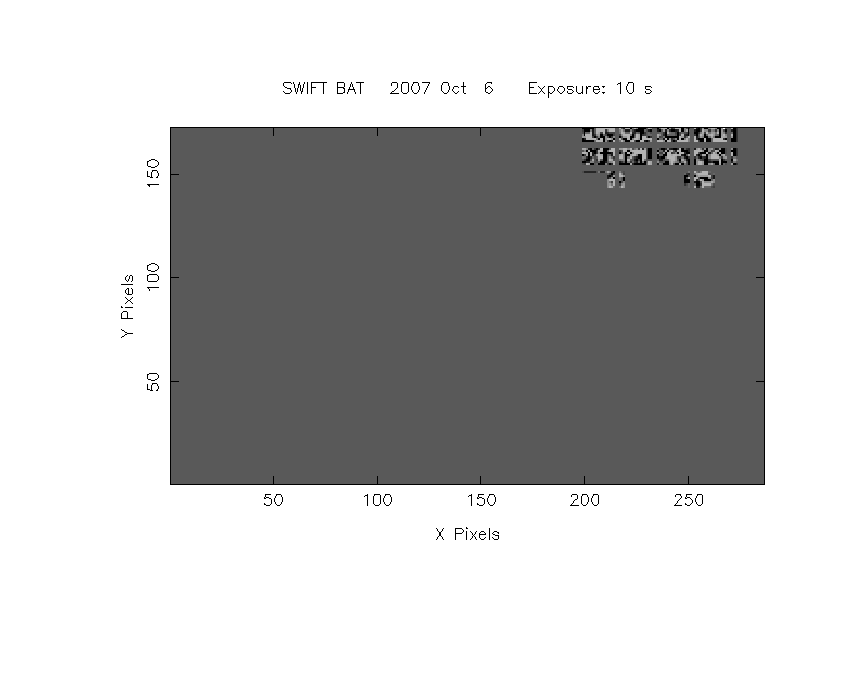
Image
15.0-350.0 keV image (Event data with DETECTION mask)

#RAcent DECcent POSerr Theta  Phi  Peak_Cts  SNR Name
335.282 -23.152 0.020 47.279 131.130 1.581 9.737 TRIG_00293250

Image time interval: 10.800 to 20.874 [sec]
Light Curves
Note: The mask-weighted lightcurves have units of either count/det or counts/sec/det, where a det is 0.4 x 0.4 = 0.16 sq cm.
Best duration plot

Full-time range; 1 s binning
Other quick-look light curves:
- 64 ms binning (zoomed)
- 16 ms binning (zoomed)
- 8 ms binning (zoomed)
- 2 ms binning (zoomed)
- SN=5 or 10 s binning (full-time range)
- Raw light curve
Spectra
- 64 ms binning (zoomed)
- 16 ms binning (zoomed)
- 8 ms binning (zoomed)
- 2 ms binning (zoomed)
- SN=5 or 10 s binning (full-time range)
- Raw light curve
Spectra
Notes:
- 1) The fitting includes the systematic errors.
- 2) When the burst includes telescope slew time periods, the fitting uses an average response file made from multiple 5-s response files through out the slew time plus single time preiod for the non-slew times, and weighted by the total counts in the corresponding time period using addrmf. An average response file is needed becuase a spectral fit using the pre-slew DRM will introduce some errors in both a spectral shape and a normalization if the PHA file contains a lot of the slew/post-slew time interval.
- 3) For fits to more complicated models (e.g. a power-law over a cutoff power-law), the BAT team has decided to require a chi-square improvement of more than 6 for each extra dof.
Time averaged spectrum fit using the average DRM
Power-law model

Multiple GTIs in the spectrum
tstart tstop
Photon index:       (       )
Cutoff power-law model

Multiple GTIs in the spectrum
tstart tstop
Photon index:       (       )
1-s peak spectrum fit
Power-law model

Time interval is from   10.800 sec. to   20.874 sec.
Photon index:       (       )
Cutoff power-law model

Time interval is from   10.800 sec. to   20.874 sec.
Photon index:       (       )
Time-resolved spectra

Distribution
T90 vs. Hardness ratio plot
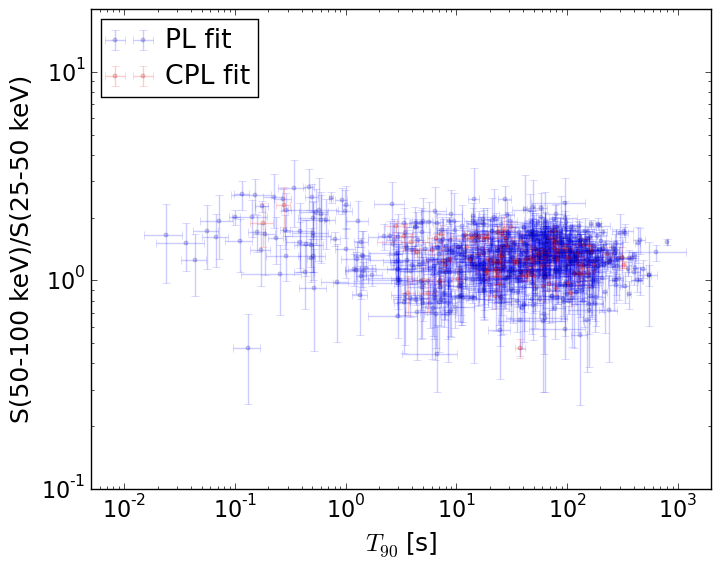
T90                                   = N/A sec.
Hardness ratio (energy fluence ratio) = N/A
S(15-50 keV) vs. S(50-150 keV) plot
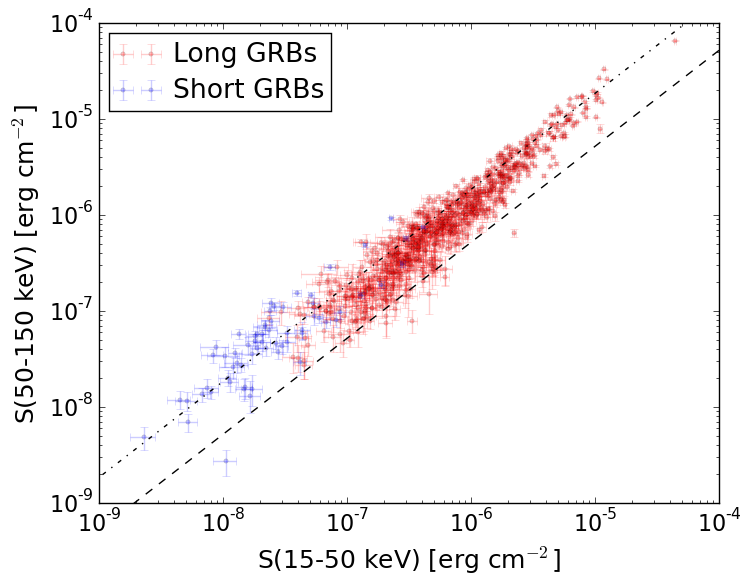
S(15-50 keV)  = N/A
S(50-150 keV) = N/A
The dash-dotted line and the dashed line traces the fluences calculated from the Band function with Epeak = 15 and 150 keV, respectively. Both lines assume a canonical values of alpha = -1 and beta = -2.5.
Mask shadow pattern (with DETECTION mask)
IMX = -0.712295025523, IMY = -0.81564534472
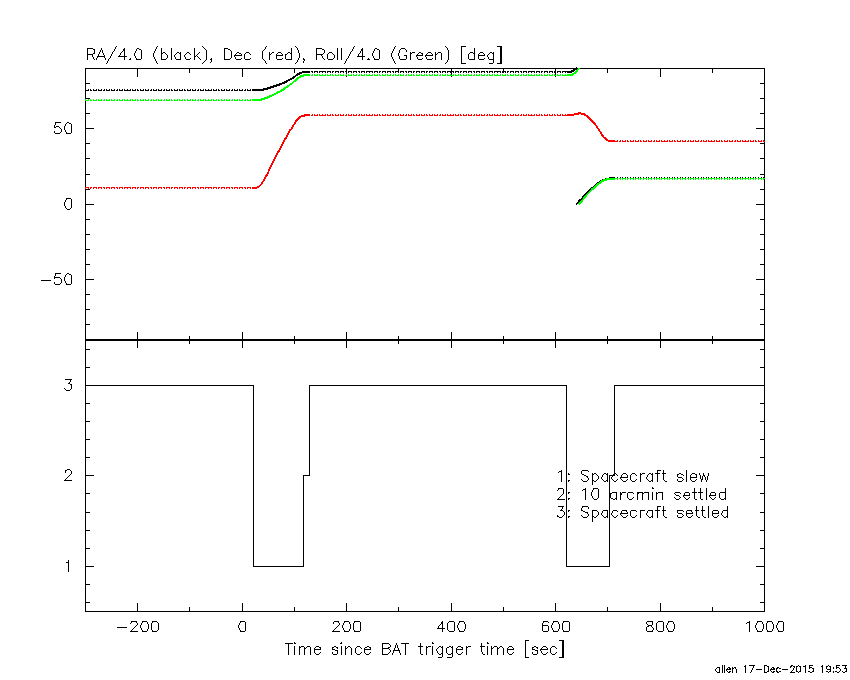
Spacecraft aspect plot
Bright source in the event data image
Event data image of 15-350 keV band
Time interval of the image:
10.800000 20.874400

# RAcent  DECcent POSerr Theta    Phi  PeakCts   SNR AngSep     Name
#  [deg]    [deg]    ['] [deg]  [deg]                   [']
263.1399 -24.7097    8.0  51.8 -139.0   0.1955   1.4    7.5	GX 1+4
268.3182  -1.3403    5.1  35.4 -113.3   0.1221   2.3    7.4	SW J1753.5-0127
270.2113 -25.1225    3.1  47.4 -145.1   0.2278   3.7    4.7	GX 5-1
270.1892 -25.6593    7.1  47.8 -145.6  -0.1082  -1.6    7.9	GRS 1758-258
273.9218 -13.8788   27.3  37.1 -136.4  -0.0197  -0.4   10.6	GX 17+2
276.0116 -30.5402    4.2  48.3 -155.1   0.1659   2.7   11.3	H1820-303
284.9642 -24.8699    6.7  39.3 -160.7  -0.0729  -1.7    4.9	HT1900.1-2455
288.8448  10.9386    4.2  12.7  -93.8   0.0858   2.8    2.8	GRS 1915+105
299.5890  35.1848    0.8  24.4   -9.5   0.4384  14.2    1.0	Cyg X-1
308.1241  41.1026    4.9  30.7    4.2   0.0861   2.3    9.0	Cyg X-3
326.2903  38.1348   29.3  35.0   29.6   0.0174   0.4   12.5	Cyg X-2
263.1202 -33.8842    3.7  57.9 -147.4   0.7517   3.1    7.2	GX 354-0
350.0016  27.8095    1.9  48.2   57.1   1.6962   6.1 ------	UNKNOWN
335.2817 -23.1520    1.2  47.3  131.1   1.5804   9.7 ------	UNKNOWN
263.2731  18.6151    2.3  37.9  -78.8   0.3299   4.9 ------	UNKNOWN
261.5586 -22.1260    3.0  51.4 -135.3   0.6060   3.9 ------	UNKNOWN
Webpage updated on:
Thu Dec 17 19:53:24 EST 2015