Analysis Summary
Notes:
- 1) No attempt has been made to eliminate the non-significant decimal places.
- 2) This batgrbproduct analysis is done using the HEASARC data.
- 3) This batgrbproduct analysis is using the flight position for the mask-weighting calculation.
======================================================================
BAT GRB EVENT DATA PROCESSING REPORT
Process Script Ver: batgrbproduct v2.46
Process Start Time: Mon Jan 20 06:49:36 EST 2014
Host Name: batevent1
Current Working Dir: /local/data/batevent/batevent_reproc/trigger293587
======================================================================
Trigger: 00293587 Segment: 000
BAT Trigger Time: 213573359.04 [s; MET]
Trigger Stop: 213573363.136 [s; MET]
UTC: 2007-10-08T21:55:56.761900 [includes UTCF correction]
Where From?: TDRSS position message
BAT
RA: 151.547964114205 Dec: 44.3338686638463 [deg; J2000]
Catalogged Source?: NO
Point Source?: YES
GRB Indicated?: YES [ by BAT flight software ]
Image S/N Ratio: 9.42
Image Trigger?: NO
Rate S/N Ratio: 11.6619037896906 [ if not an image trigger ]
Image S/N Ratio: 9.42
Analysis Position: [ source = BAT ]
RA: 151.547964114205 Dec: 44.3338686638463 [deg; J2000]
Refined Position: [ source = BAT pre-slew burst ]
RA: 151.565618302677 Dec: 44.3054742583822 [deg; J2000]
{ 10h 06m 15.7s , +44d 18' 19.7" }
+/- 1.94059627467662 [arcmin] (estimated 90% radius based on SNR)
+/- 0.789071746762406 [arcmin] (formal 1-sigma fit error)
SNR: 11.7972936444498
Angular difference between the analysis and refined position is 1.864618 arcmin
Partial Coding Fraction: 0.8828125 [ including projection effects ]
Duration
T90: 17.9839999973774 +/- 5.13886522246629
Measured from: -8.0639999806881
to: 9.9200000166893 [s; relative to TRIGTIME]
T50: 5.31200003623962 +/- 2.7882266629656
Measured from: -1.85600000619888
to: 3.45600003004074 [s; relative to TRIGTIME]
Fluence
Peak Flux (peak 1 second)
Measured from: 0.172000020742416
to: 1.17200002074242 [s; relative to TRIGTIME]
Total Fluence
Measured from: -11.0079999864101
to: 13.5680000185966 [s; relative to TRIGTIME]
Band 1 Band 2 Band 3 Band 4
15-25 25-50 50-100 100-350 keV
Total 0.218529 0.199022 0.100754 0.000574
0.023034 0.023708 0.020299 0.017339 [error]
Peak 0.028041 0.023773 0.007286 0.003878
0.004749 0.004888 0.004208 0.003584 [error]
[ fluence units of on-axis counts / fully illuminated detector ]
======================================================================
====== Table of the duration information =============================
Value tstart tstop
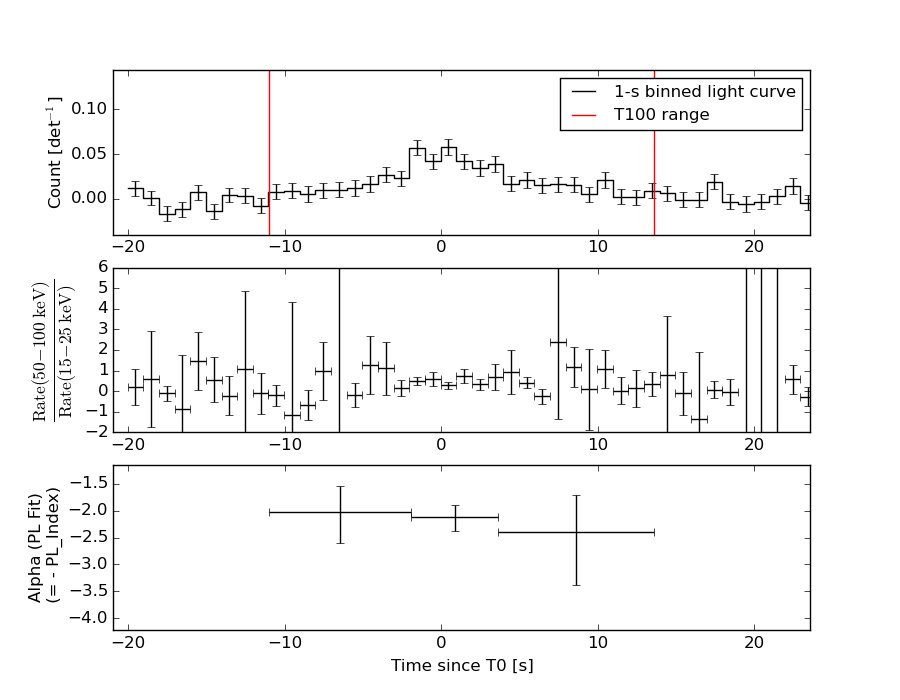
T100 24.576 -11.008 13.568
T90 17.984 -8.064 9.920
T50 5.312 -1.856 3.456
Peak 1.000 0.172 1.172
====== Spectral Analysis Summary =====================================
Model : spectral model: simple power-law (PL) and cutoff power-law (CPL)
Ph_index : photon index: E^{Ph_index}
Ph_90err : 90% error of the photon index
Epeak : Epeak in keV
Epeak_90err: 90% error of Epeak
Norm : normalization at 50 keV in both the PL model and CPL model
Nomr_90err : 90% error of the normalization
chi2 : Chi-Squared
dof : degree of freedo
=== Time-averaged spectral analysis ===
(Best model with acceptable fit: PL)
Model Ph_index Ph_90err_low Ph_90err_hi Epeak Epeak_90err_low Epeak_90err_hi Norm Nomr_90err_low Norm_90err_hi chi2 dof
PL -2.144 -0.262 0.240 - - - 1.09e-03 -2.03e-04 1.98e-04 45.810 57
CPL -1.108 -1.048 1.405 32.684 N/A N/A 4.70e-03 N/A N/A 42.950 56
=== 1-s peak spectral analysis ===
(Best model with acceptable fit: PL)
Model Ph_index Ph_90err_low Ph_90err_hi Epeak Epeak_90err_low Epeak_90err_hi Norm Nomr_90err_low Norm_90err_hi chi2 dof
PL -2.285 -0.522 0.430 - - - 2.82e-03 -1.03e-03 1.01e-03 59.900 57
CPL -1.473 -0.617 3.454 22.934 N/A N/A 9.40e-03 N/A N/A 59.400 56
=== Fluence/Peak Flux Summary ===
Model Band1 Band2 Band3 Band4 Band5 Total
15-25 25-50 50-100 100-350 15-150 15-350 keV
Fluence PL 6.28e-08 7.81e-08 7.07e-08 1.11e-07 2.50e-07 3.23e-07 erg/cm2
90%_error_low -1.02e-08 -1.06e-08 -1.73e-08 -4.48e-08 -4.03e-08 -6.92e-08 erg/cm2
90%_error_hi 1.04e-08 1.05e-08 1.82e-08 6.16e-08 4.18e-08 8.24e-08 erg/cm2
Peak flux PL 2.48e-01 1.58e-01 6.47e-02 3.60e-02 4.89e-01 5.07e-01 ph/cm2/s
90%_error_low -6.70e-02 -3.98e-02 -2.90e-02 -2.30e-02 -1.10e-01 -1.17e-01 ph/cm2/s
90%_error_hi 6.85e-02 3.83e-02 3.23e-02 3.99e-02 1.10e-01 1.18e-01 ph/cm2/s
Fluence CPL 5.96e-08 8.81e-08 6.24e-08 1.99e-08 2.25e-07 2.30e-07 erg/cm2
90%_error_low -1.13e-08 -1.46e-08 -2.37e-08 -1.71e-08 -4.08e-08 -4.53e-08 erg/cm2
90%_error_hi 1.12e-08 1.51e-08 2.20e-08 8.95e-08 4.68e-08 6.20e-08 erg/cm2
Peak flux CPL 2.42e-01 1.73e-01 5.74e-02 9.81e-03 4.80e-01 4.82e-01 ph/cm2/s
90%_error_low -7.27e-02 N/A -5.74e-02 N/A -1.10e-01 N/A ph/cm2/s
90%_error_hi 7.06e-02 N/A 3.76e-02 N/A 1.11e-01 N/A ph/cm2/s
======================================================================
Image
Pre-slew 15.0-350.0 keV image (Event data)
#   RAcent    DECcent   POSerr    Theta     Phi              Peak Cts       SNR   Name
  151.5656    44.3055   0.0163    12.4975    82.7443         0.5594325     11.797 TRIG_00293587

Foreground time interval of the image:
-11.008  13.568 (delta_t =  24.576 [sec])
Background time interval of the image:
-139.939 -11.008 (delta_t = 128.931 [sec])
Light Curves
Note: The mask-weighted lightcurves have units of either count/det or counts/sec/det, where a det is 0.4 x 0.4 = 0.16 sq cm.
Full-time range; 1 s binning
Other quick-look light curves:
- 64 ms binning (zoomed)
- 16 ms binning (zoomed)
- 8 ms binning (zoomed)
- 2 ms binning (zoomed)
- SN=5 or 10 s binning (full-time range)
- Raw light curve
Spectra
- 64 ms binning (zoomed)
- 16 ms binning (zoomed)
- 8 ms binning (zoomed)
- 2 ms binning (zoomed)
- SN=5 or 10 s binning (full-time range)
- Raw light curve
Spectra
Notes:
- 1) The fitting includes the systematic errors.
- 2) When the burst includes telescope slew time periods, the fitting uses an average response file made from multiple 5-s response files through out the slew time plus single time preiod for the non-slew times, and weighted by the total counts in the corresponding time period using addrmf. An average response file is needed becuase a spectral fit using the pre-slew DRM will introduce some errors in both a spectral shape and a normalization if the PHA file contains a lot of the slew/post-slew time interval.
- 3) For fits to more complicated models (e.g. a power-law over a cutoff power-law), the BAT team has decided to require a chi-square improvement of more than 6 for each extra dof.
Time averaged spectrum fit using the average DRM
Power-law model
Time interval is from  -11.008 sec. to   13.568 sec.

Spectral model in power-law:
------------------------------------------------------------
Parameters  : value       lower 90%   higher 90%
Photon index: -2.14419     ( -0.262174   0.240176 )
Norm@50keV  : 1.08842E-03    ( -0.000202509   0.00019819 )
------------------------------------------------------------
#Fit statistic : Chi-Squared =          45.81 using 59 PHA bins.
# Reduced chi-squared =         0.8037 for     57 degrees of freedom
# Null hypothesis probability =   8.558285e-01

Photon flux (15-150 keV)    in 24.58 sec: 0.175084 ( -0.022365  0.022369 ) ph/cm2/s
Energy fluence (15-150 keV)             : 2.49789e-07 ( -4.02903e-08  4.18003e-08 ) ergs/cm2
Cutoff power-law model
Time interval is from  -11.008 sec. to   13.568 sec.
Spectral model in the cutoff power-law:
------------------------------------------------------------
Parameters  : value       lower 90%   higher 90%
Photon index: -1.10799     ( -1.04826   1.40462 )
Epeak [keV] : 32.6837      (   )
Norm@50keV  : 4.70369E-03    (     )
------------------------------------------------------------
#Fit statistic : Chi-Squared =          42.95 using 59 PHA bins.
# Reduced chi-squared =         0.7669 for     56 degrees of freedom
# Null hypothesis probability =   8.998061e-01

Photon flux (15-150 keV)    in 24.58 sec: 0.170107 ( -0.022564  0.022728 ) ph/cm2/s
Energy fluence (15-150 keV)             : 2.25109e-07 ( -4.08057e-08  4.67681e-08 ) ergs/cm2
1-s peak spectrum fit
Power-law model
Time interval is from    0.172 sec. to    1.172 sec.

Spectral model in power-law:
------------------------------------------------------------
Parameters  : value       lower 90%   higher 90%
Photon index: -2.28526     ( -0.522424   0.429843 )
Norm@50keV  : 2.82075E-03    ( -0.0010337   0.00101088 )
------------------------------------------------------------
#Fit statistic : Chi-Squared =          59.90 using 59 PHA bins.
# Reduced chi-squared =          1.051 for     57 degrees of freedom
# Null hypothesis probability =   3.708619e-01

Photon flux (15-150 keV)    in 1 sec: 0.488993 ( -0.109673  0.109843 ) ph/cm2/s
Energy fluence (15-150 keV)             : 2.68893e-08 ( -7.81713e-09  8.44366e-09 ) ergs/cm2
Cutoff power-law model
Time interval is from    0.172 sec. to    1.172 sec.
Spectral model in the cutoff power-law:
------------------------------------------------------------
Parameters  : value       lower 90%   higher 90%
Photon index: -1.47286     ( -0.617039   3.45379 )
Epeak [keV] : 22.9340      (   )
Norm@50keV  : 9.39652E-03    (     )
------------------------------------------------------------
#Fit statistic : Chi-Squared =          59.40 using 59 PHA bins.
# Reduced chi-squared =          1.061 for     56 degrees of freedom
# Null hypothesis probability =   3.528500e-01

Photon flux (15-150 keV)    in 1 sec: 0.480227 ( -0.110134  0.111386 ) ph/cm2/s
Energy fluence (15-150 keV)             : 0 ( 0  0 ) ergs/cm2
Time-resolved spectra
Distribution
T90 vs. Hardness ratio plot
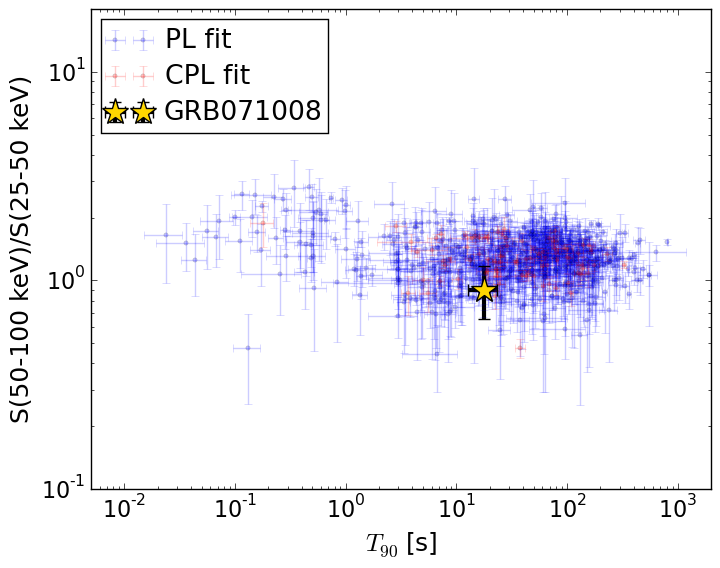
T90                                   = 17.984 sec.
Hardness ratio (energy fluence ratio) = 0.904940647028
S(15-50 keV) vs. S(50-150 keV) plot
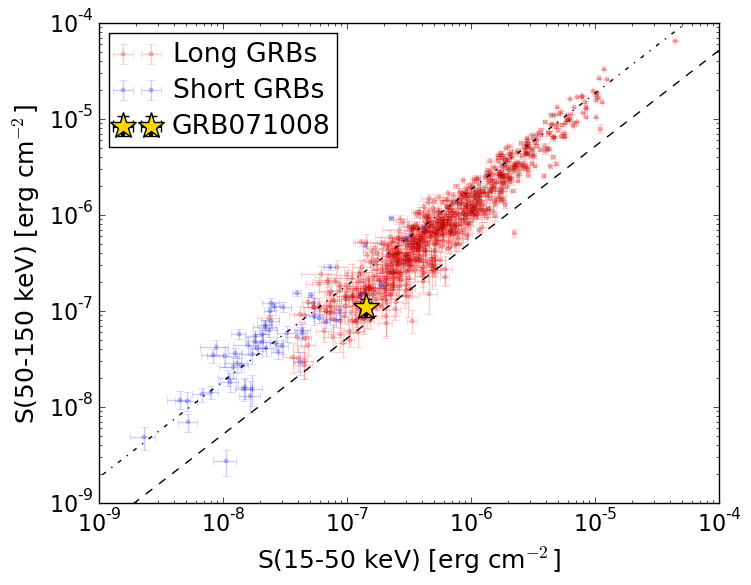
S(15-50 keV)  = 1.409058e-07
S(50-150 keV) = 1.0888761e-07
The dash-dotted line and the dashed line traces the fluences calculated from the Band function with Epeak = 15 and 150 keV, respectively. Both lines assume a canonical values of alpha = -1 and beta = -2.5.
Mask shadow pattern
IMX = 2.799371261699209E-02, IMY = -2.198732670486664E-01
Spacecraft aspect plot
Bright source in the pre-burst/pre-slew/post-slew images
Pre-burst image of 15-350 keV band
Time interval of the image:
-139.939410 -11.008000

# RAcent  DECcent POSerr Theta    Phi  PeakCts   SNR AngSep     Name
#  [deg]    [deg]    ['] [deg]  [deg]                   [']
157.2082   7.4205    2.6  31.7  -24.9   0.4939   4.3 ------	UNKNOWN
Pre-slew background subtracted image of 15-350 keV band
Time interval of the image:
-11.008000 13.568000

# RAcent  DECcent POSerr Theta    Phi  PeakCts   SNR AngSep     Name
#  [deg]    [deg]    ['] [deg]  [deg]                   [']
151.5656  44.3055    1.0  12.5   82.7   0.5594  11.8 ------	UNKNOWN
220.1438  64.8128    2.4  41.0  170.0   0.3237   4.7 ------	UNKNOWN
168.2517  35.9640    2.0   2.8  -82.8   0.2238   5.7 ------	UNKNOWN
141.5145  -1.8676    2.1  45.9   -6.5   0.4390   5.5 ------	UNKNOWN
219.2586  34.4384    2.1  42.5 -143.8   0.4323   5.6 ------	UNKNOWN
Post-slew image of 15-350 keV band
Time interval of the image:
-239.040000 962.958500

# RAcent  DECcent POSerr Theta    Phi  PeakCts   SNR AngSep     Name
#  [deg]    [deg]    ['] [deg]  [deg]                   [']
115.3740  52.9875    2.9  37.5   88.5   5.7207   4.0 ------	UNKNOWN
142.0152  33.4683    2.6  19.9   42.2   2.0043   4.5 ------	UNKNOWN
132.2746   8.5812    3.0  42.3   12.9   2.7549   3.8 ------	UNKNOWN
251.8629  56.5514    3.7  56.9  179.3  10.1727   3.2 ------	UNKNOWN
148.4384 -13.4571    2.3  54.1  -20.5   7.0737   5.1 ------	UNKNOWN
199.7844  10.2891    5.5  41.1  -98.1   7.8123   2.1 ------	UNKNOWN