Analysis Summary
Notes:
- 1) No attempt has been made to eliminate the non-significant decimal places.
- 2) This batgrbproduct analysis is done using the HEASARC data.
- 3) This batgrbproduct analysis is using the flight position for the mask-weighting calculation.
======================================================================
                  BAT GRB EVENT DATA PROCESSING REPORT
    Process Script Ver: batgrbproduct v2.46
    Process Start Time: Mon Jan 20 06:35:45 EST 2014
             Host Name: batevent1
   Current Working Dir: /local/data/batevent/batevent_reproc/trigger293795
======================================================================

  Trigger: 00293795      Segment: 000

  BAT Trigger Time: 213741950.272   [s; MET]
      Trigger Stop: 213741950.784   [s; MET]
               UTC: 2007-10-10T20:45:47.989540    [includes UTCF correction]
       Where From?: TDRSS position message

  BAT
    RA: 150.529562485653   Dec: 45.7315763506084  [deg; J2000]

     Catalogged Source?: NO
     Point Source?:      YES
     GRB Indicated?:     YES    [ by BAT flight software ]
     Image S/N Ratio:    19.16
     Image Trigger?:     NO
     Rate S/N Ratio:     52.9622507074614  [ if not an image trigger ]
     Image S/N Ratio:    19.16

  Analysis Position:   [ source = BAT ]
    RA: 150.529562485653   Dec: 45.7315763506084  [deg; J2000]

  Refined Position:   [ source = BAT pre-slew burst ]
    RA: 150.532556113514   Dec: 45.734497459115  [deg; J2000]
        { 10h 02m 07.8s , +45d 44' 04.2" }
         +/- 0.502636293655703 [arcmin] (estimated 90% radius based on SNR)
         +/- 0.133850358908783 [arcmin] (formal 1-sigma fit error)
    SNR: 81.2640761398187

  Angular difference between the analysis and refined position is 0.215492 arcmin

  Partial Coding Fraction: 0.84375    [ including projection effects ]

  Duration
     T90: 36.1240000128746 +/- 2.27575042634801
        Measured from: -21.4640000164509
                   to: 14.6599999964237     [s; relative to TRIGTIME]
     T50: 5.84400001168251 +/- 0.218357507512768
        Measured from: 1.15199998021126
                   to: 6.99599999189377     [s; relative to TRIGTIME]


  Fluence
     Peak Flux  (peak 1 second)
        Measured from: 1.39599999785423
                   to: 2.39599999785423     [s; relative to TRIGTIME]
     Total Fluence
        Measured from: -35.7400000095367
                   to: 23.8279999792576     [s; relative to TRIGTIME]

             Band 1     Band 2     Band 3     Band 4
              15-25      25-50     50-100    100-350     keV
 Total     2.813830   3.288227   1.796137   0.301604
           0.043118   0.045314   0.038507   0.030769 [error]
 Peak      0.249396   0.363235   0.228112   0.037554
           0.008118   0.009191   0.007836   0.005011 [error]

     [ fluence units of on-axis counts / fully illuminated detector ]

======================================================================


====== Table of the duration information =============================

        Value   tstart    tstop
T100   59.568  -35.740   23.828
T90    36.124  -21.464   14.660
T50     5.844    1.152    6.996
Peak    1.000    1.396    2.396


====== Spectral Analysis Summary =====================================

Model      : spectral model: simple power-law (PL) and cutoff power-law (CPL)
Ph_index   : photon index: E^{Ph_index}
Ph_90err   : 90% error of the photon index
Epeak      : Epeak in keV
Epeak_90err: 90% error of Epeak
Norm       : normalization at 50 keV in both the PL model and CPL model
Nomr_90err : 90% error of the normalization
chi2       : Chi-Squared
dof        : degree of freedo

=== Time-averaged spectral analysis ===
(Best model with acceptable fit: PL)

Model Ph_index Ph_90err_low Ph_90err_hi  Epeak  Epeak_90err_low  Epeak_90err_hi  Norm       Nomr_90err_low    Norm_90err_hi    chi2    dof
PL      -1.966    -0.044      0.043       -           -               -         8.42e-03     -1.89e-04          1.89e-04      58.900   57
CPL     -1.520    -0.187      0.195       54.782      -5.512         7.238      1.38e-02     -2.54e-03          3.28e-03      41.440   56


=== 1-s peak spectral analysis ===
(Best model with acceptable fit: CPL)

Model Ph_index Ph_90err_low Ph_90err_hi  Epeak  Epeak_90err_low  Epeak_90err_hi  Norm       Nomr_90err_low    Norm_90err_hi    chi2    dof
PL      -1.735     -0.058     0.058       -           -               -         5.71e-02     -1.94e-03          1.93e-03      86.280   57
CPL     -1.001     -0.259     0.275       68.532      -6.984        11.732      1.33e-01     -3.34e-02          4.81e-02      60.400   56


=== Fluence/Peak Flux Summary ===

              Model    Band1     Band2     Band3     Band4     Band5     Total
                       15-25     25-50    50-100    100-350    15-150    15-350    keV
Fluence         PL   9.94e-07  1.38e-06  1.41e-06  2.63e-06  4.62e-06  6.41e-06   erg/cm2
      90%_error_low -4.16e-08 -3.30e-08 -4.21e-08 -1.71e-07 -1.02e-07 -1.99e-07   erg/cm2
      90%_error_hi   4.23e-08  3.29e-08  4.20e-08  1.79e-07  1.02e-07  2.04e-07   erg/cm2
Peak flux       PL   2.95e+00  2.58e+00  1.55e+00  1.40e+00  7.68e+00  8.49e+00   ph/cm2/s
      90%_error_low -1.68e-01 -9.17e-02 -6.57e-02 -1.17e-01 -2.70e-01 -2.79e-01   ph/cm2/s
      90%_error_hi   1.72e-01  9.15e-02  6.55e-02  1.23e-01  2.71e-01  2.80e-01   ph/cm2/s

Fluence        CPL    N/A      N/A      N/A      N/A      N/A      N/A      erg/cm2
      90%_error_low -4.16e-08 -3.30e-08 -4.21e-08 -1.71e-07 -1.02e-07 -1.99e-07   erg/cm2
      90%_error_hi   4.23e-08  3.29e-08  4.20e-08  1.79e-07  1.02e-07  2.04e-07   erg/cm2
Peak flux      CPL   2.55e+00  2.73e+00  1.64e+00  6.98e-01  7.37e+00  7.62e+00   ph/cm2/s
      90%_error_low -2.07e-01 -1.07e-01 -7.55e-02 -1.44e-01 -2.87e-01 -3.33e-01   ph/cm2/s
      90%_error_hi   2.12e-01  1.08e-01  7.62e-02  1.83e-01  2.88e-01  3.47e-01   ph/cm2/s

======================================================================
Image
Pre-slew 15.0-350.0 keV image (Event data)

#   RAcent    DECcent   POSerr    Theta     Phi              Peak Cts       SNR   Name
  150.5326    45.7345   0.0024    29.0366   -10.8583         8.5071341     81.264 TRIG_00293795

Foreground time interval of the image:
-35.740  23.828 (delta_t =  59.568 [sec])
Background time interval of the image:
-239.272 -35.740 (delta_t = 203.532 [sec])
Light Curves
Note: The mask-weighted lightcurves have units of either count/det or counts/sec/det, where a det is 0.4 x 0.4 = 0.16 sq cm.
Full-time range; 1 s binning
Other quick-look light curves:
- 64 ms binning (zoomed)
- 16 ms binning (zoomed)
- 8 ms binning (zoomed)
- 2 ms binning (zoomed)
- SN=5 or 10 s binning (full-time range)
- Raw light curve
Spectra
- 64 ms binning (zoomed)
- 16 ms binning (zoomed)
- 8 ms binning (zoomed)
- 2 ms binning (zoomed)
- SN=5 or 10 s binning (full-time range)
- Raw light curve
Spectra
Notes:
- 1) The fitting includes the systematic errors.
- 2) When the burst includes telescope slew time periods, the fitting uses an average response file made from multiple 5-s response files through out the slew time plus single time preiod for the non-slew times, and weighted by the total counts in the corresponding time period using addrmf. An average response file is needed becuase a spectral fit using the pre-slew DRM will introduce some errors in both a spectral shape and a normalization if the PHA file contains a lot of the slew/post-slew time interval.
- 3) For fits to more complicated models (e.g. a power-law over a cutoff power-law), the BAT team has decided to require a chi-square improvement of more than 6 for each extra dof.
Time averaged spectrum fit using the average DRM
Power-law model
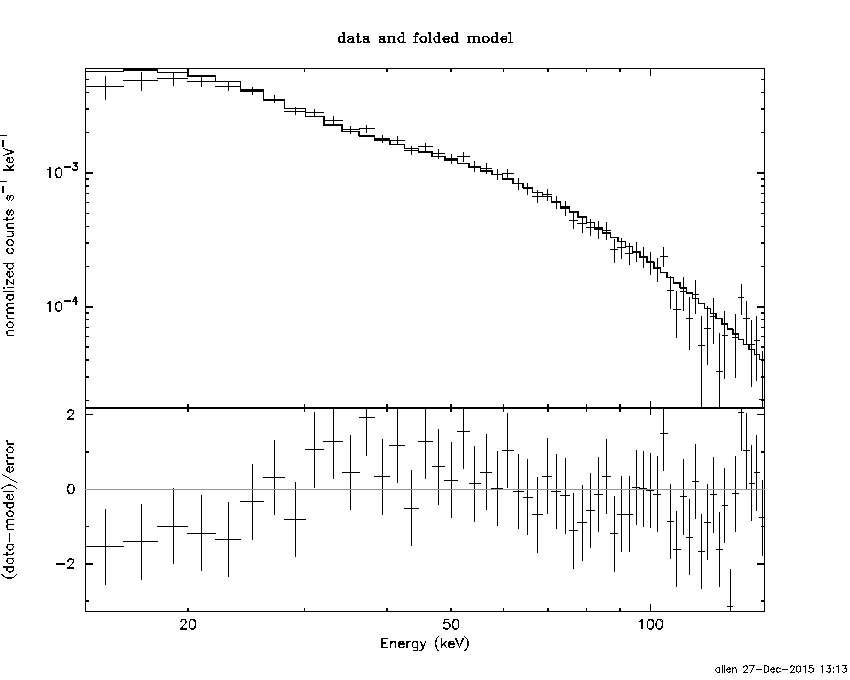
Time interval is from  -35.740 sec. to   23.828 sec.

Spectral model in power-law:
------------------------------------------------------------
Parameters  : value       lower 90%   higher 90%
Photon index: -1.96623     ( -0.0436488   0.04345 )
Norm@50keV  : 8.41959E-03    ( -0.000188963   0.00018875 )
------------------------------------------------------------
#Fit statistic : Chi-Squared =          58.90 using 59 PHA bins.
# Reduced chi-squared =          1.033 for     57 degrees of freedom
# Null hypothesis probability =   4.057364e-01

Photon flux (15-150 keV)    in 59.57 sec: 1.24382 ( -0.03238  0.03255 ) ph/cm2/s
Energy fluence (15-150 keV)             : 4.619e-06 ( -1.02024e-07  1.02149e-07 ) ergs/cm2
Cutoff power-law model

Time interval is from  -35.740 sec. to   23.828 sec.
Spectral model in the cutoff power-law:
------------------------------------------------------------
Parameters  : value       lower 90%   higher 90%
Photon index: -1.52011     ( -0.186976   0.195191 )
Epeak [keV] : 54.7823      ( -5.51245 7.23816 )
Norm@50keV  : 1.38247E-02    ( -0.00254094   0.00328225 )
------------------------------------------------------------
#Fit statistic : Chi-Squared =          41.44 using 59 PHA bins.
# Reduced chi-squared =         0.7400 for     56 degrees of freedom
# Null hypothesis probability =   9.268449e-01

Photon flux (15-150 keV)    in 59.57 sec: 1.19287 ( -0.03763  0.03794 ) ph/cm2/s
Energy fluence (15-150 keV)             : 0 ( 0  0 ) ergs/cm2
1-s peak spectrum fit
Power-law model

Time interval is from    1.396 sec. to    2.396 sec.

Spectral model in power-law:
------------------------------------------------------------
Parameters  : value       lower 90%   higher 90%
Photon index: -1.73527     ( -0.0580533   0.0576373 )
Norm@50keV  : 5.71272E-02    ( -0.00193658   0.00193321 )
------------------------------------------------------------
#Fit statistic : Chi-Squared =          86.28 using 59 PHA bins.
# Reduced chi-squared =          1.514 for     57 degrees of freedom
# Null hypothesis probability =   7.402267e-03

Photon flux (15-150 keV)    in 1 sec: 7.68338 ( -0.27009  0.27063 ) ph/cm2/s
Energy fluence (15-150 keV)             : 5.27679e-07 ( -1.84185e-08  1.8456e-08 ) ergs/cm2
Cutoff power-law model

Time interval is from    1.396 sec. to    2.396 sec.
Spectral model in the cutoff power-law:
------------------------------------------------------------
Parameters  : value       lower 90%   higher 90%
Photon index: -1.00081     ( -0.258953   0.274931 )
Epeak [keV] : 68.5324      ( -6.9841 11.7319 )
Norm@50keV  : 0.132532    ( -0.0333663   0.0481329 )
------------------------------------------------------------
#Fit statistic : Chi-Squared =          60.40 using 59 PHA bins.
# Reduced chi-squared =          1.078 for     56 degrees of freedom
# Null hypothesis probability =   3.200344e-01

Photon flux (15-150 keV)    in 1 sec: 7.37251 ( -0.28712  0.288 ) ph/cm2/s
Energy fluence (15-150 keV)             : 5.03373e-07 ( -2.03476e-08  2.0348e-08 ) ergs/cm2
Time-resolved spectra

Distribution
T90 vs. Hardness ratio plot

T90                                   = 36.124 sec.
Hardness ratio (energy fluence ratio) = 1.02371806562
S(15-50 keV) vs. S(50-150 keV) plot

S(15-50 keV)  = 2.3704025e-06
S(50-150 keV) = 2.248632e-06
The dash-dotted line and the dashed line traces the fluences calculated from the Band function with Epeak = 15 and 150 keV, respectively. Both lines assume a canonical values of alpha = -1 and beta = -2.5.
Mask shadow pattern

IMX = 5.452047759902531E-01, IMY = 1.045785973572260E-01
Spacecraft aspect plot

Bright source in the pre-burst/pre-slew/post-slew images
Pre-burst image of 15-350 keV band
Time interval of the image:
-239.272000 -35.740000

# RAcent  DECcent POSerr Theta    Phi  PeakCts   SNR AngSep     Name
#  [deg]    [deg]    ['] [deg]  [deg]                   [']
254.4131  35.4883  347.2  48.1 -158.1  -0.0095  -0.0    9.0	Her X-1
143.0678  24.3775    2.7  50.9  -16.8   1.2866   4.3 ------	UNKNOWN
253.9330  35.9569    2.4  47.5 -158.0   1.2999   4.7 ------	UNKNOWN
186.1344  24.2859    2.2  42.3  -70.4   3.0985   5.4 ------	UNKNOWN
195.5676  25.7410    3.6  41.0  -83.3   1.9959   3.2 ------	UNKNOWN
Pre-slew background subtracted image of 15-350 keV band
Time interval of the image:
-35.740000 23.828000

# RAcent  DECcent POSerr Theta    Phi  PeakCts   SNR AngSep     Name
#  [deg]    [deg]    ['] [deg]  [deg]                   [']
254.3629  35.4682    9.3  48.1 -158.1  -0.2547  -1.2    8.9	Her X-1
 50.7364  70.5900    2.2  39.9   85.5   2.0522   5.3 ------	UNKNOWN
150.5326  45.7345    0.1  29.0  -10.9   8.5072  81.3 ------	UNKNOWN
Post-slew image of 15-350 keV band
Time interval of the image:
144.028620 610.428620

# RAcent  DECcent POSerr Theta    Phi  PeakCts   SNR AngSep     Name
#  [deg]    [deg]    ['] [deg]  [deg]                   [']
244.9917 -15.6360    0.8  51.0 -140.9  15.8387  13.8    0.8	Sco X-1
254.3734  35.1856    5.9  11.9  131.1   0.4327   1.9   10.3	Her X-1
268.2933  -1.5287    5.1  45.3 -176.6   1.0487   2.2    6.4	SW J1753.5-0127
288.7950  10.9330    2.4  50.5  151.8   5.7313   4.7    0.8	GRS 1915+105
242.6181  81.5093    3.0  46.4   46.2   4.1810   3.8 ------	UNKNOWN
221.5690  15.0704    3.3  25.9  -90.6   1.1675   3.5 ------	UNKNOWN