Analysis Summary
Notes:
- 1) No attempt has been made to eliminate the non-significant decimal places.
- 2) This batgrbproduct analysis is done using the HEASARC data.
- 3) This batgrbproduct analysis is using the flight position for the mask-weighting calculation.
======================================================================
BAT GRB EVENT DATA PROCESSING REPORT
Process Script Ver: batgrbproduct v2.46
Process Start Time: Mon Jan 20 06:31:39 EST 2014
Host Name: batevent1
Current Working Dir: /local/data/batevent/batevent_reproc/trigger293924
======================================================================
Trigger: 00293924 Segment: 000
BAT Trigger Time: 213799216.128 [s; MET]
Trigger Stop: 213799217.152 [s; MET]
UTC: 2007-10-11T12:40:13.844040 [includes UTCF correction]
Where From?: TDRSS position message
BAT
RA: 8.40009894747049 Dec: 61.0725216897883 [deg; J2000]
Catalogged Source?: NO
Point Source?: YES
GRB Indicated?: YES [ by BAT flight software ]
Image S/N Ratio: 7.99
Image Trigger?: NO
Rate S/N Ratio: 16.0934769394311 [ if not an image trigger ]
Image S/N Ratio: 7.99
Analysis Position: [ source = BAT ]
RA: 8.40009894747049 Dec: 61.0725216897883 [deg; J2000]
Refined Position: [ source = BAT pre-slew burst ]
RA: 8.39221826562756 Dec: 61.1333940733554 [deg; J2000]
{ 00h 33m 34.1s , +61d 08' 00.2" }
+/- 1.28916649345966 [arcmin] (estimated 90% radius based on SNR)
+/- 0.54343984342533 [arcmin] (formal 1-sigma fit error)
SNR: 21.1608973752607
Angular difference between the analysis and refined position is 3.659483 arcmin
Partial Coding Fraction: 0.3710938 [ including projection effects ]
Duration
T90: 65.8799999952316 +/- 15.4834462517568
Measured from: -4.22799998521805
to: 61.6520000100136 [s; relative to TRIGTIME]
T50: 42.2759999930859 +/- 2.87055395726043
Measured from: 4.52000001072884
to: 46.7960000038147 [s; relative to TRIGTIME]
Fluence
Peak Flux (peak 1 second)
Measured from: 45.9760000109673
to: 46.9760000109673 [s; relative to TRIGTIME]
Total Fluence
Measured from: -9.47200000286102
to: 77.6520000100136 [s; relative to TRIGTIME]
Band 1 Band 2 Band 3 Band 4
15-25 25-50 50-100 100-350 keV
Total 0.950219 1.159803 1.077543 0.355721
0.076134 0.079967 0.071102 0.062446 [error]
Peak 0.059304 0.059166 0.080057 0.016568
0.008994 0.009944 0.009300 0.007743 [error]
[ fluence units of on-axis counts / fully illuminated detector ]
======================================================================
====== Table of the duration information =============================
Value tstart tstop
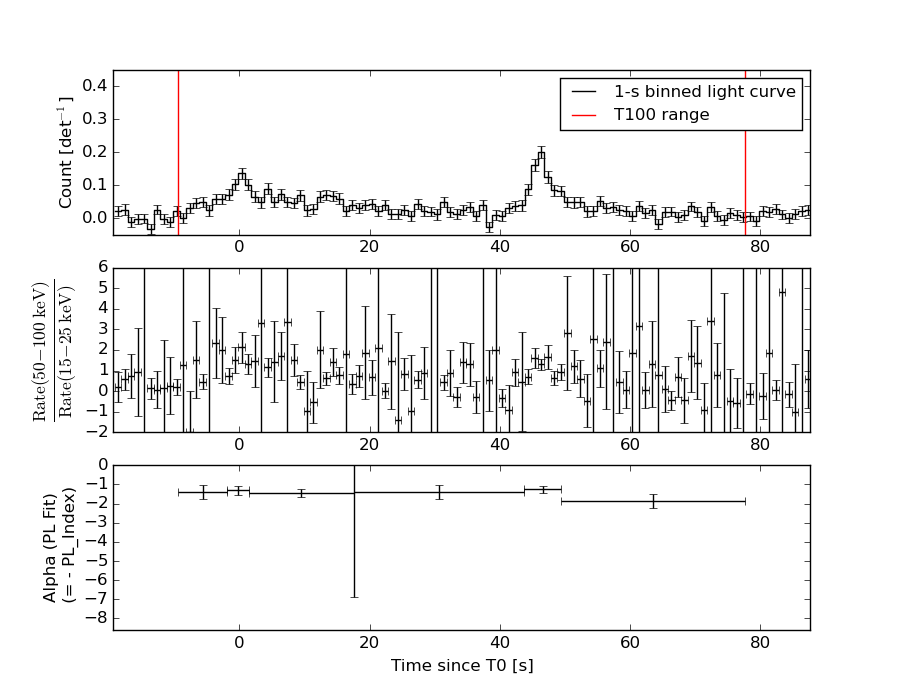
T100 87.124 -9.472 77.652
T90 65.880 -4.228 61.652
T50 42.276 4.520 46.796
Peak 1.000 45.976 46.976
====== Spectral Analysis Summary =====================================
Model : spectral model: simple power-law (PL) and cutoff power-law (CPL)
Ph_index : photon index: E^{Ph_index}
Ph_90err : 90% error of the photon index
Epeak : Epeak in keV
Epeak_90err: 90% error of Epeak
Norm : normalization at 50 keV in both the PL model and CPL model
Nomr_90err : 90% error of the normalization
chi2 : Chi-Squared
dof : degree of freedo
=== Time-averaged spectral analysis ===
(Best model with acceptable fit: N/A)
Model Ph_index Ph_90err_low Ph_90err_hi Epeak Epeak_90err_low Epeak_90err_hi Norm Nomr_90err_low Norm_90err_hi chi2 dof
PL -1.444 -0.125 0.125 - - - 2.83e-03 -1.91e-04 1.90e-04 90.340 57
CPL -1.441 -0.126 0.156 9999.300 -9999.300 -9999.300 2.84e-03 -1.91e-04 8.96e-04 90.360 56
=== 1-s peak spectral analysis ===
(Best model with acceptable fit: PL)
Model Ph_index Ph_90err_low Ph_90err_hi Epeak Epeak_90err_low Epeak_90err_hi Norm Nomr_90err_low Norm_90err_hi chi2 dof
PL -1.288 -0.250 0.250 - - - 1.49e-02 -2.02e-03 2.02e-03 45.270 57
CPL -1.248 -1.501 0.750 995.520 N/A N/A 1.56e-02 N/A N/A 45.320 56
=== Fluence/Peak Flux Summary ===
Model Band1 Band2 Band3 Band4 Band5 Total
15-25 25-50 50-100 100-350 15-150 15-350 keV
Fluence PL 2.98e-07 5.67e-07 8.34e-07 2.63e-06 2.36e-06 4.33e-06 erg/cm2
90%_error_low -3.73e-08 -4.23e-08 -7.21e-08 -4.77e-07 -1.74e-07 -5.28e-07 erg/cm2
90%_error_hi 3.88e-08 4.19e-08 7.16e-08 5.46e-07 1.75e-07 5.84e-07 erg/cm2
Peak flux PL 5.00e-01 5.71e-01 4.67e-01 6.40e-01 1.77e+00 2.18e+00 ph/cm2/s
90%_error_low -1.26e-01 -9.08e-02 -7.75e-02 -2.02e-01 -2.47e-01 -3.07e-01 ph/cm2/s
90%_error_hi 1.37e-01 8.87e-02 7.57e-02 2.53e-01 2.48e-01 3.12e-01 ph/cm2/s
Fluence CPL 3.03e-07 5.63e-07 8.27e-07 2.80e-06 2.37e-06 4.19e-06 erg/cm2
90%_error_low N/A -5.52e-08 -9.34e-08 -1.04e-06 -2.53e-07 -7.80e-07 erg/cm2
90%_error_hi N/A 6.40e-08 1.06e-07 6.14e-08 2.32e-07 6.98e-07 erg/cm2
Peak flux CPL 5.00e-01 5.68e-01 4.66e-01 6.37e-01 1.78e+00 2.21e+00 ph/cm2/s
90%_error_low N/A N/A N/A N/A N/A -5.05e-01 ph/cm2/s
90%_error_hi N/A N/A N/A N/A N/A 2.87e-01 ph/cm2/s
======================================================================
Image
Pre-slew 15.0-350.0 keV image (Event data)
#   RAcent    DECcent   POSerr    Theta     Phi              Peak Cts       SNR   Name
    8.3922    61.1334   0.0091    36.5268   145.7169         3.9627253     21.161 TRIG_00293924

Foreground time interval of the image:
 -9.472  77.652 (delta_t =  87.124 [sec])
Background time interval of the image:
-239.128  -9.472 (delta_t = 229.656 [sec])
Light Curves
Note: The mask-weighted lightcurves have units of either count/det or counts/sec/det, where a det is 0.4 x 0.4 = 0.16 sq cm.
Full-time range; 1 s binning
Other quick-look light curves:
- 64 ms binning (zoomed)
- 16 ms binning (zoomed)
- 8 ms binning (zoomed)
- 2 ms binning (zoomed)
- SN=5 or 10 s binning (full-time range)
- Raw light curve
Spectra
- 64 ms binning (zoomed)
- 16 ms binning (zoomed)
- 8 ms binning (zoomed)
- 2 ms binning (zoomed)
- SN=5 or 10 s binning (full-time range)
- Raw light curve
Spectra
Notes:
- 1) The fitting includes the systematic errors.
- 2) When the burst includes telescope slew time periods, the fitting uses an average response file made from multiple 5-s response files through out the slew time plus single time preiod for the non-slew times, and weighted by the total counts in the corresponding time period using addrmf. An average response file is needed becuase a spectral fit using the pre-slew DRM will introduce some errors in both a spectral shape and a normalization if the PHA file contains a lot of the slew/post-slew time interval.
- 3) For fits to more complicated models (e.g. a power-law over a cutoff power-law), the BAT team has decided to require a chi-square improvement of more than 6 for each extra dof.
Time averaged spectrum fit using the average DRM
Power-law model

Time interval is from   -9.472 sec. to   77.652 sec.

Spectral model in power-law:
------------------------------------------------------------
Parameters  : value       lower 90%   higher 90%
Photon index: -1.44391     ( -0.12546   0.125419 )
Norm@50keV  : 2.82624E-03    ( -0.000190713   0.000190295 )
------------------------------------------------------------
#Fit statistic : Chi-Squared =          90.34 using 59 PHA bins.
# Reduced chi-squared =          1.585 for     57 degrees of freedom
# Null hypothesis probability =   3.238053e-03

Photon flux (15-150 keV)    in 87.12 sec: 0.347780 ( -0.024468  0.024581 ) ph/cm2/s
Energy fluence (15-150 keV)             : 2.35911e-06 ( -1.73821e-07  1.74844e-07 ) ergs/cm2
Cutoff power-law model
Time interval is from   -9.472 sec. to   77.652 sec.
Spectral model in the cutoff power-law:
------------------------------------------------------------
Parameters  : value       lower 90%   higher 90%
Photon index: -1.4414     ( -0.125872   0.156447 )
Epeak [keV] : 9999.30      ( -9999.35 -9999.35 )
Norm@50keV  : 2.83556E-03    ( -0.00019122   0.000896178 )
------------------------------------------------------------
#Fit statistic : Chi-Squared =          90.36 using 59 PHA bins.
# Reduced chi-squared =          1.614 for     56 degrees of freedom
# Null hypothesis probability =   2.466700e-03

Photon flux (15-150 keV)    in 87.12 sec: 0.347741 ( -0.024514  0.024545 ) ph/cm2/s
Energy fluence (15-150 keV)             : 2.37093e-06 ( -2.5282e-07  2.32335e-07 ) ergs/cm2
1-s peak spectrum fit
Power-law model
Time interval is from   45.976 sec. to   46.976 sec.

Spectral model in power-law:
------------------------------------------------------------
Parameters  : value       lower 90%   higher 90%
Photon index: -1.28836     ( -0.249578   0.249623 )
Norm@50keV  : 1.48747E-02    ( -0.00202468   0.00202034 )
------------------------------------------------------------
#Fit statistic : Chi-Squared =          45.27 using 59 PHA bins.
# Reduced chi-squared =         0.7941 for     57 degrees of freedom
# Null hypothesis probability =   8.689326e-01

Photon flux (15-150 keV)    in 1 sec: 1.77085 ( -0.24733  0.24836 ) ph/cm2/s
Energy fluence (15-150 keV)             : 1.47431e-07 ( -2.24281e-08  2.26007e-08 ) ergs/cm2
Cutoff power-law model
Time interval is from   45.976 sec. to   46.976 sec.
Spectral model in the cutoff power-law:
------------------------------------------------------------
Parameters  : value       lower 90%   higher 90%
Photon index: -2.11695     ( -0.632318   1.6192 )
Epeak [keV] : 43.3997      (   )
Norm@50keV  : 4.67231E-03    (     )
------------------------------------------------------------
#Fit statistic : Chi-Squared =          45.14 using 59 PHA bins.
# Reduced chi-squared =         0.8061 for     56 degrees of freedom
# Null hypothesis probability =   8.501488e-01

Photon flux (15-150 keV)    in 1 sec: 1.77770 (    ) ph/cm2/s
Energy fluence (15-150 keV)             : 1.47802e-07 ( -2.41816e-08  1.70598e-08 ) ergs/cm2
Time-resolved spectra
Distribution
T90 vs. Hardness ratio plot
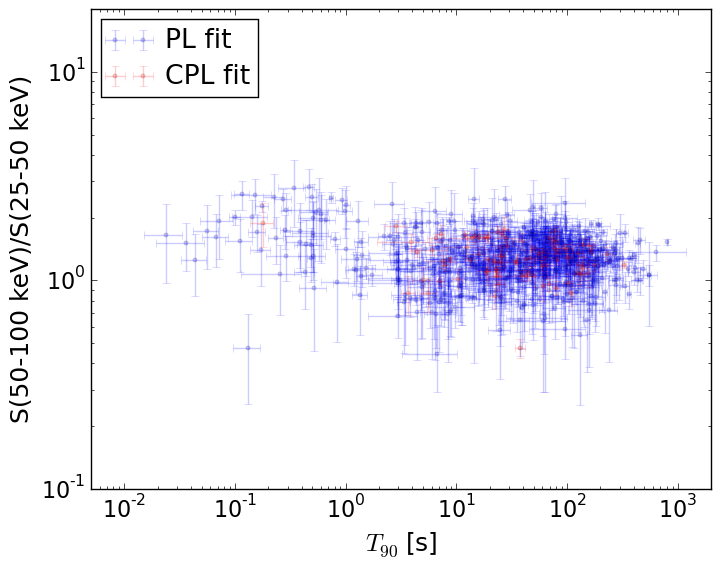
T90                                   = N/A sec.
Hardness ratio (energy fluence ratio) = N/A
S(15-50 keV) vs. S(50-150 keV) plot
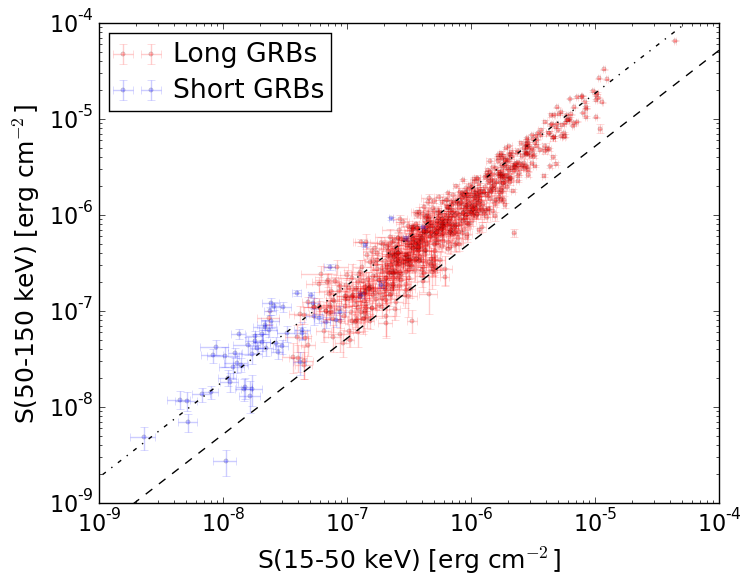
S(15-50 keV)  = N/A
S(50-150 keV) = N/A
The dash-dotted line and the dashed line traces the fluences calculated from the Band function with Epeak = 15 and 150 keV, respectively. Both lines assume a canonical values of alpha = -1 and beta = -2.5.
Mask shadow pattern
IMX = -6.120018621672628E-01, IMY = -4.172149212453142E-01
Spacecraft aspect plot
Bright source in the pre-burst/pre-slew/post-slew images
Pre-burst image of 15-350 keV band
Time interval of the image:
-239.128000 -9.472000

# RAcent  DECcent POSerr Theta    Phi  PeakCts   SNR AngSep     Name
#  [deg]    [deg]    ['] [deg]  [deg]                   [']
 83.6307  22.0118    0.3  37.1   22.2   9.3070  33.4    0.2	Crab
 25.3066  48.3131    2.9  36.2  118.5   1.4957   4.0 ------	UNKNOWN
344.4094  53.5971    3.0  51.1  149.9   3.6281   3.9 ------	UNKNOWN
 88.9460   8.4175    2.3  50.7   14.7   2.7341   4.9 ------	UNKNOWN
335.5182  66.9809    2.4  44.1  166.4   1.5453   4.7 ------	UNKNOWN
137.4544  33.3987    3.9  42.2  -57.5   1.8325   2.9 ------	UNKNOWN
136.2027  25.3954    4.0  48.2  -49.9   2.8591   2.9 ------	UNKNOWN
155.5993  47.6601    2.9  40.9  -87.4   3.6849   4.0 ------	UNKNOWN
Pre-slew background subtracted image of 15-350 keV band
Time interval of the image:
-9.472000 77.652000

# RAcent  DECcent POSerr Theta    Phi  PeakCts   SNR AngSep     Name
#  [deg]    [deg]    ['] [deg]  [deg]                   [']
 83.5124  21.9621  245.2  37.2   22.4  -0.0074  -0.0    7.4	Crab
 72.7798  20.4974    2.1  39.8   38.1   1.2485   5.5 ------	UNKNOWN
  8.3922  61.1334    0.5  36.5  145.7   3.9626  21.1 ------	UNKNOWN
245.7847  71.5138    2.6  48.6 -153.3   1.0132   4.3 ------	UNKNOWN
Post-slew image of 15-350 keV band
Time interval of the image:
415.172600 962.932000

# RAcent  DECcent POSerr Theta    Phi  PeakCts   SNR AngSep     Name
#  [deg]    [deg]    ['] [deg]  [deg]                   [']
254.5747  35.4031   14.3  48.3 -162.8  -0.5094  -0.8    6.8	Her X-1
274.8369  34.6717    3.8  56.9  179.3   5.4308   3.1 ------	UNKNOWN
219.0219  58.6863    2.5  15.7 -153.1   1.2339   4.6 ------	UNKNOWN
152.1214  24.8590    2.5  47.6  -31.4   2.7254   4.6 ------	UNKNOWN
249.5722  26.8507    4.0  53.9 -152.9   2.9602   2.9 ------	UNKNOWN
243.9114  23.1040    4.2  55.2 -145.3   5.8461   2.8 ------	UNKNOWN