Analysis Summary
Notes:
- 1) No attempt has been made to eliminate the non-significant decimal places.
- 2) This batgrbproduct analysis is done using the HEASARC data.
- 3) This batgrbproduct analysis is using the flight position for the mask-weighting calculation.
======================================================================
BAT GRB EVENT DATA PROCESSING REPORT
Process Script Ver: batgrbproduct v2.46
Process Start Time: Mon Jan 20 06:04:21 EST 2014
Host Name: batevent1
Current Working Dir: /local/data/batevent/batevent_reproc/trigger295301
======================================================================
Trigger: 00295301 Segment: 000
BAT Trigger Time: 214978136 [s; MET]
Trigger Stop: 214978200 [s; MET]
UTC: 2007-10-25T04:08:53.685000 [includes UTCF correction]
Where From?: TDRSS position message
BAT
RA: 355.084178674568 Dec: 31.7568181976365 [deg; J2000]
Catalogged Source?: NO
Point Source?: YES
GRB Indicated?: YES [ by BAT flight software ]
Image S/N Ratio: 10.87
Image Trigger?: YES
Rate S/N Ratio: 0 [ if not an image trigger ]
Image S/N Ratio: 10.87
Analysis Position: [ source = BAT ]
RA: 355.084178674568 Dec: 31.7568181976365 [deg; J2000]
Refined Position: [ source = BAT pre-slew burst ]
RA: 355.066752072327 Dec: 31.7831645527375 [deg; J2000]
{ 23h 40m 16.0s , +31d 46' 59.4" }
+/- 1.28732945039301 [arcmin] (estimated 90% radius based on SNR)
+/- 0.50698646168878 [arcmin] (formal 1-sigma fit error)
SNR: 21.2040491259932
Angular difference between the analysis and refined position is 1.813580 arcmin
Partial Coding Fraction: 0.4882812 [ including projection effects ]
Duration
T90: 241.296000003815 +/- 35.8307999214103
Measured from: 56.4920000135899
to: 297.788000017405 [s; relative to TRIGTIME]
T50: 53.6599999964237 +/- 3.86351547609288
Measured from: 82.3000000119209
to: 135.960000008345 [s; relative to TRIGTIME]
Fluence
Peak Flux (peak 1 second)
Measured from: 81.9040000140667
to: 82.9040000140667 [s; relative to TRIGTIME]
Total Fluence
Measured from: 38.5
to: 437.280000001192 [s; relative to TRIGTIME]
Band 1 Band 2 Band 3 Band 4
15-25 25-50 50-100 100-350 keV
Total 3.966958 4.797476 3.100968 0.781263
0.099217 0.103565 0.091217 0.078893 [error]
Peak 0.046425 0.087528 0.060900 0.000578
0.007567 0.008130 0.007084 0.005756 [error]
[ fluence units of on-axis counts / fully illuminated detector ]
======================================================================
====== Table of the duration information =============================
Value tstart tstop
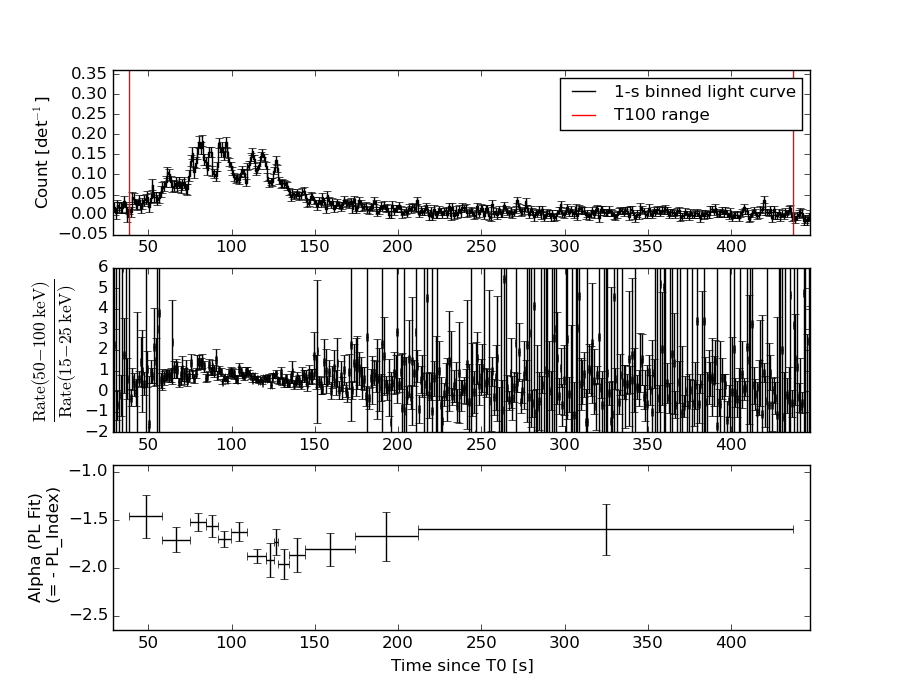
T100 398.780 38.500 437.280
T90 241.296 56.492 297.788
T50 53.660 82.300 135.960
Peak 1.000 81.904 82.904
====== Spectral Analysis Summary =====================================
Model : spectral model: simple power-law (PL) and cutoff power-law (CPL)
Ph_index : photon index: E^{Ph_index}
Ph_90err : 90% error of the photon index
Epeak : Epeak in keV
Epeak_90err: 90% error of Epeak
Norm : normalization at 50 keV in both the PL model and CPL model
Nomr_90err : 90% error of the normalization
chi2 : Chi-Squared
dof : degree of freedo
=== Time-averaged spectral analysis ===
(Best model with acceptable fit: PL)
Model Ph_index Ph_90err_low Ph_90err_hi Epeak Epeak_90err_low Epeak_90err_hi Norm Nomr_90err_low Norm_90err_hi chi2 dof
PL -1.711 -0.057 0.057 - - - 1.98e-03 -5.80e-05 5.79e-05 44.350 57
CPL -1.651 -0.111 0.219 294.964 -294.917 -294.964 2.12e-03 -1.91e-04 5.75e-04 44.120 56
=== 1-s peak spectral analysis ===
(Best model with acceptable fit: PL)
Model Ph_index Ph_90err_low Ph_90err_hi Epeak Epeak_90err_low Epeak_90err_hi Norm Nomr_90err_low Norm_90err_hi chi2 dof
PL -1.503 -0.184 0.182 - - - 1.37e-02 -1.60e-03 1.59e-03 60.540 57
CPL -0.090 -0.930 1.226 62.511 -11.985 35.551 7.80e-02 -7.80e-02 2.78e-01 53.070 56
=== Fluence/Peak Flux Summary ===
Model Band1 Band2 Band3 Band4 Band5 Total
15-25 25-50 50-100 100-350 15-150 15-350 keV
Fluence PL 1.23e-06 1.99e-06 2.43e-06 5.84e-06 7.32e-06 1.15e-05 erg/cm2
90%_error_low -6.69e-08 -6.18e-08 -9.55e-08 -5.02e-07 -2.22e-07 -5.63e-07 erg/cm2
90%_error_hi 6.83e-08 6.16e-08 9.53e-08 5.35e-07 2.23e-07 5.89e-07 erg/cm2
Peak flux PL 5.65e-01 5.67e-01 4.00e-01 4.49e-01 1.71e+00 1.98e+00 ph/cm2/s
90%_error_low -1.01e-01 -6.74e-02 -5.78e-02 -1.16e-01 -1.95e-01 -2.28e-01 ph/cm2/s
90%_error_hi 1.06e-01 6.71e-02 5.76e-02 1.38e-01 1.95e-01 2.30e-01 ph/cm2/s
Fluence CPL 1.22e-06 2.00e-06 2.44e-06 5.32e-06 7.28e-06 1.10e-05 erg/cm2
90%_error_low -8.43e-08 -6.62e-08 -9.84e-08 -1.46e-06 -2.63e-07 -1.49e-06 erg/cm2
90%_error_hi 5.92e-08 6.86e-08 9.93e-08 6.36e-07 2.52e-07 7.24e-07 erg/cm2
Peak flux CPL 4.62e-01 6.56e-01 4.22e-01 1.10e-01 1.63e+00 1.65e+00 ph/cm2/s
90%_error_low -1.19e-01 -9.06e-02 -7.19e-02 -7.05e-02 -2.03e-01 -2.17e-01 ph/cm2/s
90%_error_hi 1.23e-01 9.59e-02 6.94e-02 1.52e-01 2.03e-01 2.35e-01 ph/cm2/s
======================================================================
Image
Pre-slew 15.0-350.0 keV image (Event data)
#   RAcent    DECcent   POSerr    Theta     Phi              Peak Cts       SNR   Name
  355.0668    31.7832   0.0091    30.5627   135.8904         1.8792734     21.204 TRIG_00295301

Foreground time interval of the image:
 38.500  72.301 (delta_t =  33.801 [sec])
Background time interval of the image:
-239.000  38.500 (delta_t = 277.500 [sec])
Light Curves
Note: The mask-weighted lightcurves have units of either count/det or counts/sec/det, where a det is 0.4 x 0.4 = 0.16 sq cm.
Full-time range; 1 s binning
Other quick-look light curves:
- 64 ms binning (zoomed)
- 16 ms binning (zoomed)
- 8 ms binning (zoomed)
- 2 ms binning (zoomed)
- SN=5 or 10 s binning (full-time range)
- Raw light curve
Spectra
- 64 ms binning (zoomed)
- 16 ms binning (zoomed)
- 8 ms binning (zoomed)
- 2 ms binning (zoomed)
- SN=5 or 10 s binning (full-time range)
- Raw light curve
Spectra
Notes:
- 1) The fitting includes the systematic errors.
- 2) When the burst includes telescope slew time periods, the fitting uses an average response file made from multiple 5-s response files through out the slew time plus single time preiod for the non-slew times, and weighted by the total counts in the corresponding time period using addrmf. An average response file is needed becuase a spectral fit using the pre-slew DRM will introduce some errors in both a spectral shape and a normalization if the PHA file contains a lot of the slew/post-slew time interval.
- 3) For fits to more complicated models (e.g. a power-law over a cutoff power-law), the BAT team has decided to require a chi-square improvement of more than 6 for each extra dof.
Time averaged spectrum fit using the average DRM
Power-law model
Time interval is from   38.500 sec. to  437.280 sec.

Spectral model in power-law:
------------------------------------------------------------
Parameters  : value       lower 90%   higher 90%
Photon index: -1.71097     ( -0.0570967   0.0568698 )
Norm@50keV  : 1.98265E-03    ( -5.80021e-05   5.78583e-05 )
------------------------------------------------------------
#Fit statistic : Chi-Squared =          44.35 using 59 PHA bins.
# Reduced chi-squared =         0.7782 for     57 degrees of freedom
# Null hypothesis probability =   8.890733e-01

Photon flux (15-150 keV)    in 398.8 sec: 0.264347 ( -0.008299  0.008343 ) ph/cm2/s
Energy fluence (15-150 keV)             : 7.31571e-06 ( -2.22459e-07  2.2297e-07 ) ergs/cm2
Cutoff power-law model

Time interval is from   38.500 sec. to  437.280 sec.
Spectral model in the cutoff power-law:
------------------------------------------------------------
Parameters  : value       lower 90%   higher 90%
Photon index: -1.6507     ( -0.111391   0.219431 )
Epeak [keV] : 294.964      ( -294.925 -294.971 )
Norm@50keV  : 2.12157E-03    ( -0.000190911   0.00057471 )
------------------------------------------------------------
#Fit statistic : Chi-Squared =          44.12 using 59 PHA bins.
# Reduced chi-squared =         0.7878 for     56 degrees of freedom
# Null hypothesis probability =   8.747839e-01

Photon flux (15-150 keV)    in 398.8 sec: 0.263056 ( -0.009379  0.009235 ) ph/cm2/s
Energy fluence (15-150 keV)             : 7.27539e-06 ( -2.6269e-07  2.52014e-07 ) ergs/cm2
1-s peak spectrum fit
Power-law model
Time interval is from   81.904 sec. to   82.904 sec.

Spectral model in power-law:
------------------------------------------------------------
Parameters  : value       lower 90%   higher 90%
Photon index: -1.50295     ( -0.184327   0.18239 )
Norm@50keV  : 1.36798E-02    ( -0.00160256   0.00159374 )
------------------------------------------------------------
#Fit statistic : Chi-Squared =          60.54 using 59 PHA bins.
# Reduced chi-squared =          1.062 for     57 degrees of freedom
# Null hypothesis probability =   3.491751e-01

Photon flux (15-150 keV)    in 1 sec: 1.70917 ( -0.19527  0.19549 ) ph/cm2/s
Energy fluence (15-150 keV)             : 1.2973e-07 ( -1.64587e-08  1.66494e-08 ) ergs/cm2
Cutoff power-law model

Time interval is from   81.904 sec. to   82.904 sec.
Spectral model in the cutoff power-law:
------------------------------------------------------------
Parameters  : value       lower 90%   higher 90%
Photon index: -0.089986     ( -0.9332   1.22353 )
Epeak [keV] : 62.5110      ( -11.9257 35.6109 )
Norm@50keV  : 7.79769E-02    ( -0.0783739   0.277128 )
------------------------------------------------------------
#Fit statistic : Chi-Squared =          53.07 using 59 PHA bins.
# Reduced chi-squared =         0.9477 for     56 degrees of freedom
# Null hypothesis probability =   5.864867e-01

Photon flux (15-150 keV)    in 1 sec: 1.62690 ( -0.20321  0.20322 ) ph/cm2/s
Energy fluence (15-150 keV)             : 1.15136e-07 ( -1.81319e-08  1.90509e-08 ) ergs/cm2
Time-resolved spectra
Distribution
T90 vs. Hardness ratio plot
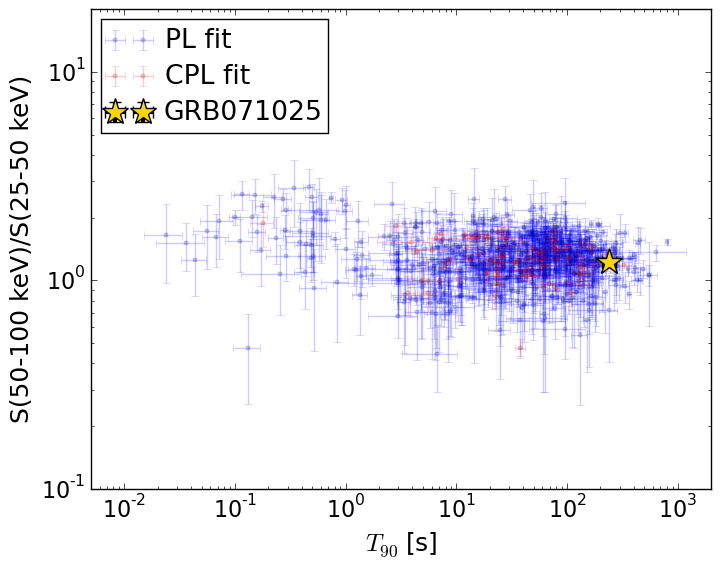
T90                                   = 241.296 sec.
Hardness ratio (energy fluence ratio) = 1.22185598913
S(15-50 keV) vs. S(50-150 keV) plot
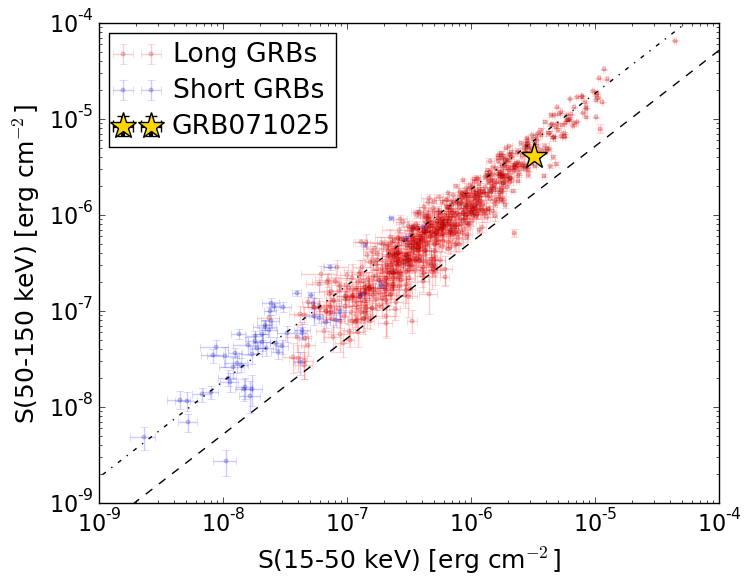
S(15-50 keV)  = 3.220427e-06
S(50-150 keV) = 4.095285e-06
The dash-dotted line and the dashed line traces the fluences calculated from the Band function with Epeak = 15 and 150 keV, respectively. Both lines assume a canonical values of alpha = -1 and beta = -2.5.
Mask shadow pattern
IMX = -4.239995634639267E-01, IMY = -4.110225134930077E-01
Spacecraft aspect plot
Bright source in the pre-burst/pre-slew/post-slew images
Pre-burst image of 15-350 keV band
Time interval of the image:
-239.000000 38.500000

# RAcent  DECcent POSerr Theta    Phi  PeakCts   SNR AngSep     Name
#  [deg]    [deg]    ['] [deg]  [deg]                   [']
299.5986  35.1991    0.5  49.7 -155.3   9.7210  21.0    0.4	Cyg X-1
308.1451  41.0382    3.6  40.9 -157.7   0.8990   3.2    5.4	Cyg X-3
326.1334  38.2899    3.5  34.6 -178.4   0.7600   3.3    2.6	Cyg X-2
 54.7701  28.1665    3.0  45.0   48.7   2.7931   3.8 ------	UNKNOWN
258.0842  68.7362    4.7  41.0  -98.0   2.6659   2.5 ------	UNKNOWN
Pre-slew background subtracted image of 15-350 keV band
Time interval of the image:
38.500000 72.300590

# RAcent  DECcent POSerr Theta    Phi  PeakCts   SNR AngSep     Name
#  [deg]    [deg]    ['] [deg]  [deg]                   [']
299.7253  35.3131    0.0  49.5 -155.3   0.0379   0.3    9.4	Cyg X-1
308.2495  40.8715    5.7  41.0 -157.9  -0.1737  -2.0    8.0	Cyg X-3
326.3167  38.2700    8.9  34.5 -178.6   0.0946   1.3    7.5	Cyg X-2
355.0667  31.7832    0.5  30.6  135.9   1.8794  21.2 ------	UNKNOWN
335.5381  27.6748    2.3  40.0  161.6   0.4897   5.0 ------	UNKNOWN
324.9943  40.7668    2.6  33.1 -174.5   0.2941   4.4 ------	UNKNOWN
305.7032  42.8479    2.2  40.7 -153.8   0.4330   5.4 ------	UNKNOWN
Post-slew image of 15-350 keV band
Time interval of the image:
134.700600 397.600600

# RAcent  DECcent POSerr Theta    Phi  PeakCts   SNR AngSep     Name
#  [deg]    [deg]    ['] [deg]  [deg]                   [']
307.9703  40.9158    8.3  38.5  -87.0   1.0571   1.4    6.7	Cyg X-3
326.1538  38.2533    4.1  24.4  -90.9   0.6511   2.8    4.2	Cyg X-2
355.0682  31.7881    0.6   0.0  -55.7   3.1956  19.1 ------	UNKNOWN