Analysis Summary
Notes:
- 1) No attempt has been made to eliminate the non-significant decimal places.
- 2) This batgrbproduct analysis is done using the HEASARC data.
- 3) This batgrbproduct analysis is using the flight position for the mask-weighting calculation.
======================================================================
BAT GRB EVENT DATA PROCESSING REPORT
Process Script Ver: batgrbproduct v2.46
Process Start Time: Thu Sep 11 13:40:03 EDT 2014
Host Name: batevent1
Current Working Dir: /local/data/batevent/batevent_reproc/trigger295527
======================================================================
Trigger: 00295527 Segment: 000
BAT Trigger Time: 215286064 [s; MET]
Trigger Stop: 215286128 [s; MET]
UTC: 2007-10-28T17:41:01.676940 [includes UTCF correction]
Where From?: TDRSS position message
BAT
RA: 119.846989722008 Dec: 21.4977976788415 [deg; J2000]
Catalogged Source?: NO
Point Source?: YES
GRB Indicated?: YES [ by BAT flight software ]
Image S/N Ratio: 8.74
Image Trigger?: YES
Rate S/N Ratio: 0 [ if not an image trigger ]
Image S/N Ratio: 8.74
Analysis Position: [ source = BAT ]
RA: 119.846989722008 Dec: 21.4977976788415 [deg; J2000]
Refined Position: [ source = BAT pre-slew burst ]
RA: 119.826257143885 Dec: 21.4700100994003 [deg; J2000]
{ 07h 59m 18.3s , +21d 28' 12.0" }
+/- 2.12272880669816 [arcmin] (estimated 90% radius based on SNR)
+/- 0.826427987752839 [arcmin] (formal 1-sigma fit error)
SNR: 10.3782999346458
Angular difference between the analysis and refined position is 2.029681 arcmin
Partial Coding Fraction: 1.015625 [ including projection effects ]
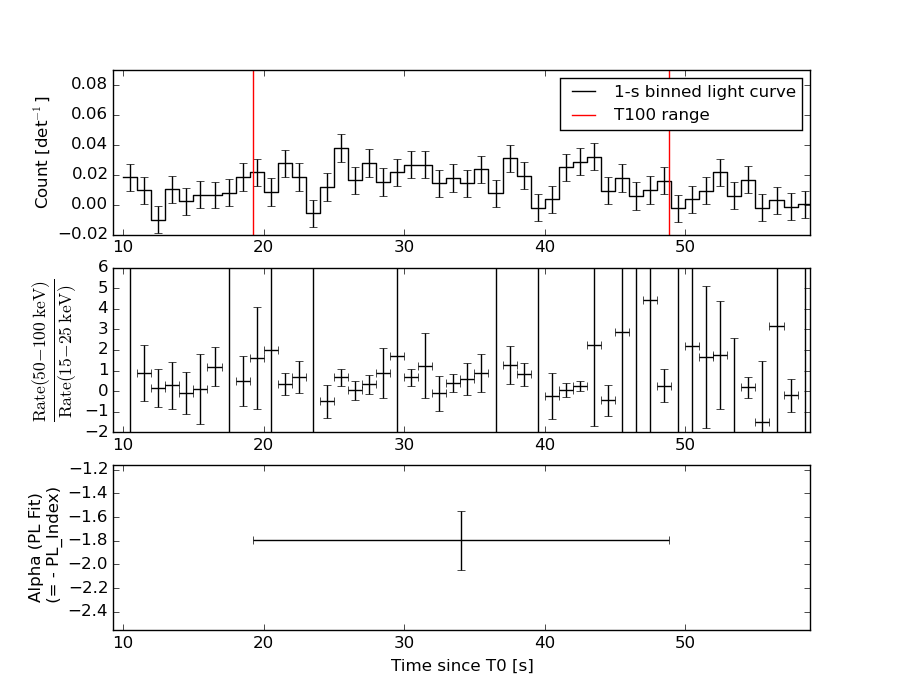
Duration
T90: 26.8560000061989 +/- 5.42508909639097
Measured from: 20.16400000453
to: 47.0200000107288 [s; relative to TRIGTIME]
T50: 15.2919999957085 +/- 5.75422487826452
Measured from: 26.5160000026226
to: 41.8079999983311 [s; relative to TRIGTIME]
Fluence
Peak Flux (peak 1 second)
Measured from: 41.7520000040531
to: 42.7520000040531 [s; relative to TRIGTIME]
Total Fluence
Measured from: 19.2400000095367
to: 48.8840000033379 [s; relative to TRIGTIME]
Band 1 Band 2 Band 3 Band 4
15-25 25-50 50-100 100-350 keV
Total 0.191844 0.233980 0.108260 0.005315
0.025693 0.026927 0.024069 0.022249 [error]
Peak 0.019752 0.013557 0.004231 0.005377
0.004640 0.004814 0.004343 0.004063 [error]
[ fluence units of on-axis counts / fully illuminated detector ]
======================================================================
====== Table of the duration information =============================
Value tstart tstop
T100 29.644 19.240 48.884
T90 26.856 20.164 47.020
T50 15.292 26.516 41.808
Peak 1.000 41.752 42.752
====== Spectral Analysis Summary =====================================
Model : spectral model: simple power-law (PL) and cutoff power-law (CPL)
Ph_index : photon index: E^{Ph_index}
Ph_90err : 90% error of the photon index
Epeak : Epeak in keV
Epeak_90err: 90% error of Epeak
Norm : normalization at 50 keV in both the PL model and CPL model
Nomr_90err : 90% error of the normalization
chi2 : Chi-Squared
dof : degree of freedo
=== Time-averaged spectral analysis ===
(Best model with acceptable fit: PL)
Model Ph_index Ph_90err_low Ph_90err_hi Epeak Epeak_90err_low Epeak_90err_hi Norm Nomr_90err_low Norm_90err_hi chi2 dof
PL -1.789 -0.254 0.240 - - - 1.10e-03 -1.86e-04 1.81e-04 47.640 57
CPL -0.736 -1.121 1.570 49.029 -12.302 -49.029 4.55e-03 -4.55e-03 3.44e-02 45.150 56
=== 1-s peak spectral analysis ===
(Best model with acceptable fit: N/A)
Model Ph_index Ph_90err_low Ph_90err_hi Epeak Epeak_90err_low Epeak_90err_hi Norm Nomr_90err_low Norm_90err_hi chi2 dof
PL -2.261 -1.040 0.742 - - - 1.68e-03 -1.05e-03 1.04e-03 61.350 57
CPL -1.985 -0.021 2.575 2.140 N/A N/A 2.46e-03 N/A N/A 61.440 56
=== Fluence/Peak Flux Summary ===
Model Band1 Band2 Band3 Band4 Band5 Total
15-25 25-50 50-100 100-350 15-150 15-350 keV
Fluence PL 5.46e-08 8.42e-08 9.74e-08 2.17e-07 3.00e-07 4.53e-07 erg/cm2
90%_error_low -1.04e-08 -1.16e-08 -2.18e-08 -8.29e-08 -5.09e-08 -1.09e-07 erg/cm2
90%_error_hi 1.06e-08 1.16e-08 2.24e-08 1.12e-07 5.25e-08 1.33e-07 erg/cm2
Peak flux PL 1.45e-01 9.33e-02 3.89e-02 2.21e-02 2.88e-01 2.99e-01 ph/cm2/s
90%_error_low -6.34e-02 -4.19e-02 -2.79e-02 -2.21e-02 -1.07e-01 -1.14e-01 ph/cm2/s
90%_error_hi 6.43e-02 3.78e-02 3.54e-02 5.40e-02 1.07e-01 1.19e-01 ph/cm2/s
Fluence CPL 5.05e-08 9.55e-08 9.09e-08 4.13e-08 2.66e-07 2.78e-07 erg/cm2
90%_error_low -1.20e-08 -1.67e-08 -2.96e-08 N/A -5.44e-08 -6.57e-08 erg/cm2
90%_error_hi 1.18e-08 1.77e-08 2.66e-08 N/A 6.28e-08 2.09e-07 erg/cm2
Peak flux CPL 1.42e-01 8.50e-02 3.38e-02 2.13e-02 2.71e-01 2.94e-01 ph/cm2/s
90%_error_low -7.28e-02 -8.50e-02 -3.38e-02 N/A N/A N/A ph/cm2/s
90%_error_hi 6.62e-02 5.79e-02 3.28e-02 N/A N/A N/A ph/cm2/s
======================================================================
Image
Pre-slew 15.0-350.0 keV image (Event data)
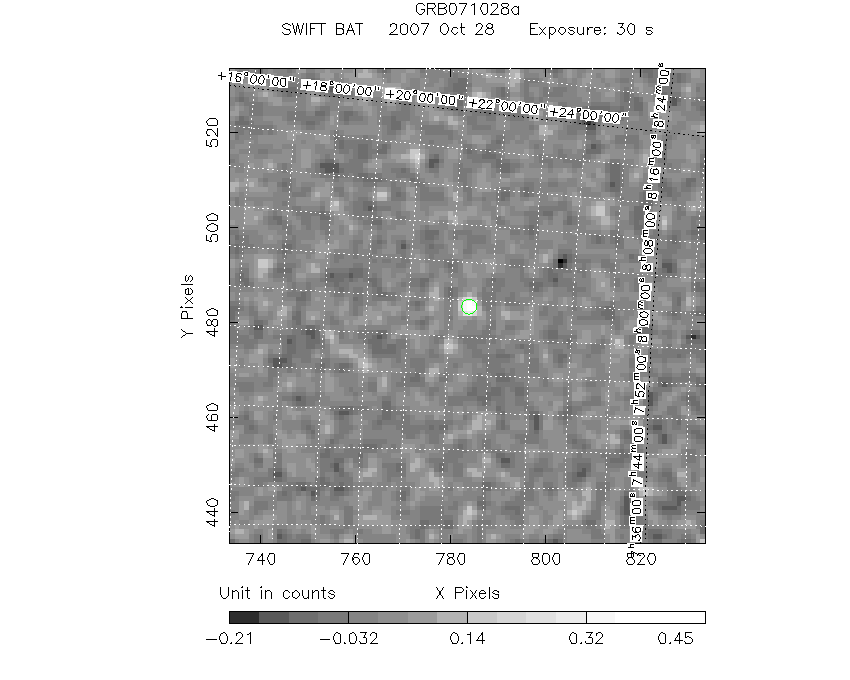
#   RAcent    DECcent   POSerr    Theta     Phi              Peak Cts       SNR   Name
  119.8263    21.4700   0.0185    11.4015    -4.0243         0.5115543     10.378 TRIG_00295527

Foreground time interval of the image:
 19.240  48.884 (delta_t =  29.644 [sec])
Background time interval of the image:
-239.000  19.240 (delta_t = 258.240 [sec])
Light Curves
Note: The mask-weighted lightcurves have units of either count/det or counts/sec/det, where a det is 0.4 x 0.4 = 0.16 sq cm.
Full-time range; 1 s binning
Other quick-look light curves:
- 64 ms binning (zoomed)
- 16 ms binning (zoomed)
- 8 ms binning (zoomed)
- 2 ms binning (zoomed)
- SN=5 or 10 s binning (full-time range)
- Raw light curve
Spectra
- 64 ms binning (zoomed)
- 16 ms binning (zoomed)
- 8 ms binning (zoomed)
- 2 ms binning (zoomed)
- SN=5 or 10 s binning (full-time range)
- Raw light curve
Spectra
Notes:
- 1) The fitting includes the systematic errors.
- 2) When the burst includes telescope slew time periods, the fitting uses an average response file made from multiple 5-s response files through out the slew time plus single time preiod for the non-slew times, and weighted by the total counts in the corresponding time period using addrmf. An average response file is needed becuase a spectral fit using the pre-slew DRM will introduce some errors in both a spectral shape and a normalization if the PHA file contains a lot of the slew/post-slew time interval.
- 3) For fits to more complicated models (e.g. a power-law over a cutoff power-law), the BAT team has decided to require a chi-square improvement of more than 6 for each extra dof.
Time averaged spectrum fit using the average DRM
Power-law model
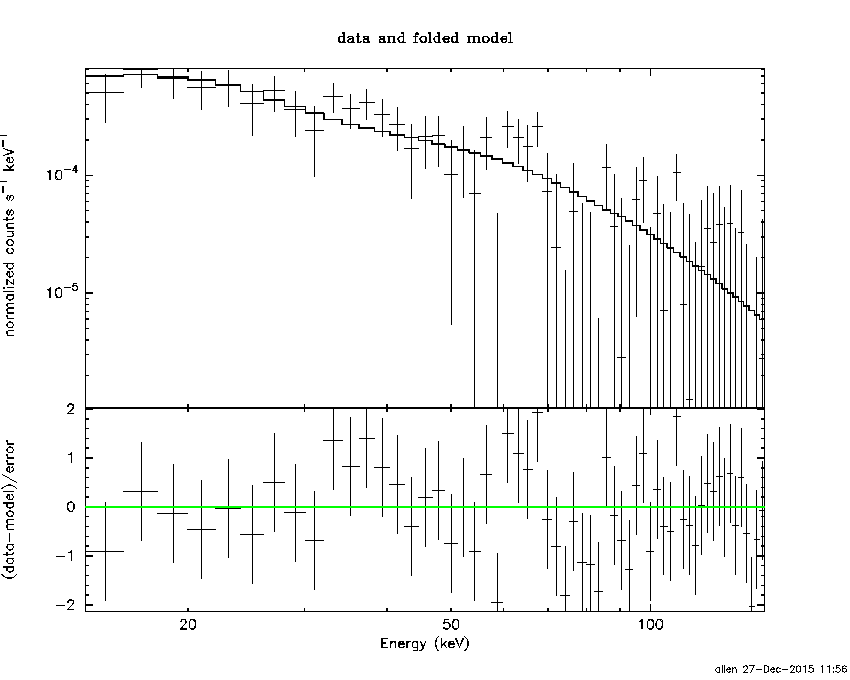
Time interval is from   19.240 sec. to   48.884 sec.

Spectral model in power-law:
------------------------------------------------------------
Parameters  : value       lower 90%   higher 90%
Photon index: -1.78946     ( -0.253905   0.239844 )
Norm@50keV  : 1.09940E-03    ( -0.000185687   0.000181161 )
------------------------------------------------------------
#Fit statistic : Chi-Squared =          47.64 using 59 PHA bins.
# Reduced chi-squared =         0.8359 for     57 degrees of freedom
# Null hypothesis probability =   8.067659e-01

Photon flux (15-150 keV)    in 29.64 sec: 0.150888 ( -0.020647  0.020647 ) ph/cm2/s
Energy fluence (15-150 keV)             : 3.00155e-07 ( -5.08519e-08  5.25064e-08 ) ergs/cm2
Cutoff power-law model
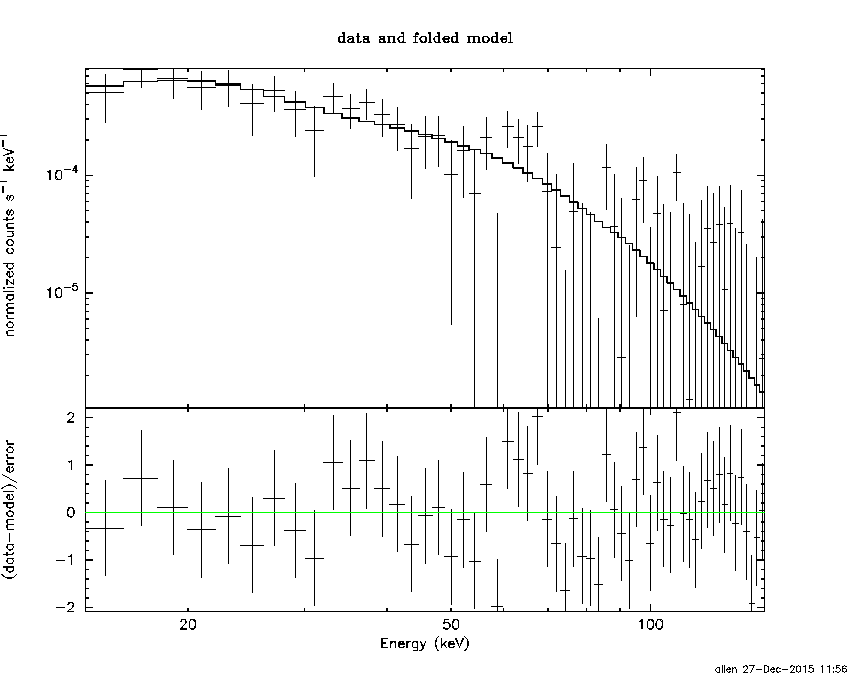
Time interval is from   19.240 sec. to   48.884 sec.
Spectral model in the cutoff power-law:
------------------------------------------------------------
Parameters  : value       lower 90%   higher 90%
Photon index: -0.73572     ( -1.12083   1.56976 )
Epeak [keV] : 49.0291      ( -12.3014 -49.0288 )
Norm@50keV  : 4.54881E-03    ( -0.00454899   0.0343787 )
------------------------------------------------------------
#Fit statistic : Chi-Squared =          45.15 using 59 PHA bins.
# Reduced chi-squared =         0.8062 for     56 degrees of freedom
# Null hypothesis probability =   8.500175e-01

Photon flux (15-150 keV)    in 29.64 sec: 0.145235 ( -0.02137  0.021479 ) ph/cm2/s
Energy fluence (15-150 keV)             : 2.65937e-07 ( -5.44084e-08  6.27624e-08 ) ergs/cm2
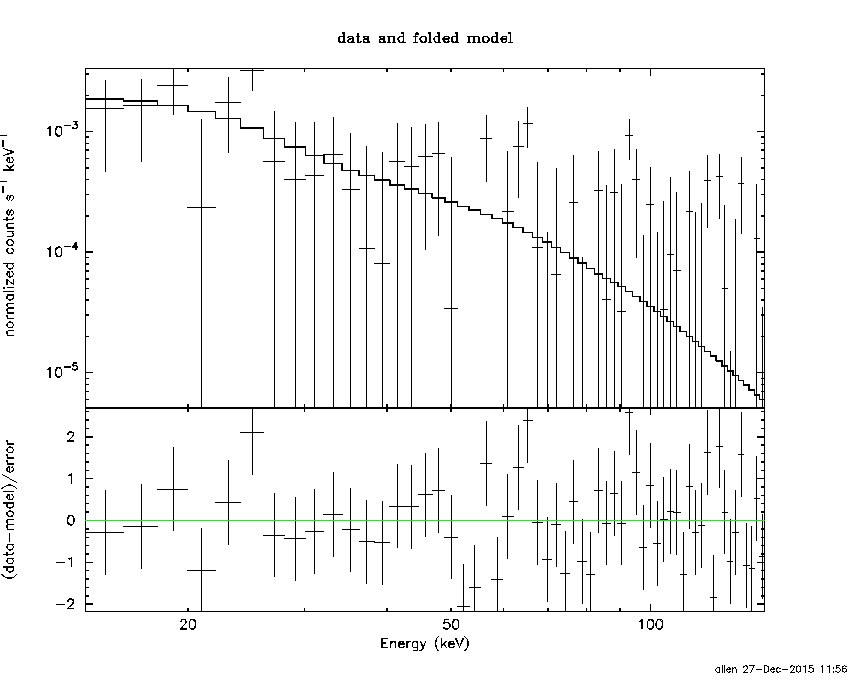
1-s peak spectrum fit
Power-law model

Time interval is from   41.752 sec. to   42.752 sec.

Spectral model in power-law:
------------------------------------------------------------
Parameters  : value       lower 90%   higher 90%
Photon index: -2.26065     ( -1.0399   0.741752 )
Norm@50keV  : 1.68410E-03    ( -0.00105366   0.00104396 )
------------------------------------------------------------
#Fit statistic : Chi-Squared =          61.35 using 59 PHA bins.
# Reduced chi-squared =          1.076 for     57 degrees of freedom
# Null hypothesis probability =   3.227601e-01

Photon flux (15-150 keV)    in 1 sec: 0.288036 ( -0.106652  0.107219 ) ph/cm2/s
Energy fluence (15-150 keV)             : 1.5986e-08 ( -7.73227e-09  9.16064e-09 ) ergs/cm2
Cutoff power-law model
Time interval is from   41.752 sec. to   42.752 sec.
Spectral model in the cutoff power-law:
------------------------------------------------------------
Parameters  : value       lower 90%   higher 90%
Photon index: -2.31892     ( -0.0212082   2.57545 )
Epeak [keV] : 188.300      (   )
Norm@50keV  : 1.54454E-03    (     )
------------------------------------------------------------
#Fit statistic : Chi-Squared =          61.34 using 59 PHA bins.
# Reduced chi-squared =          1.095 for     56 degrees of freedom
# Null hypothesis probability =   2.904514e-01

Photon flux (15-150 keV)    in 1 sec: 0.270916 (    ) ph/cm2/s
Energy fluence (15-150 keV)             : 1.55654e-08 ( 0  0 ) ergs/cm2
Time-resolved spectra
Distribution
T90 vs. Hardness ratio plot
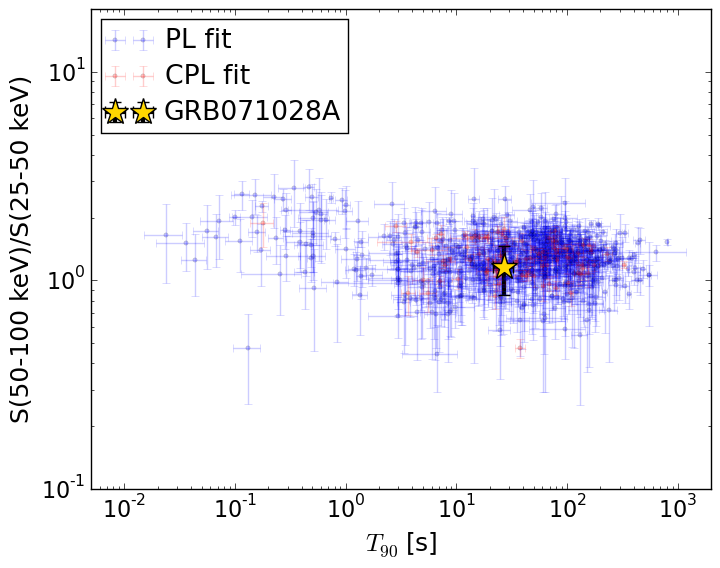
T90                                   = 26.856 sec.
Hardness ratio (energy fluence ratio) = 1.15715057683
S(15-50 keV) vs. S(50-150 keV) plot
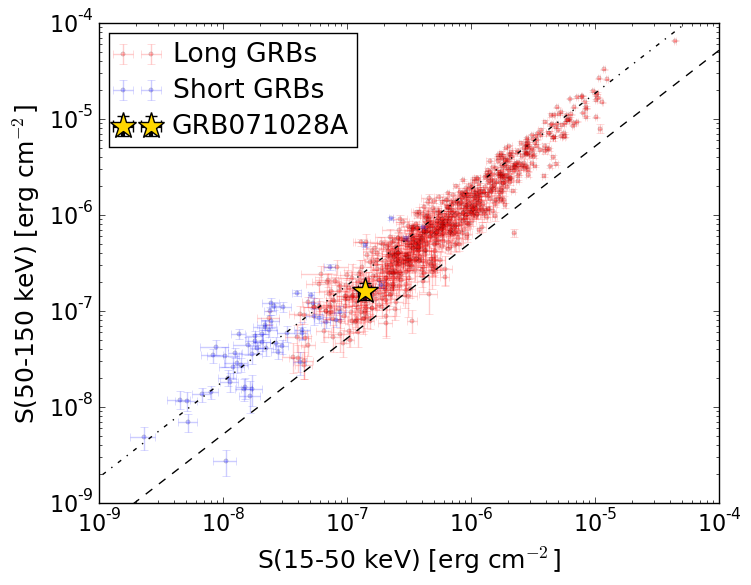
S(15-50 keV)  = 1.3881773e-07
S(50-150 keV) = 1.6134155e-07
The dash-dotted line and the dashed line traces the fluences calculated from the Band function with Epeak = 15 and 150 keV, respectively. Both lines assume a canonical values of alpha = -1 and beta = -2.5.
Mask shadow pattern
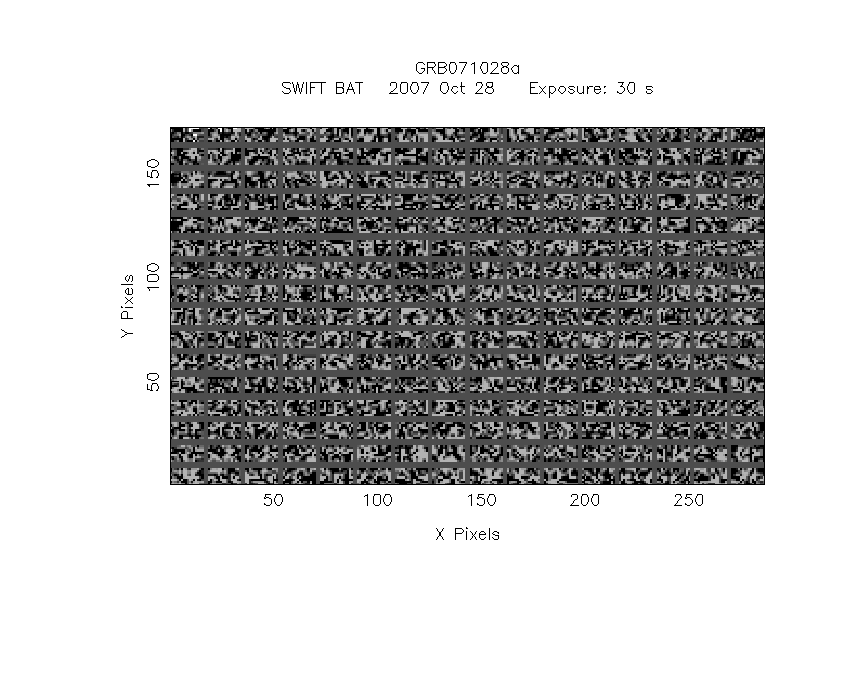
IMX = 2.011658195984532E-01, IMY = 1.415253510473943E-02
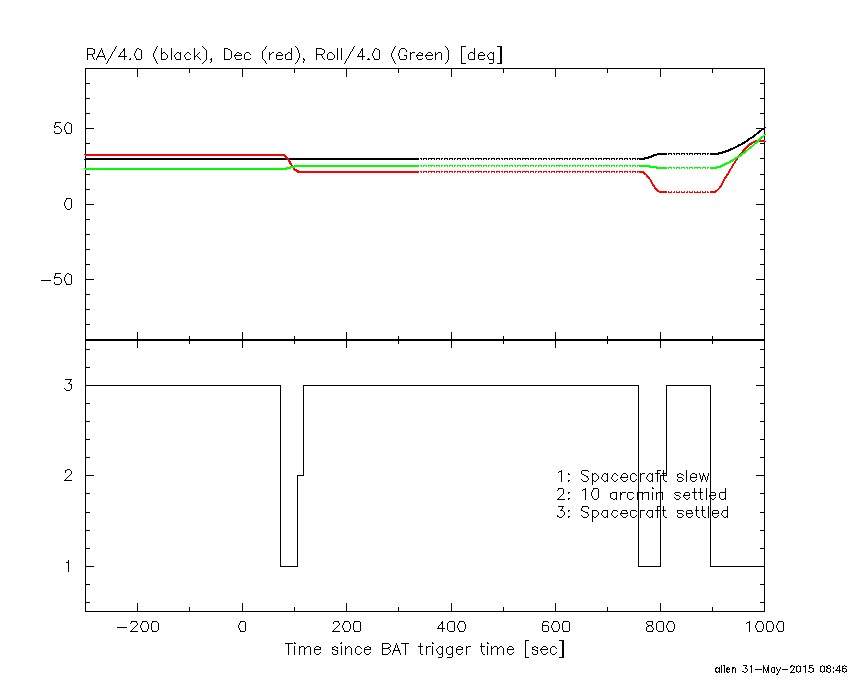
Spacecraft aspect plot
Bright source in the pre-burst/pre-slew/post-slew images
Pre-burst image of 15-350 keV band
Time interval of the image:
-239.000000 19.240000

# RAcent  DECcent POSerr Theta    Phi  PeakCts   SNR AngSep     Name
#  [deg]    [deg]    ['] [deg]  [deg]                   [']
 83.6301  22.0265    0.4  33.6   77.2  10.7364  26.4    0.7	Crab
 81.5688  12.8516    2.5  40.1   65.9   3.3711   4.6 ------	UNKNOWN
 70.1038  49.8266    2.8  40.0  126.9   2.3308   4.1 ------	UNKNOWN
 65.0647  66.3380    2.7  46.2  149.8   2.2964   4.3 ------	UNKNOWN
160.7959  15.0240    4.1  41.3  -77.7   2.4088   2.8 ------	UNKNOWN
Pre-slew background subtracted image of 15-350 keV band
Time interval of the image:
19.240000 48.884000

# RAcent  DECcent POSerr Theta    Phi  PeakCts   SNR AngSep     Name
#  [deg]    [deg]    ['] [deg]  [deg]                   [']
 83.7536  22.1660    0.0  33.4   77.3  -0.1459  -1.2   11.3	Crab
119.8263  21.4700    1.1  11.4   -4.0   0.5115  10.4 ------	UNKNOWN
186.8089  77.5720    2.0  53.1 -168.9   0.8462   5.8 ------	UNKNOWN
150.8875  33.1480    2.6  26.1 -102.5   0.3158   4.5 ------	UNKNOWN
Post-slew image of 15-350 keV band
Time interval of the image:
106.900600 758.600590

# RAcent  DECcent POSerr Theta    Phi  PeakCts   SNR AngSep     Name
#  [deg]    [deg]    ['] [deg]  [deg]                   [']
 83.6328  22.0129    0.4  33.6   86.7  22.9678  27.3    0.1	Crab
 90.3696  63.9695    3.2  46.8  151.7   4.2878   3.6 ------	UNKNOWN
172.4131  71.9216    3.5  58.4 -174.3   6.9140   3.4 ------	UNKNOWN
172.9109  71.6556    3.3  58.4 -173.9   8.8754   4.2 ------	UNKNOWN
181.2965  47.7526    6.8  55.2 -145.1   4.8551   1.7 ------	UNKNOWN