Analysis Summary
Notes:
- 1) No attempt has been made to eliminate the non-significant decimal places.
- 2) This batgrbproduct analysis is done using the HEASARC data.
- 3) This batgrbproduct analysis is using the flight position for the mask-weighting calculation.
======================================================================
BAT GRB EVENT DATA PROCESSING REPORT
Process Script Ver: batgrbproduct v2.46
Process Start Time: Mon Jan 20 05:55:21 EST 2014
Host Name: batevent1
Current Working Dir: /local/data/batevent/batevent_reproc/trigger295670
======================================================================
Trigger: 00295670 Segment: 000
BAT Trigger Time: 215485599.296 [s; MET]
Trigger Stop: 215485603.392 [s; MET]
UTC: 2007-10-31T01:06:36.967720 [includes UTCF correction]
Where From?: TDRSS position message
BAT
RA: 6.45831176275914 Dec: -58.0454373126827 [deg; J2000]
Catalogged Source?: NO
Point Source?: YES
GRB Indicated?: YES [ by BAT flight software ]
Image S/N Ratio: 9.48
Image Trigger?: NO
Rate S/N Ratio: 8.71779788708135 [ if not an image trigger ]
Image S/N Ratio: 9.48
Analysis Position: [ source = BAT ]
RA: 6.45831176275914 Dec: -58.0454373126827 [deg; J2000]
Refined Position: [ source = BAT pre-slew burst ]
RA: 6.39556426309878 Dec: -58.0521229914089 [deg; J2000]
{ 00h 25m 34.9s , -58d 03' 07.6" }
+/- 1.84002580802787 [arcmin] (estimated 90% radius based on SNR)
+/- 0.900274171380138 [arcmin] (formal 1-sigma fit error)
SNR: 12.7291235625573
Angular difference between the analysis and refined position is 2.032329 arcmin
Partial Coding Fraction: 0.75 [ including projection effects ]
Duration
T90: 180.643999993801 +/- 30.3420000084132
Measured from: -1.12799999117851
to: 179.516000002623 [s; relative to TRIGTIME]
T50: 114.236000001431 +/- 13.8757532464854
Measured from: 7.24799999594688
to: 121.483999997377 [s; relative to TRIGTIME]
Fluence
Peak Flux (peak 1 second)
Measured from: 2.55599999427795
to: 3.55599999427795 [s; relative to TRIGTIME]
Total Fluence
Measured from: -4.53200000524521
to: 192.479999989271 [s; relative to TRIGTIME]
Band 1 Band 2 Band 3 Band 4
15-25 25-50 50-100 100-350 keV
Total 0.896535 0.625673 0.320062 0.237384
0.068208 0.070523 0.062548 0.055764 [error]
Peak 0.023635 0.022364 0.011461 0.010572
0.005493 0.005779 0.005069 0.004362 [error]
[ fluence units of on-axis counts / fully illuminated detector ]
======================================================================
====== Table of the duration information =============================
Value tstart tstop
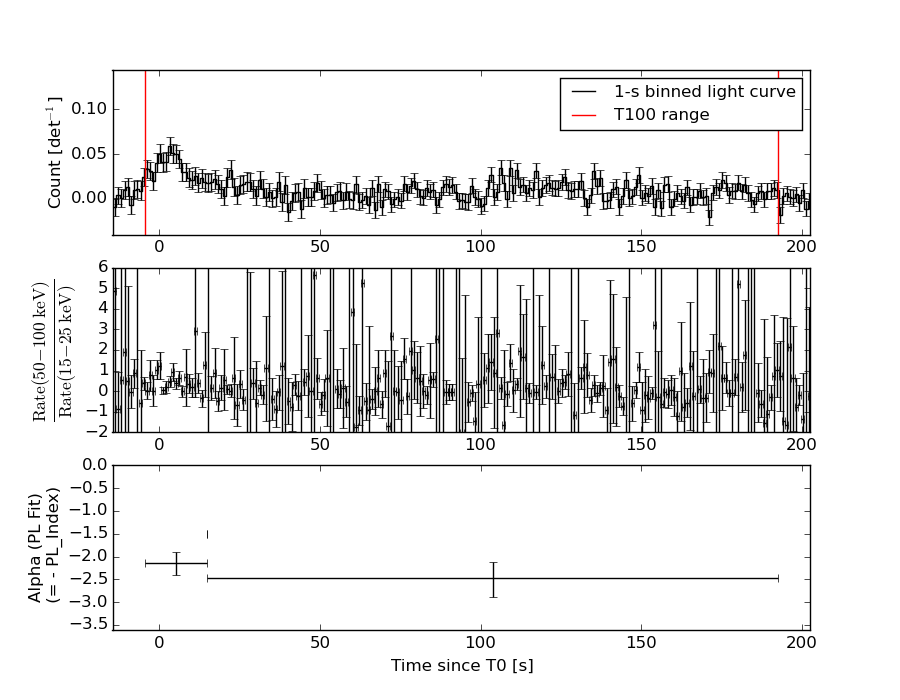
T100 197.012 -4.532 192.480
T90 180.644 -1.128 179.516
T50 114.236 7.248 121.484
Peak 1.000 2.556 3.556
====== Spectral Analysis Summary =====================================
Model : spectral model: simple power-law (PL) and cutoff power-law (CPL)
Ph_index : photon index: E^{Ph_index}
Ph_90err : 90% error of the photon index
Epeak : Epeak in keV
Epeak_90err: 90% error of Epeak
Norm : normalization at 50 keV in both the PL model and CPL model
Nomr_90err : 90% error of the normalization
chi2 : Chi-Squared
dof : degree of freedo
=== Time-averaged spectral analysis ===
(Best model with acceptable fit: PL)
Model Ph_index Ph_90err_low Ph_90err_hi Epeak Epeak_90err_low Epeak_90err_hi Norm Nomr_90err_low Norm_90err_hi chi2 dof
PL -2.355 -0.277 0.252 - - - 4.72e-04 -8.81e-05 8.58e-05 58.890 57
CPL -1.985 -0.014 0.289 2.079 214.980 375.671 7.22e-04 -5.95e-04 -2.67e-04 61.620 56
=== 1-s peak spectral analysis ===
(Best model with acceptable fit: PL)
Model Ph_index Ph_90err_low Ph_90err_hi Epeak Epeak_90err_low Epeak_90err_hi Norm Nomr_90err_low Norm_90err_hi chi2 dof
PL -2.064 -0.676 0.549 - - - 3.48e-03 -1.44e-03 1.29e-03 36.660 57
CPL -2.019 N/A N/A 62.954 N/A N/A 3.52e-03 N/A N/A 36.660 56
=== Fluence/Peak Flux Summary ===
Model Band1 Band2 Band3 Band4 Band5 Total
15-25 25-50 50-100 100-350 15-150 15-350 keV
Fluence PL 2.67e-07 2.93e-07 2.29e-07 2.94e-07 8.98e-07 1.08e-06 erg/cm2
90%_error_low -3.87e-08 -3.59e-08 -5.74e-08 -1.22e-07 -1.26e-07 -2.01e-07 erg/cm2
90%_error_hi 3.92e-08 3.48e-08 6.14e-08 1.74e-07 1.32e-07 2.41e-07 erg/cm2
Peak flux PL 2.47e-01 1.78e-01 8.52e-02 5.75e-02 5.38e-01 5.68e-01 ph/cm2/s
90%_error_low -9.02e-02 -4.92e-02 -4.36e-02 -4.14e-02 -1.39e-01 -1.52e-01 ph/cm2/s
90%_error_hi 9.32e-02 4.73e-02 4.59e-02 7.95e-02 1.39e-01 1.54e-01 ph/cm2/s
Fluence CPL 2.59e-07 2.11e-07 1.23e-07 1.33e-07 6.43e-07 7.26e-07 erg/cm2
90%_error_low -4.04e-08 -6.98e-08 -6.82e-08 -9.76e-08 -1.89e-07 -2.50e-07 erg/cm2
90%_error_hi 4.04e-08 9.06e-08 1.30e-07 3.02e-07 3.11e-07 5.18e-07 erg/cm2
Peak flux CPL 2.28e-01 9.65e-02 4.07e-02 9.98e-03 3.98e-01 4.14e-01 ph/cm2/s
90%_error_low -1.00e-01 -9.65e-02 -4.07e-02 -9.98e-03 N/A N/A ph/cm2/s
90%_error_hi 1.00e-01 1.13e-01 6.81e-02 7.84e-02 N/A N/A ph/cm2/s
======================================================================
Image
Pre-slew 15.0-350.0 keV image (Event data)
#   RAcent    DECcent   POSerr    Theta     Phi              Peak Cts       SNR   Name
    6.3956   -58.0521   0.0151    27.7133  -139.7044         1.0136503     12.729 TRIG_00295670

Foreground time interval of the image:
 -4.532  43.605 (delta_t =  48.137 [sec])
Background time interval of the image:
-239.296  -4.532 (delta_t = 234.764 [sec])
Light Curves
Note: The mask-weighted lightcurves have units of either count/det or counts/sec/det, where a det is 0.4 x 0.4 = 0.16 sq cm.
Full-time range; 1 s binning
Other quick-look light curves:
- 64 ms binning (zoomed)
- 16 ms binning (zoomed)
- 8 ms binning (zoomed)
- 2 ms binning (zoomed)
- SN=5 or 10 s binning (full-time range)
- Raw light curve
Spectra
- 64 ms binning (zoomed)
- 16 ms binning (zoomed)
- 8 ms binning (zoomed)
- 2 ms binning (zoomed)
- SN=5 or 10 s binning (full-time range)
- Raw light curve
Spectra
Notes:
- 1) The fitting includes the systematic errors.
- 2) When the burst includes telescope slew time periods, the fitting uses an average response file made from multiple 5-s response files through out the slew time plus single time preiod for the non-slew times, and weighted by the total counts in the corresponding time period using addrmf. An average response file is needed becuase a spectral fit using the pre-slew DRM will introduce some errors in both a spectral shape and a normalization if the PHA file contains a lot of the slew/post-slew time interval.
- 3) For fits to more complicated models (e.g. a power-law over a cutoff power-law), the BAT team has decided to require a chi-square improvement of more than 6 for each extra dof.
Time averaged spectrum fit using the average DRM
Power-law model
Time interval is from   -4.532 sec. to  192.480 sec.

Spectral model in power-law:
------------------------------------------------------------
Parameters  : value       lower 90%   higher 90%
Photon index: -2.35491     ( -0.276665   0.251937 )
Norm@50keV  : 4.71734E-04    ( -8.81305e-05   8.57736e-05 )
------------------------------------------------------------
#Fit statistic : Chi-Squared =          58.89 using 59 PHA bins.
# Reduced chi-squared =          1.033 for     57 degrees of freedom
# Null hypothesis probability =   4.060708e-01

Photon flux (15-150 keV)    in 197 sec: 8.50443E-02 ( -0.0090669  0.0090669 ) ph/cm2/s
Energy fluence (15-150 keV)             : 8.97875e-07 ( -1.25983e-07  1.31554e-07 ) ergs/cm2
Cutoff power-law model
Time interval is from   -4.532 sec. to  192.480 sec.
Spectral model in the cutoff power-law:
------------------------------------------------------------
Parameters  : value       lower 90%   higher 90%
Photon index: -2.94308     ( -0.00554501   0.297825 )
Epeak [keV] : 297.745      ( -80.6801 80.0106 )
Norm@50keV  : 2.44785E-04    ( -0.000118383   0.000209293 )
------------------------------------------------------------
#Fit statistic : Chi-Squared =          55.89 using 59 PHA bins.
# Reduced chi-squared =         0.9981 for     56 degrees of freedom
# Null hypothesis probability =   4.789232e-01

Photon flux (15-150 keV)    in 197 sec: 7.07226E-02 ( -0.0141034  0.0180338 ) ph/cm2/s
Energy fluence (15-150 keV)             : 6.43408e-07 ( -1.88706e-07  3.1061e-07 ) ergs/cm2
1-s peak spectrum fit
Power-law model
Time interval is from    2.556 sec. to    3.556 sec.

Spectral model in power-law:
------------------------------------------------------------
Parameters  : value       lower 90%   higher 90%
Photon index: -2.06449     ( -0.675484   0.549623 )
Norm@50keV  : 3.47591E-03    ( -0.00143837   0.00128796 )
------------------------------------------------------------
#Fit statistic : Chi-Squared =          36.66 using 59 PHA bins.
# Reduced chi-squared =         0.6432 for     57 degrees of freedom
# Null hypothesis probability =   9.834149e-01

Photon flux (15-150 keV)    in 1 sec: 0.537501 ( -0.139242  0.139233 ) ph/cm2/s
Energy fluence (15-150 keV)             : 3.21951e-08 ( -1.10466e-08  1.17854e-08 ) ergs/cm2
Cutoff power-law model
Time interval is from    2.556 sec. to    3.556 sec.
Spectral model in the cutoff power-law:
------------------------------------------------------------
Parameters  : value       lower 90%   higher 90%
Photon index: -2.01936     (       )
Epeak [keV] : 62.9544      (   )
Norm@50keV  : 3.51517E-03    (     )
------------------------------------------------------------
#Fit statistic : Chi-Squared =          36.66 using 59 PHA bins.
# Reduced chi-squared =         0.6546 for     56 degrees of freedom
# Null hypothesis probability =   9.787831e-01

Photon flux (15-150 keV)    in 1 sec: 0.397821 (    ) ph/cm2/s
Energy fluence (15-150 keV)             : 0 ( 0  0 ) ergs/cm2
Time-resolved spectra
Distribution
T90 vs. Hardness ratio plot
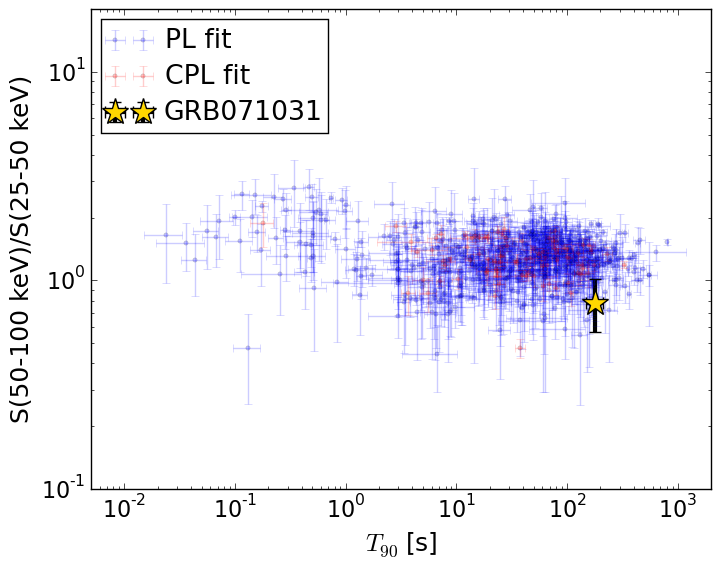
T90                                   = 180.644 sec.
Hardness ratio (energy fluence ratio) = 0.781933248946
S(15-50 keV) vs. S(50-150 keV) plot
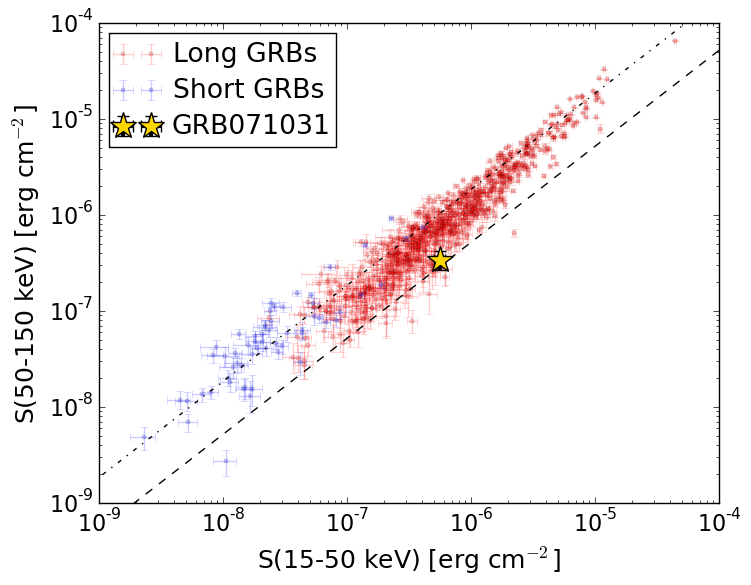
S(15-50 keV)  = 5.591997e-07
S(50-150 keV) = 3.386621e-07
The dash-dotted line and the dashed line traces the fluences calculated from the Band function with Epeak = 15 and 150 keV, respectively. Both lines assume a canonical values of alpha = -1 and beta = -2.5.
Mask shadow pattern
IMX = -4.006616742400414E-01, IMY = 3.397329664709020E-01
Spacecraft aspect plot
Bright source in the pre-burst/pre-slew/post-slew images
Pre-burst image of 15-350 keV band
Time interval of the image:
-239.296000 -4.532000

# RAcent  DECcent POSerr Theta    Phi  PeakCts   SNR AngSep     Name
#  [deg]    [deg]    ['] [deg]  [deg]                   [']
 20.1528  -8.7342    2.6  33.3  106.5   1.3692   4.5 ------	UNKNOWN
307.6485  -6.9455    2.7  49.8  -16.2   1.4836   4.2 ------	UNKNOWN
305.4889 -42.7453    3.4  39.7  -66.1   1.6812   3.4 ------	UNKNOWN
Pre-slew background subtracted image of 15-350 keV band
Time interval of the image:
-4.532000 43.604590

# RAcent  DECcent POSerr Theta    Phi  PeakCts   SNR AngSep     Name
#  [deg]    [deg]    ['] [deg]  [deg]                   [']
347.5450  15.0293    2.0  47.1   45.6   1.7000   5.7 ------	UNKNOWN
350.6729  13.0203    1.8  44.8   49.5   1.8932   6.4 ------	UNKNOWN
334.5501  15.2804    2.7  50.5   29.5   1.5901   4.3 ------	UNKNOWN
350.8700 -12.1415    2.5  19.7   44.8   0.3446   4.6 ------	UNKNOWN
  6.3956 -58.0521    0.9  27.7 -139.7   1.0137  12.7 ------	UNKNOWN
Post-slew image of 15-350 keV band
Time interval of the image:
91.804610 962.752200

# RAcent  DECcent POSerr Theta    Phi  PeakCts   SNR AngSep     Name
#  [deg]    [deg]    ['] [deg]  [deg]                   [']
359.7471 -14.8269    2.7  43.5   52.3   5.9582   4.2 ------	UNKNOWN
  0.2209 -27.8360    2.4  30.5   50.8   2.7990   4.9 ------	UNKNOWN
 19.0294 -73.4206    1.7  16.2 -131.2   2.7451   6.7 ------	UNKNOWN
308.1132 -32.7117    3.1  46.2  -21.2   2.6831   3.7 ------	UNKNOWN
302.2168 -25.6695    3.4  54.9  -21.0   4.9495   3.5 ------	UNKNOWN
286.8216 -82.9705    2.9  31.4 -104.9   2.7677   4.0 ------	UNKNOWN