Analysis Summary
Notes:
- 1) No attempt has been made to eliminate the non-significant decimal places.
- 2) This batgrbproduct analysis is done using the HEASARC data.
- 3) This batgrbproduct analysis is using the flight position for the mask-weighting calculation.
======================================================================
                  BAT GRB EVENT DATA PROCESSING REPORT
    Process Script Ver: batgrbproduct v2.46
    Process Start Time: Mon Jan 20 05:44:04 EST 2014
             Host Name: batevent1
   Current Working Dir: /local/data/batevent/batevent_reproc/trigger295779
======================================================================

  Trigger: 00295779      Segment: 000

  BAT Trigger Time: 215632428.928   [s; MET]
      Trigger Stop: 215632430.976   [s; MET]
               UTC: 2007-11-01T17:53:46.595880    [includes UTCF correction]
       Where From?: TDRSS position message

  BAT
    RA: 48.1935449819936   Dec: 62.4734168223862  [deg; J2000]

     Catalogged Source?: NO
     Point Source?:      YES
     GRB Indicated?:     YES    [ by BAT flight software ]
     Image S/N Ratio:    6.51
     Image Trigger?:     NO
     Rate S/N Ratio:     9.2736184954957  [ if not an image trigger ]
     Image S/N Ratio:    6.51

  Analysis Position:   [ source = BAT ]
    RA: 48.1935449819936   Dec: 62.4734168223862  [deg; J2000]

  Refined Position:   [ source = BAT pre-slew burst ]
    RA: 48.1938288093563   Dec: 62.5433978046221  [deg; J2000]
        { 03h 12m 46.5s , +62d 32' 36.2" }
         +/- 2.35401134868118 [arcmin] (estimated 90% radius based on SNR)
         +/- 1.5266903466389 [arcmin] (formal 1-sigma fit error)
    SNR: 8.9528911709225

  Angular difference between the analysis and refined position is 4.198866 arcmin

  Partial Coding Fraction: 0.9921875    [ including projection effects ]

  Duration
     T90: 4.824000030756 +/- 1.97251515354481
        Measured from: -1.31600001454353
                   to: 3.50800001621246     [s; relative to TRIGTIME]
     T50: 1.74799999594688 +/- 1.34750140747039
        Measured from: 0.104000002145767
                   to: 1.85199999809265     [s; relative to TRIGTIME]


  Fluence
     Peak Flux  (peak 1 second)
        Measured from: -0.208000004291534
                   to: 0.791999995708466     [s; relative to TRIGTIME]
     Total Fluence
        Measured from: -1.55200001597404
                   to: 3.62399998307228     [s; relative to TRIGTIME]

             Band 1     Band 2     Band 3     Band 4
              15-25      25-50     50-100    100-350     keV
 Total     0.050266   0.058764   0.022272   0.024852
           0.011134   0.011638   0.010380   0.009800 [error]
 Peak      0.016573   0.028180   0.012534   0.014056
           0.005023   0.005290   0.004628   0.004199 [error]

     [ fluence units of on-axis counts / fully illuminated detector ]

======================================================================


====== Table of the duration information =============================

        Value   tstart    tstop
T100    5.176   -1.552    3.624
T90     4.824   -1.316    3.508
T50     1.748    0.104    1.852
Peak    1.000   -0.208    0.792


====== Spectral Analysis Summary =====================================

Model      : spectral model: simple power-law (PL) and cutoff power-law (CPL)
Ph_index   : photon index: E^{Ph_index}
Ph_90err   : 90% error of the photon index
Epeak      : Epeak in keV
Epeak_90err: 90% error of Epeak
Norm       : normalization at 50 keV in both the PL model and CPL model
Nomr_90err : 90% error of the normalization
chi2       : Chi-Squared
dof        : degree of freedo

=== Time-averaged spectral analysis ===
(Best model with acceptable fit: PL)

Model Ph_index Ph_90err_low Ph_90err_hi  Epeak  Epeak_90err_low  Epeak_90err_hi  Norm       Nomr_90err_low    Norm_90err_hi    chi2    dof
PL      -2.002    -0.471      0.409       -           -               -         1.47e-03     -4.71e-04          4.54e-04      37.160   57
CPL     -0.823    -1.310      2.961       37.661     -37.661       -37.661      7.83e-03     -7.83e-03          6.04e-01      36.130   56


=== 1-s peak spectral analysis ===
(Best model with acceptable fit: PL)

Model Ph_index Ph_90err_low Ph_90err_hi  Epeak  Epeak_90err_low  Epeak_90err_hi  Norm       Nomr_90err_low    Norm_90err_hi    chi2    dof
PL      -1.524     -0.413     0.401       -           -               -         3.72e-03     -1.00e-03          9.80e-04      56.970   57
CPL      0.476     -2.124     3.650       51.299     -13.900       -51.299      5.30e-02     -5.30e-02          6.20e+00      54.620   56


=== Fluence/Peak Flux Summary ===

              Model    Band1     Band2     Band3     Band4     Band5     Total
                       15-25     25-50    50-100    100-350    15-150    15-350    keV
Fluence         PL   1.56e-08  2.11e-08  2.11e-08  3.81e-08  7.02e-08  9.59e-08   erg/cm2
      90%_error_low -4.46e-09 -5.06e-09 -8.63e-09 -2.34e-08 -2.02e-08 -3.59e-08   erg/cm2
      90%_error_hi   4.58e-09  4.96e-09  9.41e-09  4.08e-08  2.17e-08  5.02e-08   erg/cm2
Peak flux       PL   1.57e-01  1.55e-01  1.08e-01  1.19e-01  4.67e-01  5.39e-01   ph/cm2/s
      90%_error_low -5.62e-02 -3.92e-02 -3.58e-02 -6.20e-02 -1.15e-01 -1.38e-01   ph/cm2/s
      90%_error_hi   6.05e-02  3.90e-02  3.63e-02  9.39e-02  1.15e-01  1.42e-01   ph/cm2/s

Fluence        CPL   1.48e-08  2.43e-08  1.82e-08  5.37e-09  6.14e-08  6.26e-08   erg/cm2
      90%_error_low -5.05e-09 -7.15e-09 -1.15e-08    N/A    -1.88e-08 -1.99e-08   erg/cm2
      90%_error_hi   4.92e-09  7.57e-09  1.13e-08    N/A     2.58e-08  6.94e-08   erg/cm2
Peak flux      CPL   1.30e-01  1.94e-01  1.01e-01  1.30e-02  4.38e-01  4.39e-01   ph/cm2/s
      90%_error_low -6.78e-02 -5.83e-02     N/A   -1.30e-02 -1.16e-01 -1.18e-01   ph/cm2/s
      90%_error_hi   6.91e-02  6.19e-02     N/A    1.18e-01  1.19e-01  1.50e-01   ph/cm2/s

======================================================================
Image
Pre-slew 15.0-350.0 keV image (Event data)
#   RAcent    DECcent   POSerr    Theta     Phi              Peak Cts       SNR   Name
   48.1938    62.5434   0.0214    12.8028  -126.0849         0.1860988      8.953 TRIG_00295779

Foreground time interval of the image:
 -1.552   3.624 (delta_t =   5.176 [sec])
Background time interval of the image:
-420.527 -325.830 (delta_t =  94.698 [sec])
-239.928  -1.552 (delta_t = 238.376 [sec])
Light Curves
Note: The mask-weighted lightcurves have units of either count/det or counts/sec/det, where a det is 0.4 x 0.4 = 0.16 sq cm.
Full-time range; 1 s binning
Other quick-look light curves:
- 64 ms binning (zoomed)
- 16 ms binning (zoomed)
- 8 ms binning (zoomed)
- 2 ms binning (zoomed)
- SN=5 or 10 s binning (full-time range)
- Raw light curve
Spectra
- 64 ms binning (zoomed)
- 16 ms binning (zoomed)
- 8 ms binning (zoomed)
- 2 ms binning (zoomed)
- SN=5 or 10 s binning (full-time range)
- Raw light curve
Spectra
Notes:
- 1) The fitting includes the systematic errors.
- 2) When the burst includes telescope slew time periods, the fitting uses an average response file made from multiple 5-s response files through out the slew time plus single time preiod for the non-slew times, and weighted by the total counts in the corresponding time period using addrmf. An average response file is needed becuase a spectral fit using the pre-slew DRM will introduce some errors in both a spectral shape and a normalization if the PHA file contains a lot of the slew/post-slew time interval.
- 3) For fits to more complicated models (e.g. a power-law over a cutoff power-law), the BAT team has decided to require a chi-square improvement of more than 6 for each extra dof.
Time averaged spectrum fit using the average DRM
Power-law model
Time interval is from   -1.552 sec. to    3.624 sec.

Spectral model in power-law:
------------------------------------------------------------
Parameters  : value       lower 90%   higher 90%
Photon index: -2.0018     ( -0.471111   0.40935 )
Norm@50keV  : 1.47000E-03    ( -0.000471453   0.000454014 )
------------------------------------------------------------
#Fit statistic : Chi-Squared =          37.16 using 59 PHA bins.
# Reduced chi-squared =         0.6519 for     57 degrees of freedom
# Null hypothesis probability =   9.806735e-01

Photon flux (15-150 keV)    in 5.176 sec: 0.220700 ( -0.049836  0.049878 ) ph/cm2/s
Energy fluence (15-150 keV)             : 7.01866e-08 ( -2.0193e-08  2.17026e-08 ) ergs/cm2
Cutoff power-law model
Time interval is from   -1.552 sec. to    3.624 sec.
Spectral model in the cutoff power-law:
------------------------------------------------------------
Parameters  : value       lower 90%   higher 90%
Photon index: -0.82335     ( -1.31352   2.95717 )
Epeak [keV] : 37.6607      ( -37.6582 -37.6582 )
Norm@50keV  : 7.83213E-03    ( -0.00788713   0.604097 )
------------------------------------------------------------
#Fit statistic : Chi-Squared =          36.13 using 59 PHA bins.
# Reduced chi-squared =         0.6453 for     56 degrees of freedom
# Null hypothesis probability =   9.819378e-01

Photon flux (15-150 keV)    in 5.176 sec: 0.213340 ( -0.049691  0.050853 ) ph/cm2/s
Energy fluence (15-150 keV)             : 6.14091e-08 ( -1.87831e-08  2.57644e-08 ) ergs/cm2
1-s peak spectrum fit
Power-law model
Time interval is from   -0.208 sec. to    0.792 sec.

Spectral model in power-law:
------------------------------------------------------------
Parameters  : value       lower 90%   higher 90%
Photon index: -1.52382     ( -0.413482   0.400995 )
Norm@50keV  : 3.71871E-03    ( -0.00100002   0.00097964 )
------------------------------------------------------------
#Fit statistic : Chi-Squared =          56.97 using 59 PHA bins.
# Reduced chi-squared =         0.9995 for     57 degrees of freedom
# Null hypothesis probability =   4.760547e-01

Photon flux (15-150 keV)    in 1 sec: 0.467286 ( -0.115436  0.115478 ) ph/cm2/s
Energy fluence (15-150 keV)             : 3.51536e-08 ( -1.00665e-08  1.04995e-08 ) ergs/cm2
Cutoff power-law model
Time interval is from   -0.208 sec. to    0.792 sec.
Spectral model in the cutoff power-law:
------------------------------------------------------------
Parameters  : value       lower 90%   higher 90%
Photon index: 0.475826     ( -2.14389   3.62978 )
Epeak [keV] : 51.2991      ( -13.6941 -51.0936 )
Norm@50keV  : 5.29841E-02    ( -0.055424   6.19363 )
------------------------------------------------------------
#Fit statistic : Chi-Squared =          54.62 using 59 PHA bins.
# Reduced chi-squared =         0.9753 for     56 degrees of freedom
# Null hypothesis probability =   5.272712e-01

Photon flux (15-150 keV)    in 1 sec: 0.437714 ( -0.116352  0.119316 ) ph/cm2/s
Energy fluence (15-150 keV)             : 2.82872e-08 ( -8.99641e-09  1.25786e-08 ) ergs/cm2
Time-resolved spectra
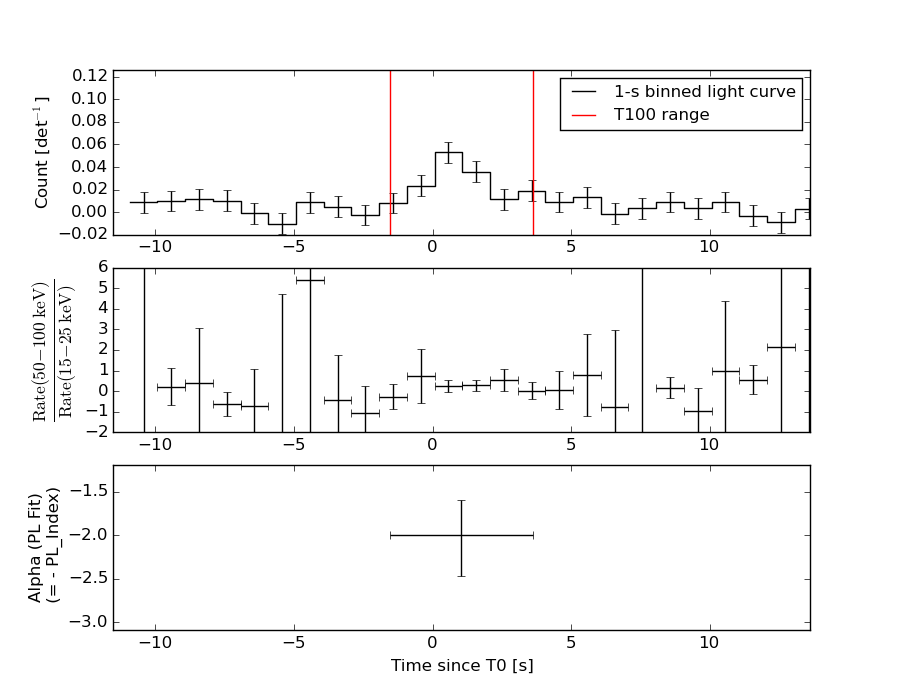
Distribution
T90 vs. Hardness ratio plot
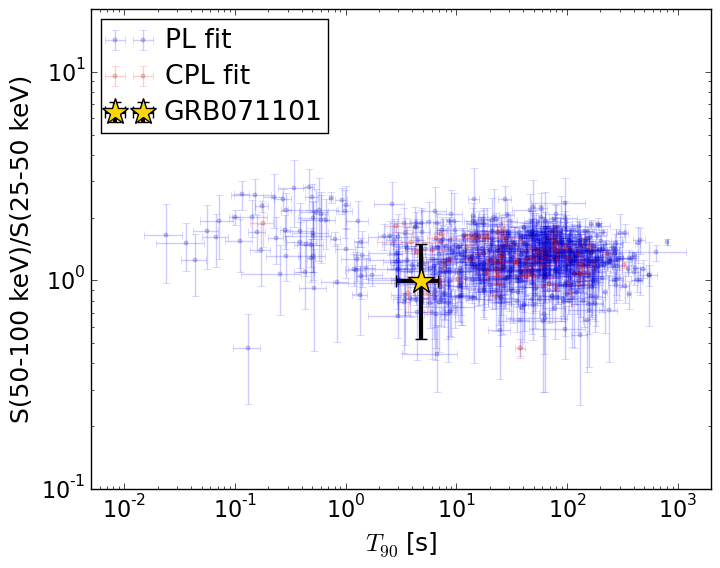
T90                                   = 4.824 sec.
Hardness ratio (energy fluence ratio) = 0.99882678525
S(15-50 keV) vs. S(50-150 keV) plot
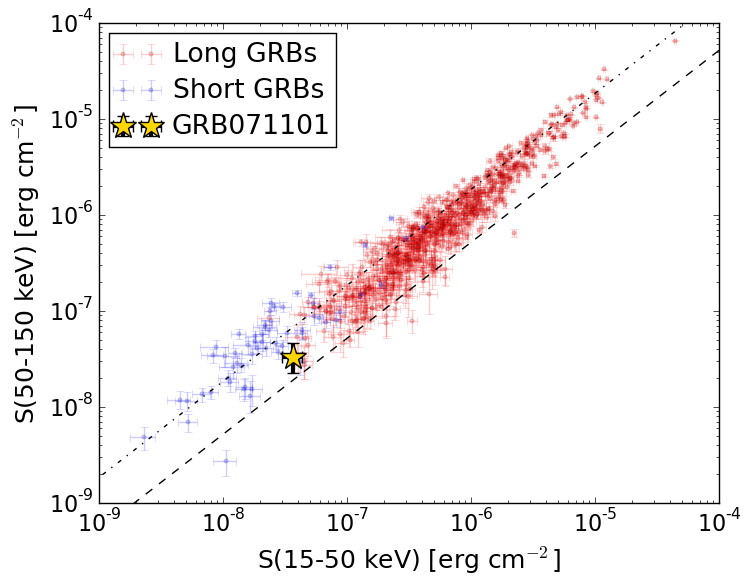
S(15-50 keV)  = 3.673526e-08
S(50-150 keV) = 3.345197e-08
The dash-dotted line and the dashed line traces the fluences calculated from the Band function with Epeak = 15 and 150 keV, respectively. Both lines assume a canonical values of alpha = -1 and beta = -2.5.
Mask shadow pattern
IMX = -1.338434368322440E-01, IMY = 1.836470600866191E-01
Spacecraft aspect plot
Bright source in the pre-burst/pre-slew/post-slew images
Pre-burst image of 15-350 keV band
Time interval of the image:
-420.527400 -325.829600
-239.928000 -1.552000

# RAcent  DECcent POSerr Theta    Phi  PeakCts   SNR AngSep     Name
#  [deg]    [deg]    ['] [deg]  [deg]                   [']
 83.6343  22.0086    0.3  35.6   24.3  13.9384  39.8    0.4	Crab
336.8680  35.9239    3.7  56.9  179.1   4.7005   3.1 ------	UNKNOWN
109.7307  25.4345    2.6  47.6   -7.7   2.2332   4.4 ------	UNKNOWN
105.4332  40.3485    2.2  35.2  -21.5   1.5945   5.3 ------	UNKNOWN
Pre-slew background subtracted image of 15-350 keV band
Time interval of the image:
-1.552000 3.624000

# RAcent  DECcent POSerr Theta    Phi  PeakCts   SNR AngSep     Name
#  [deg]    [deg]    ['] [deg]  [deg]                   [']
 83.6313  22.1639    4.4  35.5   24.1   0.0878   2.6    9.0	Crab
358.4503  23.3747    2.2  52.0  152.0   0.6133   5.3 ------	UNKNOWN
 48.1929  62.5435    1.3  12.8 -126.1   0.1857   8.9 ------	UNKNOWN
305.4566  67.0668    2.2  51.5 -136.6   0.5641   5.2 ------	UNKNOWN
Post-slew image of 15-350 keV band
Time interval of the image:
62.372610 310.972600

# RAcent  DECcent POSerr Theta    Phi  PeakCts   SNR AngSep     Name
#  [deg]    [deg]    ['] [deg]  [deg]                   [']
 83.6296  22.0276    0.7  47.0   27.9  10.6621  17.7    0.8	Crab
308.1723  40.9066   15.4  58.7 -165.5  -1.0984  -0.7    3.9	Cyg X-3
326.3520  38.3596   59.8  53.0  178.8   0.1246   0.2    8.8	Cyg X-2