Analysis Summary
Notes:
- 1) No attempt has been made to eliminate the non-significant decimal places.
- 2) This batgrbproduct analysis is done using the HEASARC data.
- 3) This batgrbproduct analysis is using the flight position for the mask-weighting calculation.
======================================================================
                  BAT GRB EVENT DATA PROCESSING REPORT
    Process Script Ver: batgrbproduct v2.46
    Process Start Time: Mon Jan 20 05:38:06 EST 2014
             Host Name: batevent1
   Current Working Dir: /local/data/batevent/batevent_reproc/trigger296503
======================================================================

  Trigger: 00296503      Segment: 000

  BAT Trigger Time: 216584613.888   [s; MET]
      Trigger Stop: 216584614.144   [s; MET]
               UTC: 2007-11-12T18:23:31.530800    [includes UTCF correction]
       Where From?: TDRSS position message

  BAT
    RA: 260.304966584962   Dec: -80.884395671755  [deg; J2000]

     Catalogged Source?: NO
     Point Source?:      YES
     GRB Indicated?:     YES    [ by BAT flight software ]
     Image S/N Ratio:    7.92
     Image Trigger?:     NO
     Rate S/N Ratio:     21.2837966537928  [ if not an image trigger ]
     Image S/N Ratio:    7.92

  Analysis Position:   [ source = BAT ]
    RA: 260.304966584962   Dec: -80.884395671755  [deg; J2000]

  Refined Position:   [ source = BAT pre-slew burst ]
    RA: 260.198365400302   Dec: -80.8856828336721  [deg; J2000]
        { 17h 20m 47.6s , -80d 53' 08.5" }
         +/- 2.27427999962638 [arcmin] (estimated 90% radius based on SNR)
         +/- 1.04387724285579 [arcmin] (formal 1-sigma fit error)
    SNR: 9.4046217717477

  Angular difference between the analysis and refined position is 1.016178 arcmin

  Partial Coding Fraction: 0.7890625    [ including projection effects ]

  Duration
     T90: 0.303999960422516 +/- 0.090509661754147
        Measured from: -0.0480000078678131
                   to: 0.255999952554703     [s; relative to TRIGTIME]
     T50: 0.127999991178513 +/- 0.0715541736806378
        Measured from: 0.0319999754428864
                   to: 0.159999966621399     [s; relative to TRIGTIME]


  Fluence
     Peak Flux  (peak 1 second)
        Measured from: -0.380000025033951
                   to: 0.619999974966049     [s; relative to TRIGTIME]
     Total Fluence
        Measured from: -0.0480000078678131
                   to: 0.27199998497963     [s; relative to TRIGTIME]

             Band 1     Band 2     Band 3     Band 4
              15-25      25-50     50-100    100-350     keV
 Total     0.003472   0.019186   0.028891   0.012145
           0.003599   0.003947   0.003920   0.003318 [error]
 Peak     -0.001103   0.020936   0.025100   0.016070
           0.006041   0.006241   0.005669   0.005004 [error]

     [ fluence units of on-axis counts / fully illuminated detector ]

======================================================================


====== Table of the duration information =============================

        Value   tstart    tstop
T100    0.320   -0.048    0.272
T90     0.304   -0.048    0.256
T50     0.128    0.032    0.160
Peak    1.000   -0.380    0.620


====== Spectral Analysis Summary =====================================

Model      : spectral model: simple power-law (PL) and cutoff power-law (CPL)
Ph_index   : photon index: E^{Ph_index}
Ph_90err   : 90% error of the photon index
Epeak      : Epeak in keV
Epeak_90err: 90% error of Epeak
Norm       : normalization at 50 keV in both the PL model and CPL model
Nomr_90err : 90% error of the normalization
chi2       : Chi-Squared
dof        : degree of freedo

=== Time-averaged spectral analysis ===
(Best model with acceptable fit: N/A)

Model Ph_index Ph_90err_low Ph_90err_hi  Epeak  Epeak_90err_low  Epeak_90err_hi  Norm       Nomr_90err_low    Norm_90err_hi    chi2    dof
PL      -0.705    -0.310      0.337       -           -               -         1.22e-02     -2.62e-03          2.55e-03      73.770   57
CPL      0.720    -1.398      2.432      124.383     -39.969      -124.383      4.19e-02     -4.19e-02          2.32e-01      71.070   56


=== 1-s peak spectral analysis ===
(Best model with acceptable fit: PL)

Model Ph_index Ph_90err_low Ph_90err_hi  Epeak  Epeak_90err_low  Epeak_90err_hi  Norm       Nomr_90err_low    Norm_90err_hi    chi2    dof
PL      -0.580     -0.500     0.614       -           -               -         3.83e-03     -1.38e-03          1.30e-03      54.680   57
CPL      0.442     -0.442     3.806      155.205    -155.205      -155.205      9.40e-03     -9.40e-03          1.60e-01      54.080   56


=== Fluence/Peak Flux Summary ===

              Model    Band1     Band2     Band3     Band4     Band5     Total
                       15-25     25-50    50-100    100-350    15-150    15-350    keV
Fluence         PL   2.38e-09  7.15e-09  1.75e-08  1.20e-07  4.75e-08  1.47e-07   erg/cm2
      90%_error_low -9.34e-10 -1.92e-09 -3.33e-09 -4.36e-08 -9.14e-09 -4.54e-08   erg/cm2
      90%_error_hi   1.12e-09  1.91e-09  3.32e-09  5.88e-08  9.16e-09  5.88e-08   erg/cm2
Peak flux       PL   6.58e-02  1.15e-01  1.54e-01  4.22e-01  4.48e-01  7.57e-01   ph/cm2/s
      90%_error_low -4.09e-02 -5.29e-02 -4.30e-02 -2.03e-01 -1.37e-01 -2.30e-01   ph/cm2/s
      90%_error_hi   5.81e-02  5.47e-02  4.30e-02  3.28e-01  1.41e-01  2.83e-01   ph/cm2/s

Fluence        CPL   1.45e-09  7.20e-09  2.07e-08  3.68e-08  4.65e-08  6.61e-08   erg/cm2
      90%_error_low -1.01e-09 -2.37e-09 -4.62e-09 -2.40e-08 -9.87e-09 -2.52e-08   erg/cm2
      90%_error_hi   1.41e-09  2.24e-09  4.88e-09  8.85e-08  9.60e-09  5.37e-08   erg/cm2
Peak flux      CPL   4.55e-02  1.14e-01  1.73e-01  2.00e-01  4.32e-01  5.32e-01   ph/cm2/s
      90%_error_low -4.55e-02 -6.26e-02 -5.66e-02 -2.00e-01 -1.37e-01 -2.17e-01   ph/cm2/s
      90%_error_hi   7.04e-02  6.12e-02  6.10e-02  3.14e-01  1.44e-01  3.53e-01   ph/cm2/s

======================================================================
Image
Pre-slew 15.0-350.0 keV image (Event data)
#   RAcent    DECcent   POSerr    Theta     Phi              Peak Cts       SNR   Name
  260.1984   -80.8857   0.0203    32.8532  -173.2521         0.0685571      9.405 TRIG_00296503

Foreground time interval of the image:
 -0.048   0.272 (delta_t =   0.320 [sec])
Background time interval of the image:
-239.888  -0.048 (delta_t = 239.840 [sec])
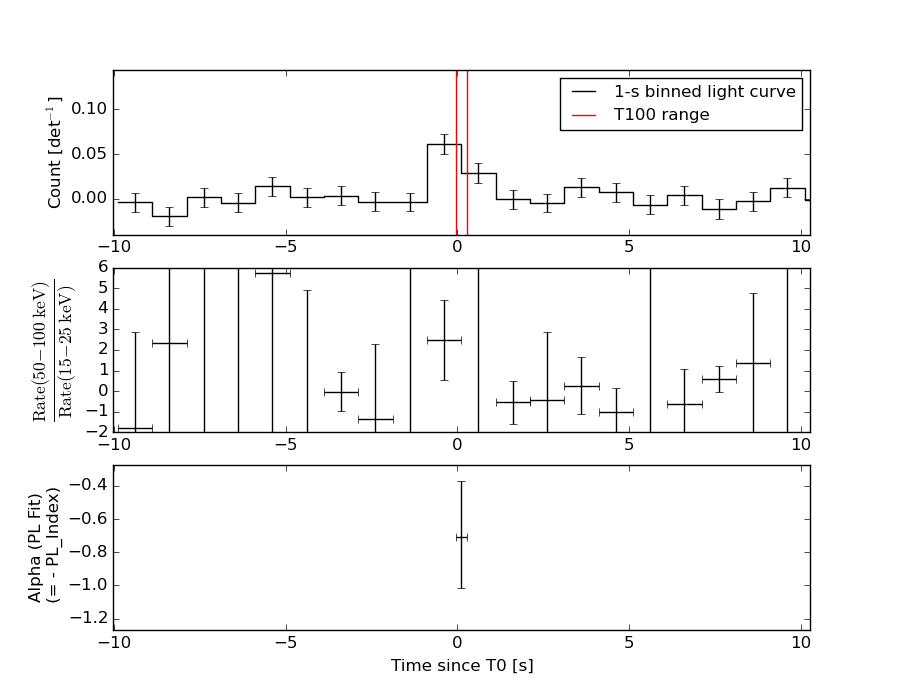
Light Curves
Note: The mask-weighted lightcurves have units of either count/det or counts/sec/det, where a det is 0.4 x 0.4 = 0.16 sq cm.
Full-time range; 1 s binning
Other quick-look light curves:
- 64 ms binning (zoomed)
- 16 ms binning (zoomed)
- 8 ms binning (zoomed)
- 2 ms binning (zoomed)
- SN=5 or 10 s binning (full-time range)
- Raw light curve
Spectra
- 64 ms binning (zoomed)
- 16 ms binning (zoomed)
- 8 ms binning (zoomed)
- 2 ms binning (zoomed)
- SN=5 or 10 s binning (full-time range)
- Raw light curve
Spectra
Notes:
- 1) The fitting includes the systematic errors.
- 2) When the burst includes telescope slew time periods, the fitting uses an average response file made from multiple 5-s response files through out the slew time plus single time preiod for the non-slew times, and weighted by the total counts in the corresponding time period using addrmf. An average response file is needed becuase a spectral fit using the pre-slew DRM will introduce some errors in both a spectral shape and a normalization if the PHA file contains a lot of the slew/post-slew time interval.
- 3) For fits to more complicated models (e.g. a power-law over a cutoff power-law), the BAT team has decided to require a chi-square improvement of more than 6 for each extra dof.
Time averaged spectrum fit using the average DRM
Power-law model
Time interval is from   -0.048 sec. to    0.272 sec.

Spectral model in power-law:
------------------------------------------------------------
Parameters  : value       lower 90%   higher 90%
Photon index: -0.704718     ( -0.309942   0.337352 )
Norm@50keV  : 1.21873E-02    ( -0.00262005   0.00254952 )
------------------------------------------------------------
#Fit statistic : Chi-Squared =          73.77 using 59 PHA bins.
# Reduced chi-squared =          1.294 for     57 degrees of freedom
# Null hypothesis probability =   6.680944e-02

Photon flux (15-150 keV)    in 0.32 sec: 1.40821 ( -0.28174  0.28485 ) ph/cm2/s
Energy fluence (15-150 keV)             : 4.75085e-08 ( -9.14394e-09  9.1585e-09 ) ergs/cm2
Cutoff power-law model
Time interval is from   -0.048 sec. to    0.272 sec.
Spectral model in the cutoff power-law:
------------------------------------------------------------
Parameters  : value       lower 90%   higher 90%
Photon index: 0.720063     ( -1.40984   2.41986 )
Epeak [keV] : 124.383      ( -40.1472 -124.561 )
Norm@50keV  : 4.19401E-02    ( -0.0427679   0.230748 )
------------------------------------------------------------
#Fit statistic : Chi-Squared =          71.07 using 59 PHA bins.
# Reduced chi-squared =          1.269 for     56 degrees of freedom
# Null hypothesis probability =   8.456543e-02

Photon flux (15-150 keV)    in 0.32 sec: 1.34711 ( -0.2849  0.29033 ) ph/cm2/s
Energy fluence (15-150 keV)             : 4.65146e-08 ( -9.86573e-09  9.59926e-09 ) ergs/cm2
1-s peak spectrum fit
Power-law model

Time interval is from   -0.380 sec. to    0.620 sec.

Spectral model in power-law:
------------------------------------------------------------
Parameters  : value       lower 90%   higher 90%
Photon index: -0.580316     ( -0.500202   0.613959 )
Norm@50keV  : 3.83036E-03    ( -0.00138213   0.00129647 )
------------------------------------------------------------
#Fit statistic : Chi-Squared =          54.68 using 59 PHA bins.
# Reduced chi-squared =         0.9594 for     57 degrees of freedom
# Null hypothesis probability =   5.624533e-01

Photon flux (15-150 keV)    in 1 sec: 0.448318 ( -0.136781  0.141103 ) ph/cm2/s
Energy fluence (15-150 keV)             : 4.9455e-08 ( -1.39908e-08  1.40357e-08 ) ergs/cm2
Cutoff power-law model
Time interval is from   -0.380 sec. to    0.620 sec.
Spectral model in the cutoff power-law:
------------------------------------------------------------
Parameters  : value       lower 90%   higher 90%
Photon index: 0.441984     ( -0.444081   3.80357 )
Epeak [keV] : 155.205      ( -155.134 -155.134 )
Norm@50keV  : 9.40424E-03    ( -0.00941281   0.160398 )
------------------------------------------------------------
#Fit statistic : Chi-Squared =          54.08 using 59 PHA bins.
# Reduced chi-squared =         0.9657 for     56 degrees of freedom
# Null hypothesis probability =   5.479725e-01

Photon flux (15-150 keV)    in 1 sec: 0.432274 ( -0.136766  0.144446 ) ph/cm2/s
Energy fluence (15-150 keV)             : 4.81061e-08 ( -1.51868e-08  1.45928e-08 ) ergs/cm2
Time-resolved spectra
Distribution
T90 vs. Hardness ratio plot
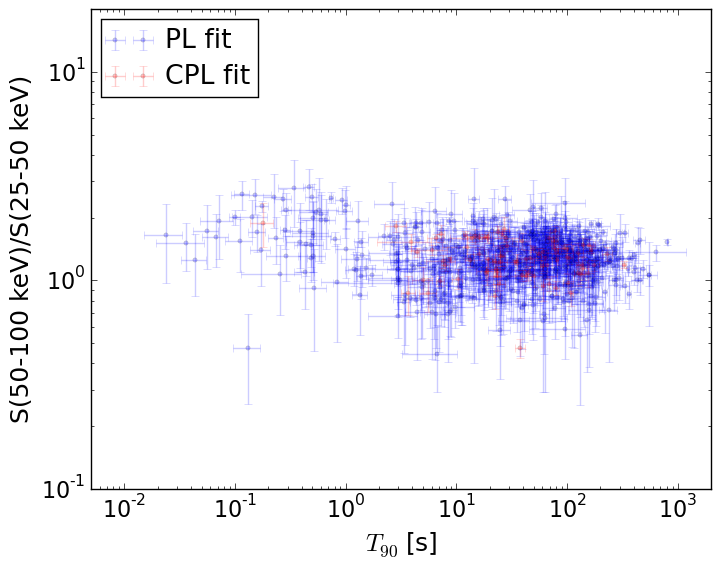
T90                                   = N/A sec.
Hardness ratio (energy fluence ratio) = N/A
S(15-50 keV) vs. S(50-150 keV) plot
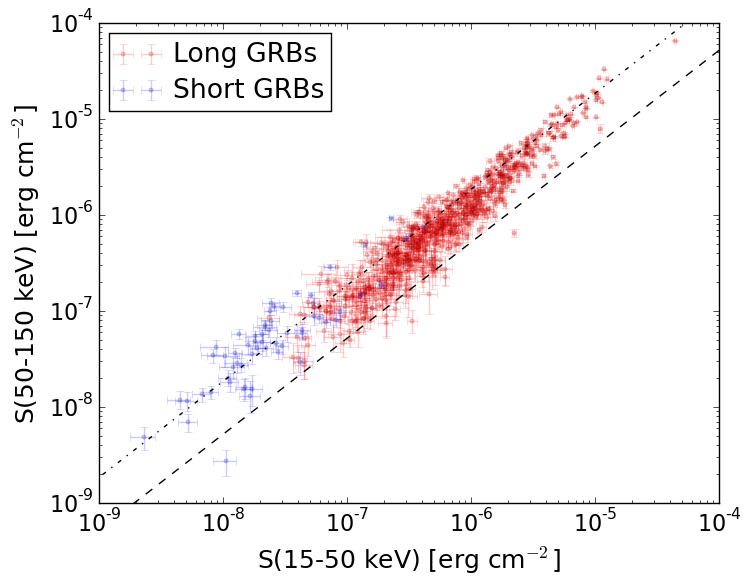
S(15-50 keV)  = N/A
S(50-150 keV) = N/A
The dash-dotted line and the dashed line traces the fluences calculated from the Band function with Epeak = 15 and 150 keV, respectively. Both lines assume a canonical values of alpha = -1 and beta = -2.5.
Mask shadow pattern
IMX = -6.412966035483660E-01, IMY = 7.587889088522182E-02
Spacecraft aspect plot
Bright source in the pre-burst/pre-slew/post-slew images
Pre-burst image of 15-350 keV band
Time interval of the image:
-239.888000 -0.048000

# RAcent  DECcent POSerr Theta    Phi  PeakCts   SNR AngSep     Name
#  [deg]    [deg]    ['] [deg]  [deg]                   [']
186.9479 -62.7212    5.4  54.5 -151.6   1.5712   2.1    8.5	GX 301-2
256.0502 -37.9244    3.6  31.7  -86.6   0.8923   3.3    5.7	4U 1700-377
256.4925 -36.3025    4.7  32.4  -83.8   0.6689   2.5    7.7	GX 349+2
263.1708 -24.7795    4.3  36.7  -62.3  -0.8851  -2.7    9.0	GX 1+4
264.8304 -44.3861   15.0  22.7  -91.0   0.1611   0.8    5.4	4U 1735-44
270.3250 -25.1090    3.7  32.7  -53.2   0.7185   3.1    2.8	GX 5-1
270.3918 -25.9072    0.0  32.0  -54.0  -0.2301  -1.0   11.0	GRS 1758-258
273.8612 -14.0316   13.3  41.0  -39.7   0.2575   0.9    8.4	GX 17+2
276.0129 -30.4512    2.2  25.5  -50.5   1.0224   5.2    6.8	H1820-303
285.0772 -24.8134    4.8  27.2  -28.6  -0.4452  -2.4    6.8	HT1900.1-2455
263.0213 -33.8065    4.2  30.0  -73.4   0.6396   2.8    2.3	GX 354-0
277.3614 -23.7941    1.5  30.7  -41.4   1.4974   7.5 ------	UNKNOWN
162.6042 -65.2212    2.9  59.4 -163.2   4.4547   4.0 ------	UNKNOWN
255.1171 -41.6473    1.9  30.2  -93.4   1.6060   6.0 ------	UNKNOWN
Pre-slew background subtracted image of 15-350 keV band
Time interval of the image:
-0.048000 0.272000

# RAcent  DECcent POSerr Theta    Phi  PeakCts   SNR AngSep     Name
#  [deg]    [deg]    ['] [deg]  [deg]                   [']
187.0370 -62.7258   10.1  54.4 -151.6   0.0276   1.1   10.8	GX 301-2
256.1518 -37.7969  114.3  31.7  -86.3   0.0011   0.1    8.3	4U 1700-377
256.4558 -36.2845   20.0  32.4  -83.8   0.0067   0.6    8.4	GX 349+2
263.1138 -24.8446   11.3  36.7  -62.4   0.0119   1.0    8.2	GX 1+4
264.6305 -44.5641    8.5  22.7  -91.6   0.0100   1.4    8.4	4U 1735-44
270.1334 -25.1808   13.8  32.7  -53.6   0.0076   0.8   10.2	GX 5-1
270.2135 -25.5791    0.0  32.4  -53.9   0.0078   0.9   11.0	GRS 1758-258
274.0986 -13.9880    8.7  41.0  -39.4   0.0142   1.3    6.1	GX 17+2
276.0295 -30.5133   27.5  25.4  -50.5   0.0029   0.4   10.3	H1820-303
285.1474 -25.0836    0.0  26.9  -28.6   0.0105   1.5   11.5	HT1900.1-2455
263.0744 -34.0124    0.0  29.8  -73.6  -0.0129  -1.4   11.5	GX 354-0
325.1395 -17.0595    2.9  40.0   40.3   0.0599   4.0 ------	UNKNOWN
 24.7164 -76.5929    2.3  40.9  155.9   0.0535   5.0 ------	UNKNOWN
260.1984 -80.8857    1.2  32.9 -173.3   0.0686   9.4 ------	UNKNOWN
255.8065 -22.4735    2.9  42.7  -68.4   0.0927   4.1 ------	UNKNOWN
Post-slew image of 15-350 keV band
Time interval of the image:
-239.888000 482.183600

# RAcent  DECcent POSerr Theta    Phi  PeakCts   SNR AngSep     Name
#  [deg]    [deg]    ['] [deg]  [deg]                   [']
186.6272 -62.8749    7.5  54.5 -151.9  -2.7115  -1.5    6.3	GX 301-2
255.9978 -37.9119   11.2  31.7  -86.6   0.6141   1.0    4.1	4U 1700-377
256.4141 -36.5334    6.2  32.3  -84.2   1.0695   1.9    6.7	GX 349+2
262.8978 -24.7833    5.3  36.8  -62.6   1.7701   2.2    6.5	GX 1+4
264.6374 -44.4407   10.2  22.8  -91.3  -0.5164  -1.1    4.6	4U 1735-44
270.4061 -25.0660    4.1  32.7  -53.1   1.4461   2.8    6.7	GX 5-1
270.2818 -25.7190   16.8  32.2  -53.9  -0.3590  -0.7    1.8	GRS 1758-258
274.0934 -14.1616    6.6  40.8  -39.5   1.0725   1.7    9.1	GX 17+2
275.9899 -30.4773    2.5  25.5  -50.5   1.8576   4.5    7.4	H1820-303
285.1108 -24.7827    4.7  27.2  -28.5  -0.8514  -2.5    9.2	HT1900.1-2455
262.9202 -33.7147   15.7  30.1  -73.3   0.3510   0.7    8.0	GX 354-0
124.8133 -72.7018    3.5  56.9  179.2   8.8034   3.3 ------	UNKNOWN
277.3985 -23.8155    2.2  30.7  -41.3   2.2164   5.3 ------	UNKNOWN
271.6841 -27.7527    2.8  29.8  -54.1   1.8849   4.1 ------	UNKNOWN
274.4068 -17.7607    2.6  37.4  -41.3   2.3223   4.4 ------	UNKNOWN
255.1263 -41.6528    1.9  30.2  -93.4   3.4126   6.0 ------	UNKNOWN