Analysis Summary
Notes:
- 1) No attempt has been made to eliminate the non-significant decimal places.
- 2) This batgrbproduct analysis is done using the HEASARC data.
- 3) This batgrbproduct analysis is using the flight position for the mask-weighting calculation.
======================================================================
                  BAT GRB EVENT DATA PROCESSING REPORT
    Process Script Ver: batgrbproduct v2.46
    Process Start Time: Mon Jan 20 05:25:23 EST 2014
             Host Name: batevent1
   Current Working Dir: /local/data/batevent/batevent_reproc/trigger296856
======================================================================

  Trigger: 00296856      Segment: 000

  BAT Trigger Time: 217069040   [s; MET]
      Trigger Stop: 217069104   [s; MET]
               UTC: 2007-11-18T08:57:17.629920    [includes UTCF correction]
       Where From?: TDRSS position message

  BAT
    RA: 299.816804969612   Dec: 70.0928765899392  [deg; J2000]

     Catalogged Source?: NO
     Point Source?:      YES
     GRB Indicated?:     YES    [ by BAT flight software ]
     Image S/N Ratio:    7.67
     Image Trigger?:     YES
     Rate S/N Ratio:     0  [ if not an image trigger ]
     Image S/N Ratio:    7.67

  Analysis Position:   [ source = BAT ]
    RA: 299.816804969612   Dec: 70.0928765899392  [deg; J2000]

  Refined Position:   [ source = BAT pre-slew burst ]
    RA: 299.730727392354   Dec: 70.116876358528  [deg; J2000]
        { 19h 58m 55.4s , +70d 07' 00.8" }
         +/- 2.69209329314366 [arcmin] (estimated 90% radius based on SNR)
         +/- 1.23198111379773 [arcmin] (formal 1-sigma fit error)
    SNR: 7.39101260154212

  Angular difference between the analysis and refined position is 2.272107 arcmin

  Partial Coding Fraction: 1    [ including projection effects ]

  Duration
     T90: 105.59999999404 +/- 34.885401397567
        Measured from: -24.7599999904633
                   to: 80.8400000035763     [s; relative to TRIGTIME]
     T50: 43.4560000002384 +/- 23.7408946783719
        Measured from: 11.2080000042915
                   to: 54.66400000453     [s; relative to TRIGTIME]


  Fluence
     Peak Flux  (peak 1 second)
        Measured from: 80.2439999878407
                   to: 81.2439999878407     [s; relative to TRIGTIME]
     Total Fluence
        Measured from: -31.4799999892712
                   to: 87.4959999918938     [s; relative to TRIGTIME]

             Band 1     Band 2     Band 3     Band 4
              15-25      25-50     50-100    100-350     keV
 Total     0.270549   0.448023   0.313075  -0.000476
           0.055093   0.058524   0.055464   0.058477 [error]
 Peak      0.011207   0.009971   0.018463   0.002726
           0.004977   0.005270   0.005068   0.005341 [error]

     [ fluence units of on-axis counts / fully illuminated detector ]

======================================================================


====== Table of the duration information =============================

        Value   tstart    tstop
T100  118.976  -31.480   87.496
T90   105.600  -24.760   80.840
T50    43.456   11.208   54.664
Peak    1.000   80.244   81.244


====== Spectral Analysis Summary =====================================

Model      : spectral model: simple power-law (PL) and cutoff power-law (CPL)
Ph_index   : photon index: E^{Ph_index}
Ph_90err   : 90% error of the photon index
Epeak      : Epeak in keV
Epeak_90err: 90% error of Epeak
Norm       : normalization at 50 keV in both the PL model and CPL model
Nomr_90err : 90% error of the normalization
chi2       : Chi-Squared
dof        : degree of freedo

=== Time-averaged spectral analysis ===
(Best model with acceptable fit: PL)

Model Ph_index Ph_90err_low Ph_90err_hi  Epeak  Epeak_90err_low  Epeak_90err_hi  Norm       Nomr_90err_low    Norm_90err_hi    chi2    dof
PL      -1.526    -0.286      0.277       -           -               -         5.90e-04     -1.02e-04          9.98e-05      51.930   57
CPL     -1.136    -0.653      1.312       99.698     -99.698       -99.698      9.68e-04     -4.70e-04          4.11e-03      51.540   56


=== 1-s peak spectral analysis ===
(Best model with acceptable fit: N/A)

Model Ph_index Ph_90err_low Ph_90err_hi  Epeak  Epeak_90err_low  Epeak_90err_hi  Norm       Nomr_90err_low    Norm_90err_hi    chi2    dof
PL      -1.097     -0.773     0.839       -           -               -         2.73e-03     -1.02e-03          1.02e-03      81.550   57
CPL     -1.097     -0.773     0.850     9999.350    -9999.350      -9999.350      2.75e-03     -1.03e-03          2.67e-02      81.550   56


=== Fluence/Peak Flux Summary ===

              Model    Band1     Band2     Band3     Band4     Band5     Total
                       15-25     25-50    50-100    100-350    15-150    15-350    keV
Fluence         PL   9.19e-08  1.66e-07  2.31e-07  6.69e-07  6.64e-07  1.16e-06   erg/cm2
      90%_error_low -2.17e-08 -2.58e-08 -5.34e-08 -2.73e-07 -1.26e-07 -3.29e-07   erg/cm2
      90%_error_hi   2.27e-08  2.57e-08  5.39e-08  3.83e-07  1.30e-07  4.23e-07   erg/cm2
Peak flux       PL   7.66e-02  9.80e-02  9.16e-02  1.51e-01  3.17e-01  4.17e-01   ph/cm2/s
      90%_error_low -5.14e-02 -4.68e-02 -4.33e-02 -1.10e-01 -1.20e-01 -1.69e-01   ph/cm2/s
      90%_error_hi   6.60e-02  4.27e-02  4.09e-02  2.41e-01  1.20e-01  2.13e-01   ph/cm2/s

Fluence        CPL   8.80e-08  1.74e-07  2.31e-07  3.35e-07  6.33e-07  8.28e-07   erg/cm2
      90%_error_low -2.48e-08 -2.97e-08 -5.90e-08 -2.75e-07 -1.46e-07 -3.22e-07   erg/cm2
      90%_error_hi   2.49e-08  3.52e-08  5.73e-08  7.47e-07  1.51e-07  4.56e-07   erg/cm2
Peak flux      CPL   8.01e-02  9.82e-02  9.15e-02  1.70e-01  3.21e-01  4.38e-01   ph/cm2/s
      90%_error_low     N/A       N/A       N/A       N/A       N/A   -4.38e-01   ph/cm2/s
      90%_error_hi      N/A       N/A       N/A       N/A       N/A    2.12e-01   ph/cm2/s

======================================================================
Image
Pre-slew 15.0-350.0 keV image (Event data)
#   RAcent    DECcent   POSerr    Theta     Phi              Peak Cts       SNR   Name
  299.7307    70.1169   0.0259    16.3481  -170.1111         0.9707006      7.391 TRIG_00296856

Foreground time interval of the image:
-31.480  72.501 (delta_t = 103.981 [sec])
Background time interval of the image:
-289.299 -31.480 (delta_t = 257.819 [sec])
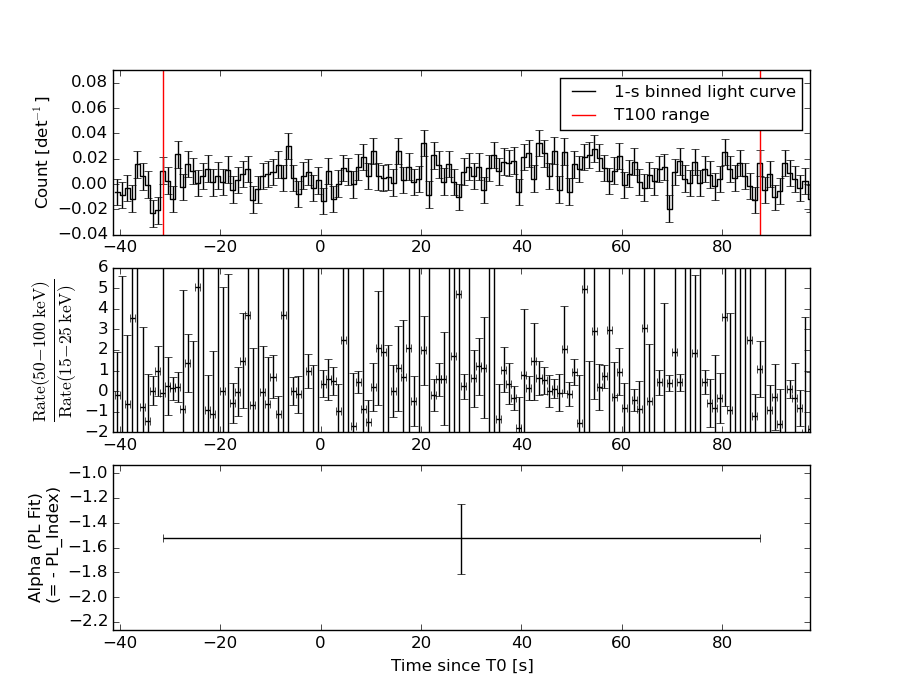
Light Curves
Note: The mask-weighted lightcurves have units of either count/det or counts/sec/det, where a det is 0.4 x 0.4 = 0.16 sq cm.
Full-time range; 1 s binning
Other quick-look light curves:
- 64 ms binning (zoomed)
- 16 ms binning (zoomed)
- 8 ms binning (zoomed)
- 2 ms binning (zoomed)
- SN=5 or 10 s binning (full-time range)
- Raw light curve
Spectra
- 64 ms binning (zoomed)
- 16 ms binning (zoomed)
- 8 ms binning (zoomed)
- 2 ms binning (zoomed)
- SN=5 or 10 s binning (full-time range)
- Raw light curve
Spectra
Notes:
- 1) The fitting includes the systematic errors.
- 2) When the burst includes telescope slew time periods, the fitting uses an average response file made from multiple 5-s response files through out the slew time plus single time preiod for the non-slew times, and weighted by the total counts in the corresponding time period using addrmf. An average response file is needed becuase a spectral fit using the pre-slew DRM will introduce some errors in both a spectral shape and a normalization if the PHA file contains a lot of the slew/post-slew time interval.
- 3) For fits to more complicated models (e.g. a power-law over a cutoff power-law), the BAT team has decided to require a chi-square improvement of more than 6 for each extra dof.
Time averaged spectrum fit using the average DRM
Power-law model
Time interval is from  -31.480 sec. to   87.496 sec.

Spectral model in power-law:
------------------------------------------------------------
Parameters  : value       lower 90%   higher 90%
Photon index: -1.52605     ( -0.28592   0.277229 )
Norm@50keV  : 5.90498E-04    ( -0.000102117   9.9809e-05 )
------------------------------------------------------------
#Fit statistic : Chi-Squared =          51.93 using 59 PHA bins.
# Reduced chi-squared =         0.9110 for     57 degrees of freedom
# Null hypothesis probability =   6.652910e-01

Photon flux (15-150 keV)    in 119 sec: 7.42478E-02 ( -0.0114355  0.0114361 ) ph/cm2/s
Energy fluence (15-150 keV)             : 6.63952e-07 ( -1.25625e-07  1.2995e-07 ) ergs/cm2
Cutoff power-law model
Time interval is from  -31.480 sec. to   87.496 sec.
Spectral model in the cutoff power-law:
------------------------------------------------------------
Parameters  : value       lower 90%   higher 90%
Photon index: -1.13556     ( -0.65292   1.3125 )
Epeak [keV] : 99.6980      ( -99.698 -99.698 )
Norm@50keV  : 9.67607E-04    ( -0.000470433   0.00410958 )
------------------------------------------------------------
#Fit statistic : Chi-Squared =          51.54 using 59 PHA bins.
# Reduced chi-squared =         0.9203 for     56 degrees of freedom
# Null hypothesis probability =   6.443289e-01

Photon flux (15-150 keV)    in 119 sec: 7.28866E-02 ( -0.0120141  0.0119894 ) ph/cm2/s
Energy fluence (15-150 keV)             : 6.32728e-07 ( -1.46491e-07  1.50805e-07 ) ergs/cm2
1-s peak spectrum fit
Power-law model
Time interval is from   80.244 sec. to   81.244 sec.

Spectral model in power-law:
------------------------------------------------------------
Parameters  : value       lower 90%   higher 90%
Photon index: -1.09718     ( -0.772616   0.839091 )
Norm@50keV  : 2.73322E-03    ( -0.00102393   0.00102322 )
------------------------------------------------------------
#Fit statistic : Chi-Squared =          81.55 using 59 PHA bins.
# Reduced chi-squared =          1.431 for     57 degrees of freedom
# Null hypothesis probability =   1.814085e-02

Photon flux (15-150 keV)    in 1 sec: 0.316948 ( -0.120044  0.120452 ) ph/cm2/s
Energy fluence (15-150 keV)             : 2.86055e-08 ( -1.24131e-08  1.30978e-08 ) ergs/cm2
Cutoff power-law model
Time interval is from   80.244 sec. to   81.244 sec.
Spectral model in the cutoff power-law:
------------------------------------------------------------
Parameters  : value       lower 90%   higher 90%
Photon index: -1.09675     ( -0.773332   0.850055 )
Epeak [keV] : 9999.35      ( -9999.36 -9999.36 )
Norm@50keV  : 2.74717E-03    ( -0.00103259   0.0266773 )
------------------------------------------------------------
#Fit statistic : Chi-Squared =          81.55 using 59 PHA bins.
# Reduced chi-squared =          1.456 for     56 degrees of freedom
# Null hypothesis probability =   1.452761e-02

Photon flux (15-150 keV)    in 1 sec: 0.321011 (    ) ph/cm2/s
Energy fluence (15-150 keV)             : 2.8774e-08 ( -1.41505e-08  1.437e-08 ) ergs/cm2
Time-resolved spectra
Distribution
T90 vs. Hardness ratio plot
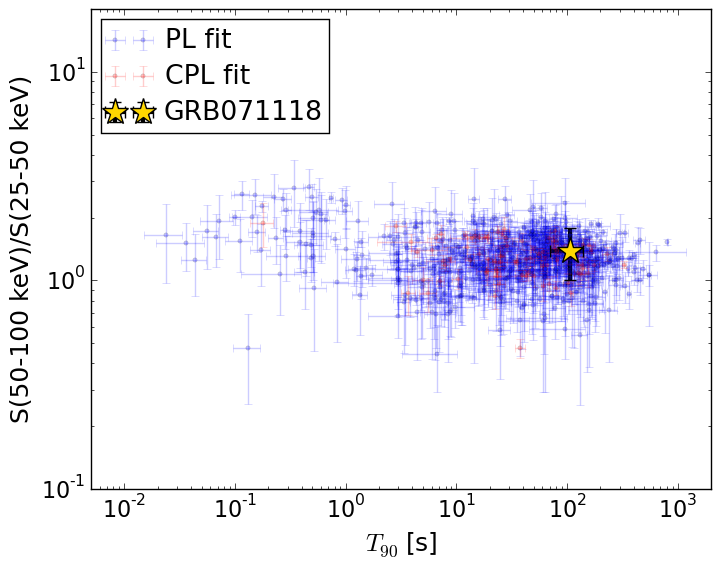
T90                                   = 105.6 sec.
Hardness ratio (energy fluence ratio) = 1.38896145445
S(15-50 keV) vs. S(50-150 keV) plot
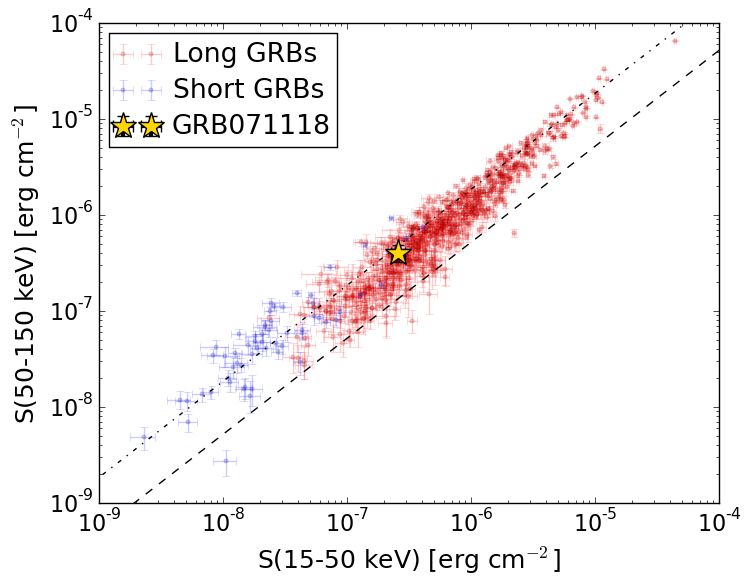
S(15-50 keV)  = 2.5823327e-07
S(50-150 keV) = 4.057274e-07
The dash-dotted line and the dashed line traces the fluences calculated from the Band function with Epeak = 15 and 150 keV, respectively. Both lines assume a canonical values of alpha = -1 and beta = -2.5.
Mask shadow pattern
IMX = -2.889730070590047E-01, IMY = 5.037623594092833E-02
Spacecraft aspect plot
Bright source in the pre-burst/pre-slew/post-slew images
Pre-burst image of 15-350 keV band
Time interval of the image:
-289.299400 -31.480000

# RAcent  DECcent POSerr Theta    Phi  PeakCts   SNR AngSep     Name
#  [deg]    [deg]    ['] [deg]  [deg]                   [']
299.6015  35.2028    0.7  51.0 -162.3   9.7052  17.7    0.6	Cyg X-1
308.1264  40.9559    3.2  45.8 -171.8   1.2533   3.6    0.8	Cyg X-3
326.0496  38.2613    5.2  49.8  169.9   1.3562   2.2    6.8	Cyg X-2
163.5384  59.3802    3.7  31.6  -16.1   0.7800   3.1 ------	UNKNOWN
298.2967  49.7487    3.4  36.5 -162.5   0.8635   3.4 ------	UNKNOWN
287.9850  28.4933    3.3  57.2 -149.7   4.2211   3.5 ------	UNKNOWN
Pre-slew background subtracted image of 15-350 keV band
Time interval of the image:
-31.480000 72.500590

# RAcent  DECcent POSerr Theta    Phi  PeakCts   SNR AngSep     Name
#  [deg]    [deg]    ['] [deg]  [deg]                   [']
299.6607  35.2912    3.2  51.0 -162.3  -1.0923  -3.7    6.4	Cyg X-1
307.9734  40.9295    6.5  45.8 -171.6   0.4074   1.8    6.4	Cyg X-3
326.3010  38.3265    4.5  49.7  169.7  -0.8830  -2.5    6.1	Cyg X-2
299.7307  70.1169    1.6  16.3 -170.1   0.9707   7.4 ------	UNKNOWN
Post-slew image of 15-350 keV band
Time interval of the image:
111.900600 963.050000

# RAcent  DECcent POSerr Theta    Phi  PeakCts   SNR AngSep     Name
#  [deg]    [deg]    ['] [deg]  [deg]                   [']
299.5878  35.1946    0.2  34.9 -151.2  36.8486  52.4    0.4	Cyg X-1
308.1257  40.9522    1.6  29.5 -164.4   4.0086   7.2    0.7	Cyg X-3
326.0835  38.3492    9.1  34.6  170.8   0.9742   1.3    4.5	Cyg X-2
321.6984  47.4263    4.2  25.0  171.9   1.6496   2.8 ------	UNKNOWN
325.2247  23.2753    2.8  49.2  177.1   5.7411   4.1 ------	UNKNOWN
308.0845  37.6223    1.5  32.8 -163.7   4.7791   7.8 ------	UNKNOWN
243.2569  55.9539    2.6  27.8  -62.5   3.0846   4.4 ------	UNKNOWN