Analysis Summary
Notes:
- 1) No attempt has been made to eliminate the non-significant decimal places.
- 2) This batgrbproduct analysis is done using the HEASARC data.
- 3) This batgrbproduct analysis is using the flight position for the mask-weighting calculation.
======================================================================
BAT GRB EVENT DATA PROCESSING REPORT
Process Script Ver: batgrbproduct v2.46
Process Start Time: Mon Jan 20 05:20:48 EST 2014
Host Name: batevent1
Current Working Dir: /local/data/batevent/batevent_reproc/trigger297114
======================================================================
Trigger: 00297114 Segment: 000
BAT Trigger Time: 217387408 [s; MET]
Trigger Stop: 217387472 [s; MET]
UTC: 2007-11-22T01:23:25.621540 [includes UTCF correction]
Where From?: TDRSS position message
BAT
RA: 276.58149464452 Dec: 47.063184122741 [deg; J2000]
Catalogged Source?: NO
Point Source?: YES
GRB Indicated?: YES [ by BAT flight software ]
Image S/N Ratio: 7.13
Image Trigger?: YES
Rate S/N Ratio: 0 [ if not an image trigger ]
Image S/N Ratio: 7.13
Analysis Position: [ source = BAT ]
RA: 276.58149464452 Dec: 47.063184122741 [deg; J2000]
Refined Position: [ source = BAT pre-slew burst ]
RA: 276.56960980633 Dec: 47.1044142651593 [deg; J2000]
{ 18h 26m 16.7s , +47d 06' 15.9" }
+/- 2.35717740298496 [arcmin] (estimated 90% radius based on SNR)
+/- 1.1941680639418 [arcmin] (formal 1-sigma fit error)
SNR: 8.93571737461226
Angular difference between the analysis and refined position is 2.521012 arcmin
Partial Coding Fraction: 0.6953125 [ including projection effects ]
Duration
T90: 71.4320000112057 +/- 13.9282791539919
Measured from: -22.5879999995232
to: 48.8440000116825 [s; relative to TRIGTIME]
T50: 35.5879999995232 +/- 14.1940811724705
Measured from: -7.47200000286102
to: 28.1159999966621 [s; relative to TRIGTIME]
Fluence
Peak Flux (peak 1 second)
Measured from: 2.99599999189377
to: 3.99599999189377 [s; relative to TRIGTIME]
Total Fluence
Measured from: -29.4120000004768
to: 55.6920000016689 [s; relative to TRIGTIME]
Band 1 Band 2 Band 3 Band 4
15-25 25-50 50-100 100-350 keV
Total 0.401253 0.293999 0.282138 0.022217
0.058751 0.060096 0.052350 0.045368 [error]
Peak 0.025319 0.010959 0.011065 0.001905
0.006515 0.006571 0.005607 0.004879 [error]
[ fluence units of on-axis counts / fully illuminated detector ]
======================================================================
====== Table of the duration information =============================
Value tstart tstop
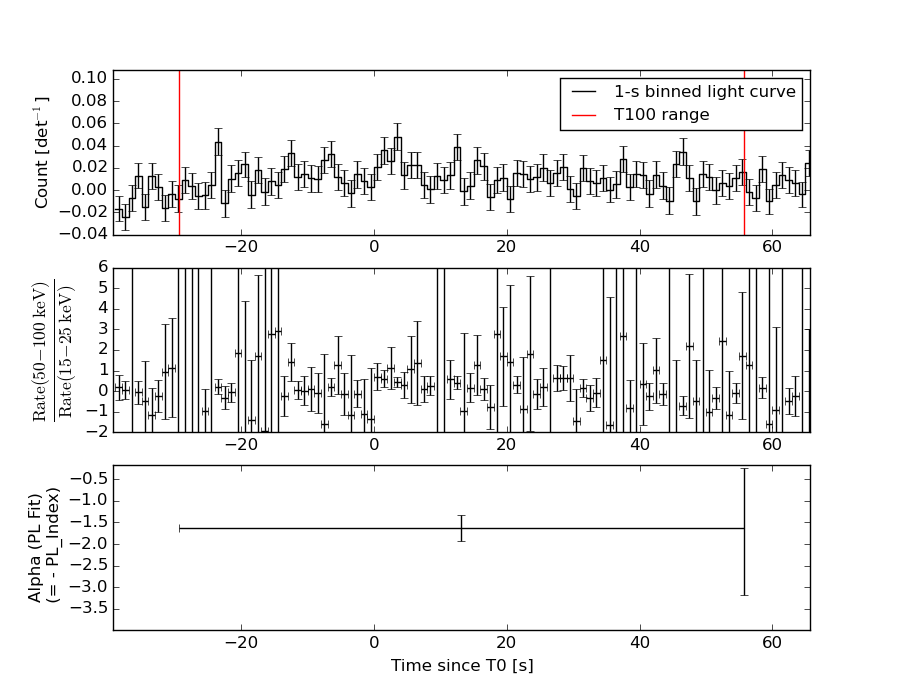
T100 85.104 -29.412 55.692
T90 71.432 -22.588 48.844
T50 35.588 -7.472 28.116
Peak 1.000 2.996 3.996
====== Spectral Analysis Summary =====================================
Model : spectral model: simple power-law (PL) and cutoff power-law (CPL)
Ph_index : photon index: E^{Ph_index}
Ph_90err : 90% error of the photon index
Epeak : Epeak in keV
Epeak_90err: 90% error of Epeak
Norm : normalization at 50 keV in both the PL model and CPL model
Nomr_90err : 90% error of the normalization
chi2 : Chi-Squared
dof : degree of freedo
=== Time-averaged spectral analysis ===
(Best model with acceptable fit: N/A)
Model Ph_index Ph_90err_low Ph_90err_hi Epeak Epeak_90err_low Epeak_90err_hi Norm Nomr_90err_low Norm_90err_hi chi2 dof
PL -1.622 -0.308 0.297 - - - 7.76e-04 -1.43e-04 1.40e-04 74.420 57
CPL -1.420 -0.500 1.229 138.857 -138.857 -138.857 9.91e-04 -9.91e-04 3.20e-03 74.310 56
=== 1-s peak spectral analysis ===
(Best model with acceptable fit: N/A)
Model Ph_index Ph_90err_low Ph_90err_hi Epeak Epeak_90err_low Epeak_90err_hi Norm Nomr_90err_low Norm_90err_hi chi2 dof
PL -2.300 -1.278 0.858 - - - 2.35e-03 -2.35e-03 1.50e-03 41.910 57
CPL -1.990 -0.020 5.028 3.396 N/A N/A 3.05e-03 N/A N/A 42.180 56
=== Fluence/Peak Flux Summary ===
Model Band1 Band2 Band3 Band4 Band5 Total
15-25 25-50 50-100 100-350 15-150 15-350 keV
Fluence PL 9.46e-08 1.61e-07 2.10e-07 5.51e-07 6.16e-07 1.02e-06 erg/cm2
90%_error_low -2.49e-08 -2.77e-08 -5.09e-08 -2.35e-07 -1.20e-07 -2.89e-07 erg/cm2
90%_error_hi 2.63e-08 2.75e-08 5.08e-08 3.29e-07 1.22e-07 3.63e-07 erg/cm2
Peak flux PL 2.10e-01 1.32e-01 5.37e-02 2.95e-02 4.11e-01 4.25e-01 ph/cm2/s
90%_error_low -1.06e-01 -6.50e-02 -4.18e-02 -2.95e-02 -1.59e-01 -1.69e-01 ph/cm2/s
90%_error_hi 1.09e-01 5.51e-02 5.14e-02 8.35e-02 1.59e-01 1.71e-01 ph/cm2/s
Fluence CPL 9.20e-08 1.65e-07 2.12e-07 3.97e-07 6.07e-07 8.66e-07 erg/cm2
90%_error_low -2.89e-08 -3.10e-08 -5.27e-08 -3.12e-07 -1.29e-07 -3.49e-07 erg/cm2
90%_error_hi 2.68e-08 3.51e-08 5.46e-08 2.17e-07 1.28e-07 2.53e-07 erg/cm2
Peak flux CPL 1.95e-01 7.48e-02 1.75e-02 5.96e-03 2.91e-01 2.93e-01 ph/cm2/s
90%_error_low -1.12e-01 -7.48e-02 N/A -5.96e-03 N/A N/A ph/cm2/s
90%_error_hi 1.12e-01 1.05e-01 N/A 4.83e-02 N/A N/A ph/cm2/s
======================================================================
Image
Pre-slew 15.0-350.0 keV image (Event data)

#   RAcent    DECcent   POSerr    Theta     Phi              Peak Cts       SNR   Name
  276.5696    47.1044   0.0215    31.7026     8.6013         1.1692195      8.936 TRIG_00297114

Foreground time interval of the image:
-29.412  55.692 (delta_t =  85.104 [sec])
Background time interval of the image:
-239.000 -29.412 (delta_t = 209.588 [sec])
Light Curves
Note: The mask-weighted lightcurves have units of either count/det or counts/sec/det, where a det is 0.4 x 0.4 = 0.16 sq cm.
Full-time range; 1 s binning
Other quick-look light curves:
- 64 ms binning (zoomed)
- 16 ms binning (zoomed)
- 8 ms binning (zoomed)
- 2 ms binning (zoomed)
- SN=5 or 10 s binning (full-time range)
- Raw light curve
Spectra
- 64 ms binning (zoomed)
- 16 ms binning (zoomed)
- 8 ms binning (zoomed)
- 2 ms binning (zoomed)
- SN=5 or 10 s binning (full-time range)
- Raw light curve
Spectra
Notes:
- 1) The fitting includes the systematic errors.
- 2) When the burst includes telescope slew time periods, the fitting uses an average response file made from multiple 5-s response files through out the slew time plus single time preiod for the non-slew times, and weighted by the total counts in the corresponding time period using addrmf. An average response file is needed becuase a spectral fit using the pre-slew DRM will introduce some errors in both a spectral shape and a normalization if the PHA file contains a lot of the slew/post-slew time interval.
- 3) For fits to more complicated models (e.g. a power-law over a cutoff power-law), the BAT team has decided to require a chi-square improvement of more than 6 for each extra dof.
Time averaged spectrum fit using the average DRM
Power-law model

Time interval is from  -29.412 sec. to   55.692 sec.

Spectral model in power-law:
------------------------------------------------------------
Parameters  : value       lower 90%   higher 90%
Photon index: -1.62212     ( -0.308146   0.297102 )
Norm@50keV  : 7.76377E-04    ( -0.000142727   0.000139601 )
------------------------------------------------------------
#Fit statistic : Chi-Squared =          74.42 using 59 PHA bins.
# Reduced chi-squared =          1.306 for     57 degrees of freedom
# Null hypothesis probability =   6.045512e-02

Photon flux (15-150 keV)    in 85.1 sec: 0.100467 ( -0.0171172  0.017143 ) ph/cm2/s
Energy fluence (15-150 keV)             : 6.16382e-07 ( -1.19675e-07  1.2193e-07 ) ergs/cm2
Cutoff power-law model

Time interval is from  -29.412 sec. to   55.692 sec.
Spectral model in the cutoff power-law:
------------------------------------------------------------
Parameters  : value       lower 90%   higher 90%
Photon index: -1.42012     ( -0.500188   1.22892 )
Epeak [keV] : 138.857      ( -138.837 -138.837 )
Norm@50keV  : 9.90803E-04    ( -0.00099085   0.00320361 )
------------------------------------------------------------
#Fit statistic : Chi-Squared =          74.31 using 59 PHA bins.
# Reduced chi-squared =          1.327 for     56 degrees of freedom
# Null hypothesis probability =   5.130064e-02

Photon flux (15-150 keV)    in 85.1 sec: 9.96953E-02 ( -0.0175948  0.0175277 ) ph/cm2/s
Energy fluence (15-150 keV)             : 6.06903e-07 ( -1.28802e-07  1.28371e-07 ) ergs/cm2
1-s peak spectrum fit
Power-law model

Time interval is from    2.996 sec. to    3.996 sec.

Spectral model in power-law:
------------------------------------------------------------
Parameters  : value       lower 90%   higher 90%
Photon index: -2.30029     ( -1.2781   0.85848 )
Norm@50keV  : 2.35046E-03    ( -0.00235018   0.00149808 )
------------------------------------------------------------
#Fit statistic : Chi-Squared =          41.91 using 59 PHA bins.
# Reduced chi-squared =         0.7353 for     57 degrees of freedom
# Null hypothesis probability =   9.328582e-01

Photon flux (15-150 keV)    in 1 sec: 0.410871 ( -0.15897  0.158878 ) ph/cm2/s
Energy fluence (15-150 keV)             : 2.24657e-08 ( -1.13849e-08  1.29822e-08 ) ergs/cm2
Cutoff power-law model

Time interval is from    2.996 sec. to    3.996 sec.
Spectral model in the cutoff power-law:
------------------------------------------------------------
Parameters  : value       lower 90%   higher 90%
Photon index: -2.86113     ( -0.019735   5.02802 )
Epeak [keV] : 277.565      (   )
Norm@50keV  : 1.18843E-03    (     )
------------------------------------------------------------
#Fit statistic : Chi-Squared =          41.32 using 59 PHA bins.
# Reduced chi-squared =         0.7378 for     56 degrees of freedom
# Null hypothesis probability =   9.288152e-01

Photon flux (15-150 keV)    in 1 sec: 0.290645 (    ) ph/cm2/s
Energy fluence (15-150 keV)             : 0 ( 0  0 ) ergs/cm2
Time-resolved spectra
Distribution
T90 vs. Hardness ratio plot

T90                                   = N/A sec.
Hardness ratio (energy fluence ratio) = N/A
S(15-50 keV) vs. S(50-150 keV) plot

S(15-50 keV)  = N/A
S(50-150 keV) = N/A
The dash-dotted line and the dashed line traces the fluences calculated from the Band function with Epeak = 15 and 150 keV, respectively. Both lines assume a canonical values of alpha = -1 and beta = -2.5.
Mask shadow pattern

IMX = 6.107290638466494E-01, IMY = -9.237778843154515E-02
Spacecraft aspect plot

Bright source in the pre-burst/pre-slew/post-slew images
Pre-burst image of 15-350 keV band
Time interval of the image:
-239.000000 -29.412000

# RAcent  DECcent POSerr Theta    Phi  PeakCts   SNR AngSep     Name
#  [deg]    [deg]    ['] [deg]  [deg]                   [']
254.4343  35.3363    5.1  41.1  -22.1   0.6089   2.3    1.2	Her X-1
268.2106  -1.4381    5.8  37.2  -85.6   1.2414   2.0    9.5	SW J1753.5-0127
289.0081  10.9282  118.4  13.5  -98.2   0.0168   0.1   12.4	GRS 1915+105
299.5897  35.2089    0.2  14.4   41.0   8.6110  49.6    0.4	Cyg X-1
308.1183  40.9532    1.4  21.6   57.5   1.7786   8.4    0.4	Cyg X-3
326.1564  38.2976   11.2  29.4   85.3   0.3250   1.0    1.6	Cyg X-2
272.2755  40.0772    2.1  29.5   -5.9   1.0891   5.4 ------	UNKNOWN
237.2281  37.2250    4.2  55.1  -20.8   1.6251   2.7 ------	UNKNOWN
270.9032  -9.8290    4.0  41.0  -98.2   3.0913   2.9 ------	UNKNOWN
Pre-slew background subtracted image of 15-350 keV band
Time interval of the image:
-29.412000 55.692000

# RAcent  DECcent POSerr Theta    Phi  PeakCts   SNR AngSep     Name
#  [deg]    [deg]    ['] [deg]  [deg]                   [']
254.6453  35.3765   11.2  41.0  -22.0  -0.1681  -1.0    9.4	Her X-1
268.5130  -1.4534    3.2  36.9  -85.9  -0.9260  -3.6    8.7	SW J1753.5-0127
288.9318  10.8652   17.0  13.6  -98.1   0.0707   0.7    9.2	GRS 1915+105
299.6473  35.3812    3.2  14.5   41.1  -0.4064  -3.6   11.1	Cyg X-1
308.2679  41.0391   14.0  21.8   57.7   0.1071   0.8    8.8	Cyg X-3
326.1047  38.2495    6.7  29.4   85.3  -0.3166  -1.7    5.4	Cyg X-2
276.5694  47.1043    1.3  31.7    8.6   1.1594   8.9 ------	UNKNOWN
318.8791 -21.8620    2.1  47.1 -168.4   1.0257   5.5 ------	UNKNOWN
Post-slew image of 15-350 keV band
Time interval of the image:
126.500600 963.070000

# RAcent  DECcent POSerr Theta    Phi  PeakCts   SNR AngSep     Name
#  [deg]    [deg]    ['] [deg]  [deg]                   [']
254.4598  35.5046   11.7  20.1  -64.9   0.5736   1.0    9.7	Her X-1
288.9486  10.9937    7.6  37.6 -148.0  -1.1181  -1.5    9.3	GRS 1915+105
299.5978  35.2062    0.2  20.9  168.5  34.1714  70.6    0.5	Cyg X-1
308.1256  41.0125    1.1  23.3  145.6   5.6041  10.1    3.7	Cyg X-3
326.0687  38.1968    3.9  36.8  137.7   2.8088   2.9    8.9	Cyg X-2
308.1064  37.6548    1.5  24.9  152.8   4.4089   7.9 ------	UNKNOWN
307.7713  -3.5061    2.9  57.5 -165.6  10.0210   4.0 ------	UNKNOWN