Analysis Summary
Notes:
- 1) No attempt has been made to eliminate the non-significant decimal places.
- 2) This batgrbproduct analysis is done using the HEASARC data.
- 3) This batgrbproduct analysis is using the flight position for the mask-weighting calculation.
======================================================================
BAT GRB EVENT DATA PROCESSING REPORT
Process Script Ver: batgrbproduct v2.46
Process Start Time: Mon Jan 20 05:16:06 EST 2014
Host Name: batevent1
Current Working Dir: /local/data/batevent/batevent_reproc/trigger297628
======================================================================
Trigger: 00297628 Segment: 000
BAT Trigger Time: 217987437.696 [s; MET]
Trigger Stop: 217987441.792 [s; MET]
UTC: 2007-11-29T00:03:55.301720 [includes UTCF correction]
Where From?: TDRSS position message
BAT
RA: 220.089670547025 Dec: -26.6590902014323 [deg; J2000]
Catalogged Source?: NO
Point Source?: YES
GRB Indicated?: YES [ by BAT flight software ]
Image S/N Ratio: 11.85
Image Trigger?: NO
Rate S/N Ratio: 11.5325625946708 [ if not an image trigger ]
Image S/N Ratio: 11.85
Analysis Position: [ source = BAT ]
RA: 220.089670547025 Dec: -26.6590902014323 [deg; J2000]
Refined Position: [ source = BAT pre-slew burst ]
RA: 220.048957876435 Dec: -26.6699762684598 [deg; J2000]
{ 14h 40m 11.7s , -26d 40' 11.9" }
+/- 2.06367015489598 [arcmin] (estimated 90% radius based on SNR)
+/- 1.06871041757118 [arcmin] (formal 1-sigma fit error)
SNR: 10.8051863397994
Angular difference between the analysis and refined position is 2.278593 arcmin
Partial Coding Fraction: 0.5546875 [ including projection effects ]
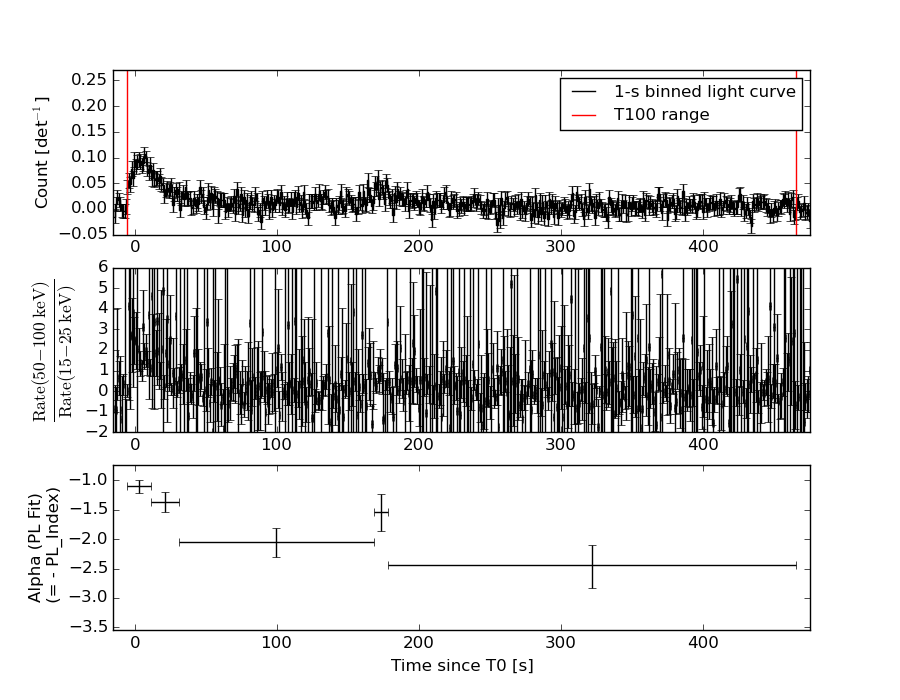
Duration
T90: 408.080000013113 +/- 52.3240852031849
Measured from: -0.412000000476837
to: 407.668000012636 [s; relative to TRIGTIME]
T50: 186.136000007391 +/- 23.5661112465353
Measured from: 15.6359999775887
to: 201.77199998498 [s; relative to TRIGTIME]
Fluence
Peak Flux (peak 1 second)
Measured from: 5.82799997925758
to: 6.82799997925758 [s; relative to TRIGTIME]
Total Fluence
Measured from: -5.64000001549721
to: 465.079999983311 [s; relative to TRIGTIME]
Band 1 Band 2 Band 3 Band 4
15-25 25-50 50-100 100-350 keV
Total 2.227064 2.595751 1.522351 0.171889
0.151452 0.156152 0.139981 0.133959 [error]
Peak 0.031898 0.026211 0.049538 0.013780
0.007360 0.007821 0.007235 0.006424 [error]
[ fluence units of on-axis counts / fully illuminated detector ]
======================================================================
====== Table of the duration information =============================
Value tstart tstop
T100 470.720 -5.640 465.080
T90 408.080 -0.412 407.668
T50 186.136 15.636 201.772
Peak 1.000 5.828 6.828
====== Spectral Analysis Summary =====================================
Model : spectral model: simple power-law (PL) and cutoff power-law (CPL)
Ph_index : photon index: E^{Ph_index}
Ph_90err : 90% error of the photon index
Epeak : Epeak in keV
Epeak_90err: 90% error of Epeak
Norm : normalization at 50 keV in both the PL model and CPL model
Nomr_90err : 90% error of the normalization
chi2 : Chi-Squared
dof : degree of freedo
=== Time-averaged spectral analysis ===
(Best model with acceptable fit: PL)
Model Ph_index Ph_90err_low Ph_90err_hi Epeak Epeak_90err_low Epeak_90err_hi Norm Nomr_90err_low Norm_90err_hi chi2 dof
PL -1.860 -0.139 0.135 - - - 8.48e-04 -7.22e-05 7.11e-05 60.190 57
CPL -1.473 -0.473 0.588 59.318 -14.483 -59.318 1.40e-03 -5.93e-04 1.55e-03 58.580 56
=== 1-s peak spectral analysis ===
(Best model with acceptable fit: PL)
Model Ph_index Ph_90err_low Ph_90err_hi Epeak Epeak_90err_low Epeak_90err_hi Norm Nomr_90err_low Norm_90err_hi chi2 dof
PL -1.267 -0.364 0.364 - - - 7.80e-03 -1.53e-03 1.53e-03 65.150 57
CPL -1.122 -2.424 1.620 334.761 -334.761 -334.761 9.10e-03 -2.81e-03 3.45e-02 65.200 56
=== Fluence/Peak Flux Summary ===
Model Band1 Band2 Band3 Band4 Band5 Total
15-25 25-50 50-100 100-350 15-150 15-350 keV
Fluence PL 7.16e-07 1.06e-06 1.16e-06 2.41e-06 3.67e-06 5.35e-06 erg/cm2
90%_error_low -7.77e-08 -7.53e-08 -1.36e-07 -5.30e-07 -3.10e-07 -6.73e-07 erg/cm2
90%_error_hi 7.97e-08 7.54e-08 1.37e-07 6.25e-07 3.15e-07 7.47e-07 erg/cm2
Peak flux PL 2.57e-01 2.97e-01 2.47e-01 3.45e-01 9.25e-01 1.15e+00 ph/cm2/s
90%_error_low -9.07e-02 -6.78e-02 -5.99e-02 -1.50e-01 -1.85e-01 -2.35e-01 ph/cm2/s
90%_error_hi 1.02e-01 6.56e-02 5.81e-02 2.10e-01 1.85e-01 2.43e-01 ph/cm2/s
Fluence CPL 6.86e-07 1.10e-06 1.15e-06 1.23e-06 3.52e-06 4.17e-06 erg/cm2
90%_error_low -8.82e-08 -9.70e-08 -1.49e-07 -6.98e-07 -3.66e-07 -8.08e-07 erg/cm2
90%_error_hi 8.88e-08 9.96e-08 1.46e-07 1.38e-06 3.74e-07 1.47e-06 erg/cm2
Peak flux CPL 2.61e-01 2.97e-01 2.46e-01 3.49e-01 9.26e-01 1.15e+00 ph/cm2/s
90%_error_low -1.30e-01 -6.74e-02 -5.88e-02 N/A -1.96e-01 -3.64e-01 ph/cm2/s
90%_error_hi 9.74e-02 7.36e-02 7.09e-02 N/A 1.84e-01 2.20e-01 ph/cm2/s
======================================================================
Image
Pre-slew 15.0-350.0 keV image (Event data)
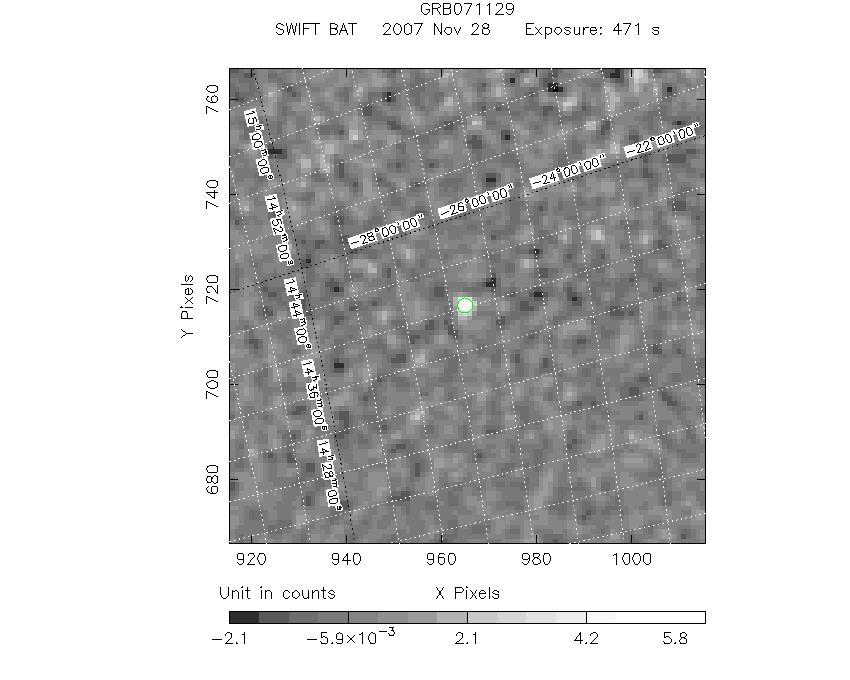
#   RAcent    DECcent   POSerr    Theta     Phi              Peak Cts       SNR   Name
  220.0490   -26.6700   0.0178    28.1558  -109.5893         6.6201649     10.805 TRIG_00297628

Foreground time interval of the image:
 -5.640 465.080 (delta_t = 470.720 [sec])
Background time interval of the image:
-139.995  -5.640 (delta_t = 134.355 [sec])
Light Curves
Note: The mask-weighted lightcurves have units of either count/det or counts/sec/det, where a det is 0.4 x 0.4 = 0.16 sq cm.
Full-time range; 1 s binning
Other quick-look light curves:
- 64 ms binning (zoomed)
- 16 ms binning (zoomed)
- 8 ms binning (zoomed)
- 2 ms binning (zoomed)
- SN=5 or 10 s binning (full-time range)
- Raw light curve
Spectra
- 64 ms binning (zoomed)
- 16 ms binning (zoomed)
- 8 ms binning (zoomed)
- 2 ms binning (zoomed)
- SN=5 or 10 s binning (full-time range)
- Raw light curve
Spectra
Notes:
- 1) The fitting includes the systematic errors.
- 2) When the burst includes telescope slew time periods, the fitting uses an average response file made from multiple 5-s response files through out the slew time plus single time preiod for the non-slew times, and weighted by the total counts in the corresponding time period using addrmf. An average response file is needed becuase a spectral fit using the pre-slew DRM will introduce some errors in both a spectral shape and a normalization if the PHA file contains a lot of the slew/post-slew time interval.
- 3) For fits to more complicated models (e.g. a power-law over a cutoff power-law), the BAT team has decided to require a chi-square improvement of more than 6 for each extra dof.
Time averaged spectrum fit using the average DRM
Power-law model
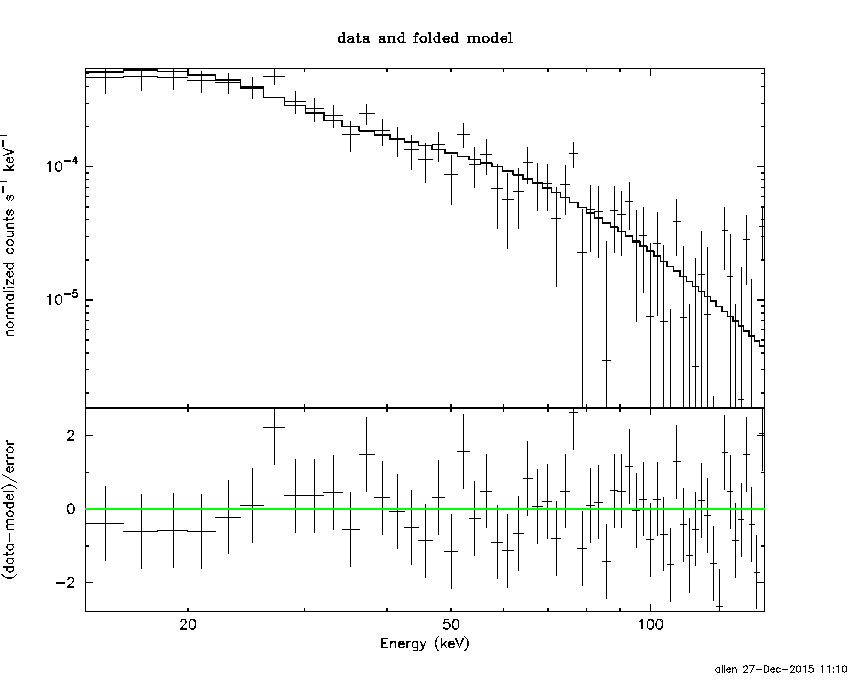
Time interval is from   -5.640 sec. to  465.080 sec.

Spectral model in power-law:
------------------------------------------------------------
Parameters  : value       lower 90%   higher 90%
Photon index: -1.8599     ( -0.138648   0.134976 )
Norm@50keV  : 8.48462E-04    ( -7.21817e-05   7.11485e-05 )
------------------------------------------------------------
#Fit statistic : Chi-Squared =          60.19 using 59 PHA bins.
# Reduced chi-squared =          1.056 for     57 degrees of freedom
# Null hypothesis probability =   3.610211e-01

Photon flux (15-150 keV)    in 470.7 sec: 0.119750 ( -0.008637  0.008643 ) ph/cm2/s
Energy fluence (15-150 keV)             : 3.67235e-06 ( -3.09912e-07  3.1454e-07 ) ergs/cm2
Cutoff power-law model
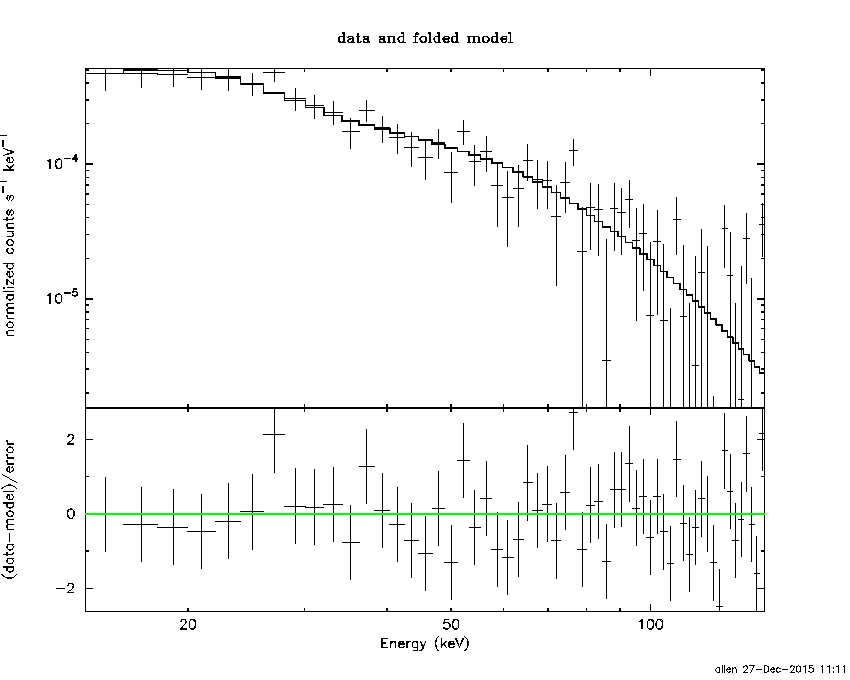
Time interval is from   -5.640 sec. to  465.080 sec.
Spectral model in the cutoff power-law:
------------------------------------------------------------
Parameters  : value       lower 90%   higher 90%
Photon index: -1.47316     ( -0.473137   0.587533 )
Epeak [keV] : 59.3183      ( -14.4825 -59.3183 )
Norm@50keV  : 1.39502E-03    ( -0.000592837   0.00155217 )
------------------------------------------------------------
#Fit statistic : Chi-Squared =          58.58 using 59 PHA bins.
# Reduced chi-squared =          1.046 for     56 degrees of freedom
# Null hypothesis probability =   3.811383e-01

Photon flux (15-150 keV)    in 470.7 sec: 0.117434 ( -0.009159  0.009156 ) ph/cm2/s
Energy fluence (15-150 keV)             : 3.5158e-06 ( -3.66281e-07  3.73973e-07 ) ergs/cm2
1-s peak spectrum fit
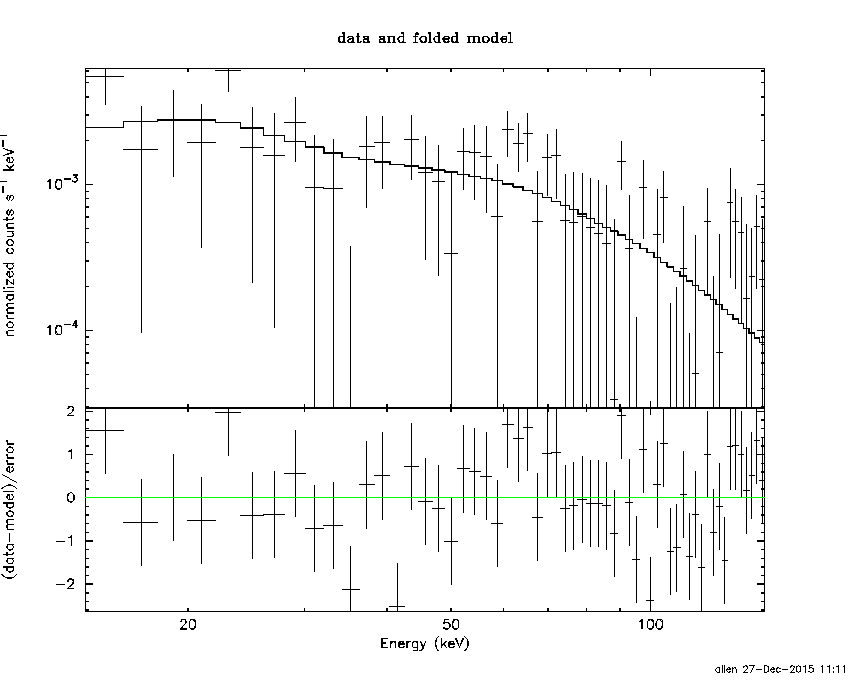
Power-law model

Time interval is from    5.828 sec. to    6.828 sec.

Spectral model in power-law:
------------------------------------------------------------
Parameters  : value       lower 90%   higher 90%
Photon index: -1.26709     ( -0.363537   0.364407 )
Norm@50keV  : 7.79913E-03    ( -0.00153072   0.00152747 )
------------------------------------------------------------
#Fit statistic : Chi-Squared =          65.15 using 59 PHA bins.
# Reduced chi-squared =          1.143 for     57 degrees of freedom
# Null hypothesis probability =   2.142794e-01

Photon flux (15-150 keV)    in 1 sec: 0.925058 ( -0.184654  0.185242 ) ph/cm2/s
Energy fluence (15-150 keV)             : 7.77159e-08 ( -1.72208e-08  1.74738e-08 ) ergs/cm2
Cutoff power-law model
Time interval is from    5.828 sec. to    6.828 sec.
Spectral model in the cutoff power-law:
------------------------------------------------------------
Parameters  : value       lower 90%   higher 90%
Photon index: -1.26288     ( -2.40989   1.63331 )
Epeak [keV] : 9996.89      ( -9997.37 -9997.37 )
Norm@50keV  : 7.83364E-03    ( -0.00153989   0.0357947 )
------------------------------------------------------------
#Fit statistic : Chi-Squared =          65.15 using 59 PHA bins.
# Reduced chi-squared =          1.163 for     56 degrees of freedom
# Null hypothesis probability =   1.883474e-01

Photon flux (15-150 keV)    in 1 sec: 0.926099 ( -0.195795  0.184491 ) ph/cm2/s
Energy fluence (15-150 keV)             : 7.76945e-08 ( 0  0 ) ergs/cm2
Time-resolved spectra
Distribution
T90 vs. Hardness ratio plot
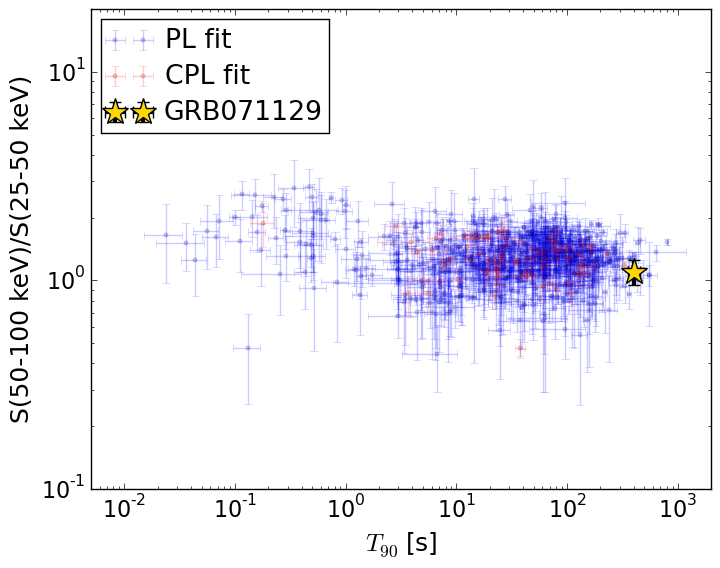
T90                                   = 408.08 sec.
Hardness ratio (energy fluence ratio) = 1.1020212325
S(15-50 keV) vs. S(50-150 keV) plot
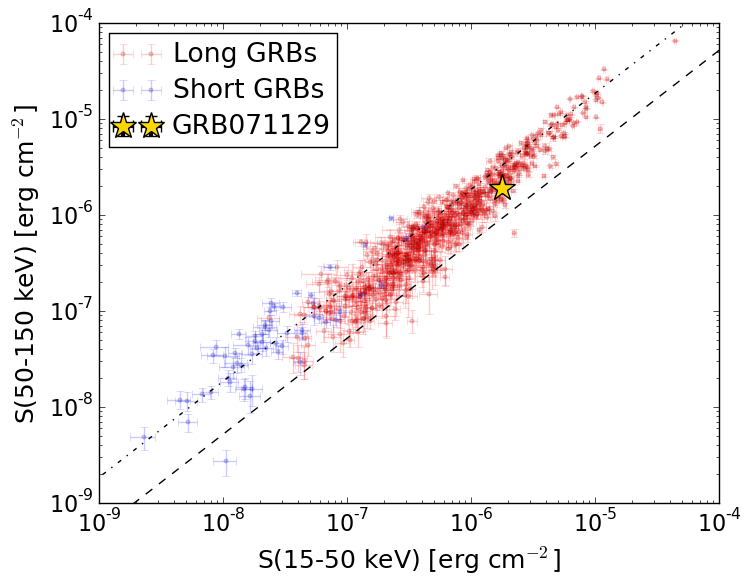
S(15-50 keV)  = 1.772371e-06
S(50-150 keV) = 1.8999547e-06
The dash-dotted line and the dashed line traces the fluences calculated from the Band function with Epeak = 15 and 150 keV, respectively. Both lines assume a canonical values of alpha = -1 and beta = -2.5.
Mask shadow pattern
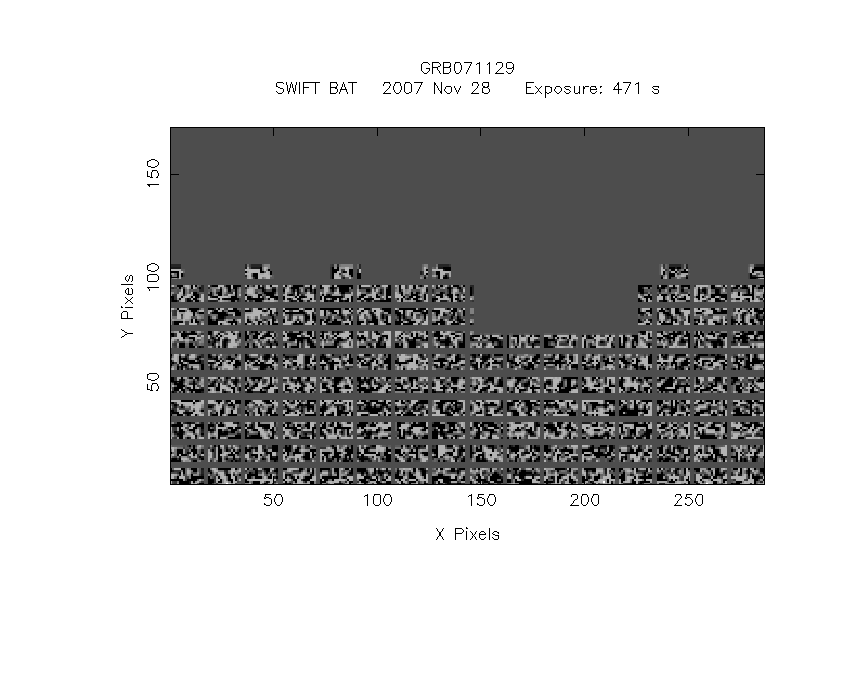
IMX = -1.794401902565495E-01, IMY = 5.042252352474009E-01
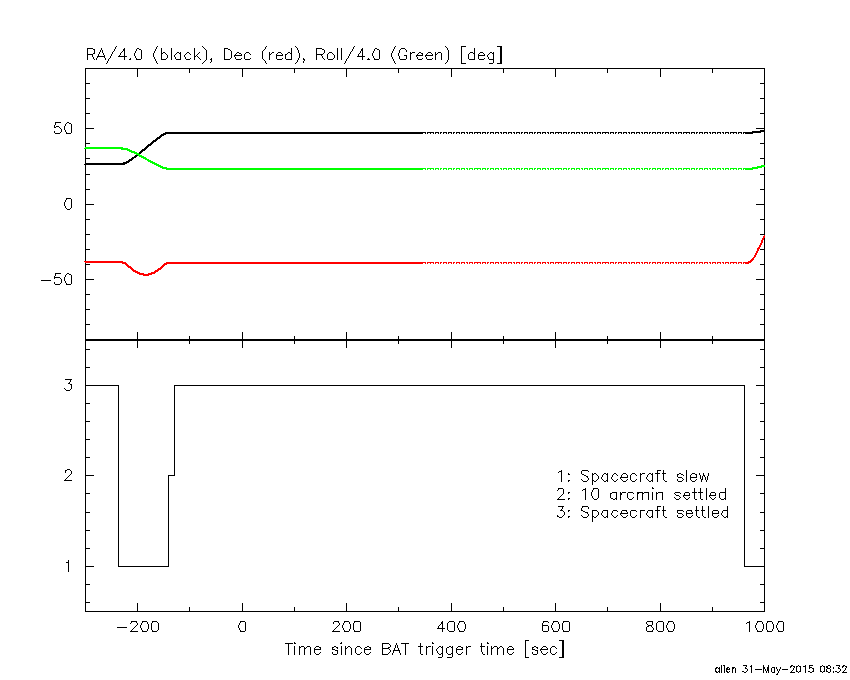
Spacecraft aspect plot
Bright source in the pre-burst/pre-slew/post-slew images
Pre-burst image of 15-350 keV band
Time interval of the image:
-139.995400 -5.640000

# RAcent  DECcent POSerr Theta    Phi  PeakCts   SNR AngSep     Name
#  [deg]    [deg]    ['] [deg]  [deg]                   [']
170.0655 -60.6670    5.2  25.1   19.3  -0.3143  -2.2    7.8	Cen X-3
186.7774 -62.7539    1.9  24.1   -0.2   0.8619   6.0    3.5	GX 301-2
174.7389   6.0794    2.1  46.9  156.2   1.8194   5.4 ------	UNKNOWN
152.4209 -58.3187    1.8  30.8   34.9   1.2001   6.3 ------	UNKNOWN
213.6382  16.2495    3.3  59.4 -156.3   3.5860   3.4 ------	UNKNOWN
Pre-slew background subtracted image of 15-350 keV band
Time interval of the image:
-5.640000 465.080000

# RAcent  DECcent POSerr Theta    Phi  PeakCts   SNR AngSep     Name
#  [deg]    [deg]    ['] [deg]  [deg]                   [']
170.0382 -60.5985    5.6  25.0   19.4   1.0580   2.0    8.3	Cen X-3
186.3672 -62.7208    5.2  24.1    0.2   1.1198   2.2    8.5	GX 301-2
320.0690 -80.4188    2.7  57.8  -12.0  12.0988   4.3 ------	UNKNOWN
220.0490 -26.6700    1.1  28.2 -109.6   6.6183  10.8 ------	UNKNOWN
257.1073 -52.8438    2.1  47.3  -52.8  11.7422   5.6 ------	UNKNOWN
237.7093 -28.2462    2.4  41.0  -93.3   8.6913   4.8 ------	UNKNOWN
Post-slew image of 15-350 keV band
Time interval of the image: