Analysis Summary
Notes:
- 1) No attempt has been made to eliminate the non-significant decimal places.
- 2) This batgrbproduct analysis is done using the HEASARC data.
- 3) This batgrbproduct analysis is using the flight position for the mask-weighting calculation.
======================================================================
BAT GRB EVENT DATA PROCESSING REPORT
Process Script Ver: batgrbproduct v2.46
Process Start Time: Mon Jan 20 05:11:42 EST 2014
Host Name: batevent1
Current Working Dir: /local/data/batevent/batevent_reproc/trigger299787
======================================================================
Trigger: 00299787 Segment: 000
BAT Trigger Time: 220479229.504 [s; MET]
Trigger Stop: 220479230.528 [s; MET]
UTC: 2007-12-27T20:13:47.043260 [includes UTCF correction]
Where From?: TDRSS position message
BAT
RA: 58.1198112281124 Dec: -55.9526448765147 [deg; J2000]
Catalogged Source?: NO
Point Source?: YES
GRB Indicated?: YES [ by BAT flight software ]
Image S/N Ratio: 8.54
Image Trigger?: NO
Rate S/N Ratio: 37.8549864614954 [ if not an image trigger ]
Image S/N Ratio: 8.54
Analysis Position: [ source = BAT ]
RA: 58.1198112281124 Dec: -55.9526448765147 [deg; J2000]
Refined Position: [ source = BAT pre-slew burst ]
RA: 58.1172025366673 Dec: -55.9367668281692 [deg; J2000]
{ 03h 52m 28.1s , -55d 56' 12.4" }
+/- 2.50386102313717 [arcmin] (estimated 90% radius based on SNR)
+/- 1.46768212690744 [arcmin] (formal 1-sigma fit error)
SNR: 8.19738266487804
Angular difference between the analysis and refined position is 0.956707 arcmin
Partial Coding Fraction: 0.4804688 [ including projection effects ]
Duration
T90: 142.480000019073 +/- 48.3692418348664
Measured from: 0.0639999806880951
to: 142.543999999762 [s; relative to TRIGTIME]
T50: 76.0879999995232 +/- 29.0811282443047
Measured from: 1.06000000238419
to: 77.1480000019073 [s; relative to TRIGTIME]
Fluence
Peak Flux (peak 1 second)
Measured from: -0.0999999940395355
to: 0.900000005960464 [s; relative to TRIGTIME]
Total Fluence
Measured from: -0.143999993801117
to: 150.551999986172 [s; relative to TRIGTIME]
Band 1 Band 2 Band 3 Band 4
15-25 25-50 50-100 100-350 keV
Total 0.383434 0.393825 0.140048 0.176553
0.065006 0.067416 0.059104 0.051044 [error]
Peak 0.045265 0.071889 0.068048 0.034503
0.007711 0.009178 0.008787 0.007965 [error]
[ fluence units of on-axis counts / fully illuminated detector ]
======================================================================
====== Table of the duration information =============================
Value tstart tstop
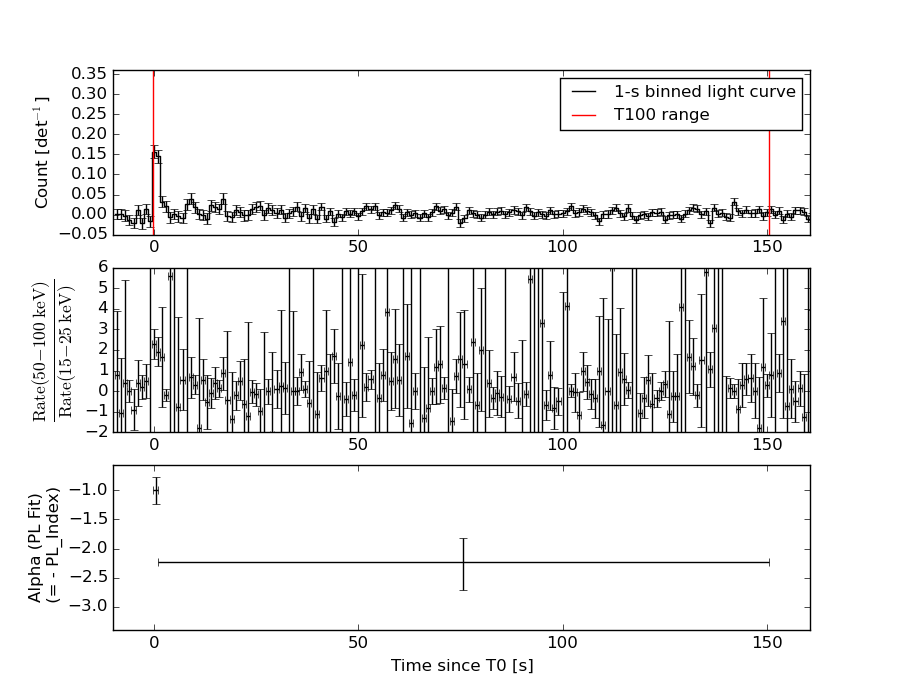
T100 150.696 -0.144 150.552
T90 142.480 0.064 142.544
T50 76.088 1.060 77.148
Peak 1.000 -0.100 0.900
====== Spectral Analysis Summary =====================================
Model : spectral model: simple power-law (PL) and cutoff power-law (CPL)
Ph_index : photon index: E^{Ph_index}
Ph_90err : 90% error of the photon index
Epeak : Epeak in keV
Epeak_90err: 90% error of Epeak
Norm : normalization at 50 keV in both the PL model and CPL model
Nomr_90err : 90% error of the normalization
chi2 : Chi-Squared
dof : degree of freedo
=== Time-averaged spectral analysis ===
(Best model with acceptable fit: PL)
Model Ph_index Ph_90err_low Ph_90err_hi Epeak Epeak_90err_low Epeak_90err_hi Norm Nomr_90err_low Norm_90err_hi chi2 dof
PL -2.011 -0.376 0.338 - - - 3.55e-04 -9.36e-05 9.10e-05 53.840 57
CPL -0.234 -1.747 3.382 35.537 -10.673 -35.537 4.74e-03 -4.74e-03 8.73e-01 51.500 56
=== 1-s peak spectral analysis ===
(Best model with acceptable fit: PL)
Model Ph_index Ph_90err_low Ph_90err_hi Epeak Epeak_90err_low Epeak_90err_hi Norm Nomr_90err_low Norm_90err_hi chi2 dof
PL -0.980 -0.242 0.255 - - - 1.39e-02 -1.81e-03 1.80e-03 53.460 57
CPL -0.991 -0.229 0.413 9999.360 -9999.360 -9999.360 1.40e-02 -1.40e-02 6.02e-03 53.510 56
=== Fluence/Peak Flux Summary ===
Model Band1 Band2 Band3 Band4 Band5 Total
15-25 25-50 50-100 100-350 15-150 15-350 keV
Fluence PL 1.11e-07 1.49e-07 1.48e-07 2.65e-07 4.94e-07 6.73e-07 erg/cm2
90%_error_low -2.72e-08 -3.01e-08 -5.01e-08 -1.40e-07 -1.19e-07 -2.12e-07 erg/cm2
90%_error_hi 2.79e-08 2.97e-08 5.36e-08 2.19e-07 1.25e-07 2.75e-07 erg/cm2
Peak flux PL 3.48e-01 4.78e-01 4.85e-01 8.93e-01 1.60e+00 2.20e+00 ph/cm2/s
90%_error_low -9.47e-02 -8.11e-02 -7.03e-02 -2.62e-01 -2.11e-01 -3.18e-01 ph/cm2/s
90%_error_hi 1.03e-01 7.81e-02 6.90e-02 3.34e-01 2.11e-01 3.37e-01 ph/cm2/s
Fluence CPL 1.05e-07 1.81e-07 1.06e-07 1.41e-08 4.04e-07 4.06e-07 erg/cm2
90%_error_low -3.04e-08 -2.57e-08 -7.28e-08 -1.39e-08 -1.06e-07 -1.07e-07 erg/cm2
90%_error_hi 3.01e-08 4.70e-08 7.84e-08 3.12e-07 1.52e-07 3.56e-07 erg/cm2
Peak flux CPL 3.48e-01 4.74e-01 4.85e-01 8.86e-01 1.60e+00 2.32e+00 ph/cm2/s
90%_error_low -9.51e-02 -7.63e-02 -7.04e-02 N/A -2.11e-01 -5.02e-01 ph/cm2/s
90%_error_hi 1.02e-01 8.30e-02 6.91e-02 N/A 2.11e-01 1.75e-01 ph/cm2/s
======================================================================
Image
Pre-slew 15.0-350.0 keV image (Event data)
#   RAcent    DECcent   POSerr    Theta     Phi              Peak Cts       SNR   Name
   58.1172   -55.9368   0.0234    28.5296   -84.0735         0.4341060      8.197 TRIG_00299787

Foreground time interval of the image:
 -0.144  16.197 (delta_t =  16.341 [sec])
Background time interval of the image:
-239.504  -0.144 (delta_t = 239.360 [sec])
Light Curves
Note: The mask-weighted lightcurves have units of either count/det or counts/sec/det, where a det is 0.4 x 0.4 = 0.16 sq cm.
Full-time range; 1 s binning
Other quick-look light curves:
- 64 ms binning (zoomed)
- 16 ms binning (zoomed)
- 8 ms binning (zoomed)
- 2 ms binning (zoomed)
- SN=5 or 10 s binning (full-time range)
- Raw light curve
Spectra
- 64 ms binning (zoomed)
- 16 ms binning (zoomed)
- 8 ms binning (zoomed)
- 2 ms binning (zoomed)
- SN=5 or 10 s binning (full-time range)
- Raw light curve
Spectra
Notes:
- 1) The fitting includes the systematic errors.
- 2) When the burst includes telescope slew time periods, the fitting uses an average response file made from multiple 5-s response files through out the slew time plus single time preiod for the non-slew times, and weighted by the total counts in the corresponding time period using addrmf. An average response file is needed becuase a spectral fit using the pre-slew DRM will introduce some errors in both a spectral shape and a normalization if the PHA file contains a lot of the slew/post-slew time interval.
- 3) For fits to more complicated models (e.g. a power-law over a cutoff power-law), the BAT team has decided to require a chi-square improvement of more than 6 for each extra dof.
Time averaged spectrum fit using the average DRM
Power-law model
Time interval is from   -0.144 sec. to  150.552 sec.

Spectral model in power-law:
------------------------------------------------------------
Parameters  : value       lower 90%   higher 90%
Photon index: -2.01077     ( -0.376067   0.338226 )
Norm@50keV  : 3.55171E-04    ( -9.36572e-05   9.10167e-05 )
------------------------------------------------------------
#Fit statistic : Chi-Squared =          53.84 using 59 PHA bins.
# Reduced chi-squared =         0.9446 for     57 degrees of freedom
# Null hypothesis probability =   5.942644e-01

Photon flux (15-150 keV)    in 150.7 sec: 5.35453E-02 ( -0.0103566  0.0103605 ) ph/cm2/s
Energy fluence (15-150 keV)             : 4.93984e-07 ( -1.18594e-07  1.24763e-07 ) ergs/cm2
Cutoff power-law model
Time interval is from   -0.144 sec. to  150.552 sec.
Spectral model in the cutoff power-law:
------------------------------------------------------------
Parameters  : value       lower 90%   higher 90%
Photon index: -0.234499     ( -1.78359   3.34608 )
Epeak [keV] : 35.5367      ( -10.5631 -35.4265 )
Norm@50keV  : 4.73765E-03    ( -0.00527313   0.872785 )
------------------------------------------------------------
#Fit statistic : Chi-Squared =          51.50 using 59 PHA bins.
# Reduced chi-squared =         0.9196 for     56 degrees of freedom
# Null hypothesis probability =   6.457990e-01

Photon flux (15-150 keV)    in 150.7 sec: 5.10707E-02 ( -0.0102948  0.0105512 ) ph/cm2/s
Energy fluence (15-150 keV)             : 4.04328e-07 ( -1.05891e-07  1.51964e-07 ) ergs/cm2
1-s peak spectrum fit
Power-law model
Time interval is from   -0.100 sec. to    0.900 sec.

Spectral model in power-law:
------------------------------------------------------------
Parameters  : value       lower 90%   higher 90%
Photon index: -0.980479     ( -0.241952   0.254928 )
Norm@50keV  : 1.38905E-02    ( -0.00180927   0.00180016 )
------------------------------------------------------------
#Fit statistic : Chi-Squared =          53.46 using 59 PHA bins.
# Reduced chi-squared =         0.9379 for     57 degrees of freedom
# Null hypothesis probability =   6.086274e-01

Photon flux (15-150 keV)    in 1 sec: 1.59768 ( -0.21059  0.21109 ) ph/cm2/s
Energy fluence (15-150 keV)             : 1.51273e-07 ( -2.18445e-08  2.20196e-08 ) ergs/cm2
Cutoff power-law model

Time interval is from   -0.100 sec. to    0.900 sec.
Spectral model in the cutoff power-law:
------------------------------------------------------------
Parameters  : value       lower 90%   higher 90%
Photon index: -0.990567     ( -0.229754   0.41182 )
Epeak [keV] : 9999.36      ( -9999.36 -9999.36 )
Norm@50keV  : 1.39889E-02    ( -0.0139861   0.00601846 )
------------------------------------------------------------
#Fit statistic : Chi-Squared =          53.51 using 59 PHA bins.
# Reduced chi-squared =         0.9556 for     56 degrees of freedom
# Null hypothesis probability =   5.696523e-01

Photon flux (15-150 keV)    in 1 sec: 1.59738 ( -0.21085  0.21088 ) ph/cm2/s
Energy fluence (15-150 keV)             : 1.51838e-07 ( -2.24899e-08  2.13549e-08 ) ergs/cm2
Time-resolved spectra
Distribution
T90 vs. Hardness ratio plot
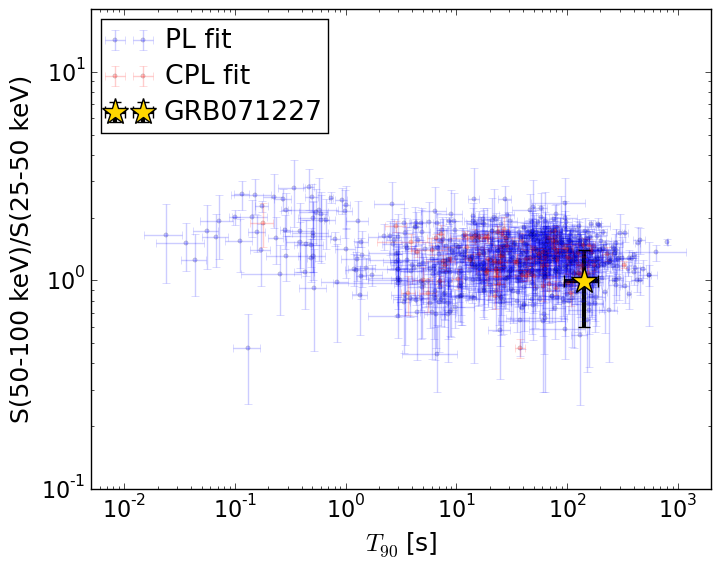
T90                                   = 142.48 sec.
Hardness ratio (energy fluence ratio) = 0.992659071879
S(15-50 keV) vs. S(50-150 keV) plot
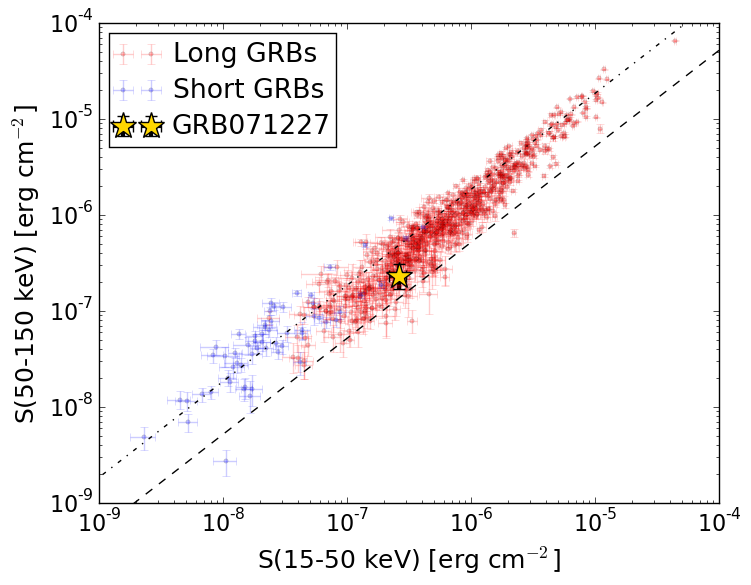
S(15-50 keV)  = 2.598167e-07
S(50-150 keV) = 2.3417467e-07
The dash-dotted line and the dashed line traces the fluences calculated from the Band function with Epeak = 15 and 150 keV, respectively. Both lines assume a canonical values of alpha = -1 and beta = -2.5.
Mask shadow pattern
IMX = 5.613099150980396E-02, IMY = 5.407194386117098E-01
Spacecraft aspect plot
Bright source in the pre-burst/pre-slew/post-slew images
Pre-burst image of 15-350 keV band
Time interval of the image:
-239.504000 -0.144000

# RAcent  DECcent POSerr Theta    Phi  PeakCts   SNR AngSep     Name
#  [deg]    [deg]    ['] [deg]  [deg]                   [']
135.3208 -40.5207    6.7  42.6 -176.6  -0.4387  -1.7    9.7	Vela X-1
150.3717 -34.3235    2.5  55.6  179.0   3.1399   4.6 ------	UNKNOWN
Pre-slew background subtracted image of 15-350 keV band
Time interval of the image:
-0.144000 16.196600

# RAcent  DECcent POSerr Theta    Phi  PeakCts   SNR AngSep     Name
#  [deg]    [deg]    ['] [deg]  [deg]                   [']
135.3534 -40.4696   17.7  42.6 -176.7  -0.0397  -0.6    9.5	Vela X-1
124.0725 -10.0562    2.3  44.6  136.3   0.6785   5.0 ------	UNKNOWN
 58.1172 -55.9367    1.4  28.5  -84.1   0.4341   8.2 ------	UNKNOWN
 68.5183 -64.5613    2.3  32.8 -101.9   0.3208   5.1 ------	UNKNOWN
156.8187 -63.4458    3.3  54.2 -144.9   0.6604   3.5 ------	UNKNOWN
Post-slew image of 15-350 keV band
Time interval of the image:
65.996600 811.396600

# RAcent  DECcent POSerr Theta    Phi  PeakCts   SNR AngSep     Name
#  [deg]    [deg]    ['] [deg]  [deg]                   [']
135.4622 -40.4848    5.1  50.9  162.5   2.9275   2.2    5.2	Vela X-1
170.3895 -60.6771    3.8  51.8 -159.6  -3.0824  -3.0    3.9	Cen X-3
186.4499 -62.8348   13.3  54.6 -150.5  -1.4187  -0.9    6.9	GX 301-2
 36.6609 -15.3308    2.7  43.8   24.9   3.4368   4.3 ------	UNKNOWN
 78.2256 -38.6171    2.6  21.9  101.7   1.8001   4.4 ------	UNKNOWN
 30.5824 -41.6804    3.6  22.8   -7.4   1.1831   3.2 ------	UNKNOWN
  1.4180 -18.3898    3.1  56.4  -16.6   5.8250   3.7 ------	UNKNOWN
269.7577 -78.9401    2.4  43.8 -116.0   9.7592   4.7 ------	UNKNOWN