Analysis Summary
Notes:
- 1) No attempt has been made to eliminate the non-significant decimal places.
- 2) This batgrbproduct analysis is done using the HEASARC data.
- 3) This batgrbproduct analysis is using the flight position for the mask-weighting calculation.
==========================================================================
BAT GROUND-DETECTED GRB DATA PROCESSING REPORT
Process Script: hand-made scripts that follow steps in batgrbproduct
but without using TDRSS info
Process Start Time: Tue Sep 30 00:03:30 EDT 2014
Host Name: bat1
Current Working Dir: /local/data/bat1/alien/Swift_3rdBATcatalog/event/ground_detect_bursts/scripts
==========================================================================
BAT Trigger Time: 222643798.08
UTC: 2008-01-21T21:29:55.561 [includes UTCF correction]
Where From?: Ground analysis (best_duration.txt)
NOTE: BAT trigger time for ground-detected burst is the T100 start time.
Refined Position: [ source = BAT pre-slew image ]
RA: 137.257457051 Dec: 41.8392508673 [deg; J2000]
{ 09h 09m 01.8s , +41d 50' 21.3" }
+/- 2.4791111952 [arcmin] (estimated 90% radius based on SNR)
SNR: 8.31563059263
Angular difference between the analysis and refined position is Usage: arcmin
Partial Coding Fraction: 6.328125e-01 [ including projection effects ]
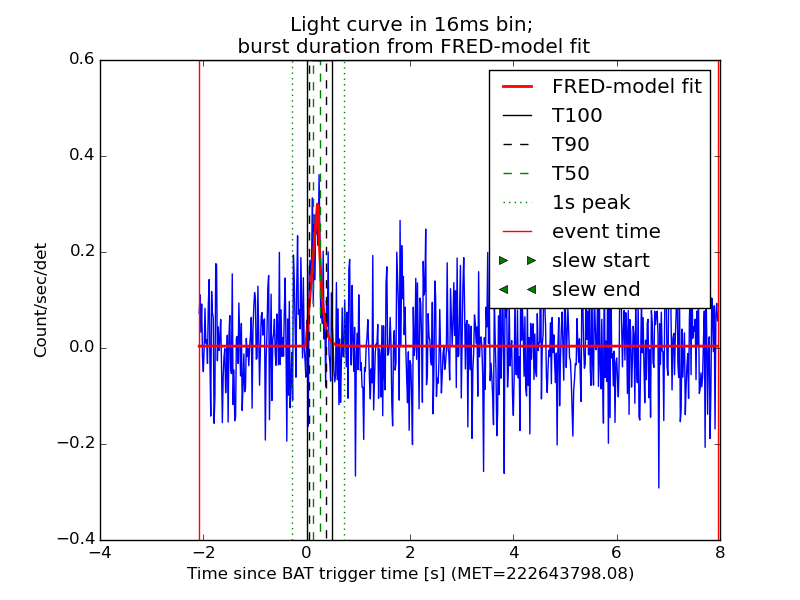
Duration (found by FRED-model fit)
T90: 0.32 +/- N/A
Measured from: 0.048
to: 0.368 [s; relative to TRIGTIME]
T50: 0.128 +/- N/A
Measured from: 0.128
to: 0.256
====== Table of the duration information =============================
Value tstart tstop
T100 0.496 0.000 0.496
T90 0.320 0.048 0.368
T50 0.128 0.128 0.256
Peak 1.000 -0.281 0.719
====== Spectral Analysis Summary =====================================
Model : spectral model: simple power-law (PL) and cutoff power-law (CPL)
Ph_index : photon index: E^{Ph_index}
Ph_90err : 90% error of the photon index
Epeak : Epeak in keV
Epeak_90err: 90% error of Epeak
Norm : normalization at 50 keV in both the PL model and CPL model
Nomr_90err : 90% error of the normalization
chi2 : Chi-Squared
dof : degree of freedo
=== Time-averaged spectral analysis ===
(Best model with acceptable fit: N/A)
Model Ph_index Ph_90err_low Ph_90err_hi Epeak Epeak_90err_low Epeak_90err_hi Norm Nomr_90err_low Norm_90err_hi chi2 dof
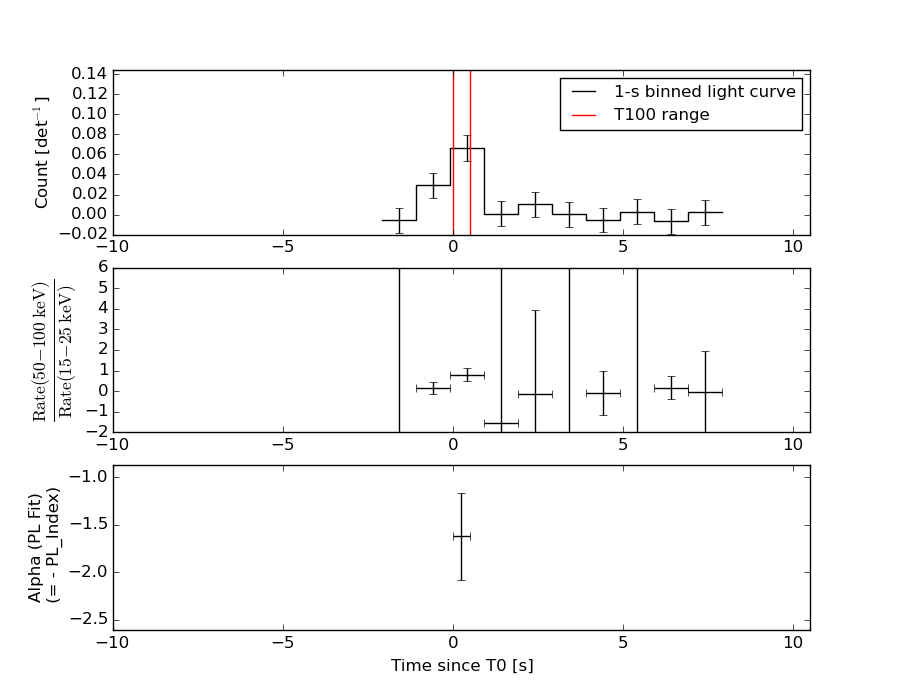
PL -1.614 -0.471 0.446 - - - 7.17e-03 -2.06e-03 1.98e-03 72.330 57
CPL -1.325 -1.072 1.772 107.717 -107.717 -107.717 1.02e-02 -1.02e-02 7.44e-02 72.190 56
=== 1-s peak spectral analysis ===
(Best model with acceptable fit: PL)
Model Ph_index Ph_90err_low Ph_90err_hi Epeak Epeak_90err_low Epeak_90err_hi Norm Nomr_90err_low Norm_90err_hi chi2 dof
PL -2.224 -0.513 0.433 - - - 4.06e-03 -1.48e-03 1.47e-03 69.530 57
CPL -1.225 -0.891 3.709 27.151 N/A N/A 1.80e-02 N/A N/A 68.530 56
=== Fluence/Peak Flux Summary ===
Model Band1 Band2 Band3 Band4 Band5 Total
15-25 25-50 50-100 100-350 15-150 15-350 keV
Fluence PL 5.05e-09 8.66e-09 1.13e-08 3.00e-08 3.32e-08 5.50e-08 erg/cm2
90%_error_low -1.89e-09 -2.21e-09 -4.22e-09 -1.77e-08 -9.91e-09 -2.28e-08 erg/cm2
90%_error_hi 2.02e-09 2.20e-09 4.28e-09 3.00e-08 1.03e-08 3.28e-08 erg/cm2
Peak flux PL 3.37e-01 2.22e-01 9.49e-02 5.57e-02 6.81e-01 7.09e-01 ph/cm2/s
90%_error_low -9.51e-02 -5.72e-02 -4.21e-02 -3.53e-02 -1.61e-01 -1.72e-01 ph/cm2/s
90%_error_hi 9.73e-02 5.57e-02 4.74e-02 6.19e-02 1.61e-01 1.75e-01 ph/cm2/s
Fluence CPL 4.87e-09 9.00e-09 1.14e-08 1.81e-08 3.23e-08 4.34e-08 erg/cm2
90%_error_low -2.17e-09 -2.49e-09 -4.53e-09 N/A -1.04e-08 -2.06e-08 erg/cm2
90%_error_hi 2.08e-09 2.79e-09 4.62e-09 N/A 1.09e-08 2.05e-08 erg/cm2
Peak flux CPL 3.28e-01 2.49e-01 8.14e-02 1.15e-02 6.68e-01 6.70e-01 ph/cm2/s
90%_error_low -1.02e-01 N/A -8.14e-02 -1.15e-02 -1.59e-01 N/A ph/cm2/s
90%_error_hi 1.02e-01 N/A 5.67e-02 9.60e-02 1.61e-01 N/A ph/cm2/s
======================================================================
Image
15.0-350.0 keV image (Event data)
#RAcent DECcent POSerr Theta  Phi  Peak_Cts  SNR Name
137.257 41.839 0.023 21.440 104.585 0.074 8.316 TRIG_00301491

Image time interval: 0.000 to 0.496 [sec]
Light Curves
Note: The mask-weighted lightcurves have units of either count/det or counts/sec/det, where a det is 0.4 x 0.4 = 0.16 sq cm.
Best duration plot
Full-time range; 1 s binning
Other quick-look light curves:
- 64 ms binning (zoomed)
- 16 ms binning (zoomed)
- 8 ms binning (zoomed)
- 2 ms binning (zoomed)
- SN=5 or 10 s binning (full-time range)
- Raw light curve
Spectra
- 64 ms binning (zoomed)
- 16 ms binning (zoomed)
- 8 ms binning (zoomed)
- 2 ms binning (zoomed)
- SN=5 or 10 s binning (full-time range)
- Raw light curve
Spectra
Notes:
- 1) The fitting includes the systematic errors.
- 2) When the burst includes telescope slew time periods, the fitting uses an average response file made from multiple 5-s response files through out the slew time plus single time preiod for the non-slew times, and weighted by the total counts in the corresponding time period using addrmf. An average response file is needed becuase a spectral fit using the pre-slew DRM will introduce some errors in both a spectral shape and a normalization if the PHA file contains a lot of the slew/post-slew time interval.
- 3) For fits to more complicated models (e.g. a power-law over a cutoff power-law), the BAT team has decided to require a chi-square improvement of more than 6 for each extra dof.
Time averaged spectrum fit using the average DRM
Power-law model
Time interval is from    0.000 sec. to    0.496 sec.

Spectral model in power-law:
------------------------------------------------------------
Parameters  : value       lower 90%   higher 90%
Photon index: -1.61352     ( -0.471167   0.445655 )
Norm@50keV  : 7.16685E-03    ( -0.00205888   0.00198082 )
------------------------------------------------------------
#Fit statistic : Chi-Squared =          72.33 using 59 PHA bins.
# Reduced chi-squared =          1.269 for     57 degrees of freedom
# Null hypothesis probability =   8.301247e-02

Photon flux (15-150 keV)    in 0.496 sec: 0.924904 ( -0.234769  0.234866 ) ph/cm2/s
Energy fluence (15-150 keV)             : 3.31957e-08 ( -9.91201e-09  1.03266e-08 ) ergs/cm2
Cutoff power-law model
Time interval is from    0.000 sec. to    0.496 sec.
Spectral model in the cutoff power-law:
------------------------------------------------------------
Parameters  : value       lower 90%   higher 90%
Photon index: -1.32463     ( -1.08854   1.75574 )
Epeak [keV] : 107.717      ( -106.31 -106.31 )
Norm@50keV  : 1.02344E-02    ( -0.0104487   0.0742308 )
------------------------------------------------------------
#Fit statistic : Chi-Squared =          72.19 using 59 PHA bins.
# Reduced chi-squared =          1.289 for     56 degrees of freedom
# Null hypothesis probability =   7.145672e-02

Photon flux (15-150 keV)    in 0.496 sec: 0.915259 ( -0.238509  0.238301 ) ph/cm2/s
Energy fluence (15-150 keV)             : 3.23088e-08 ( -1.04342e-08  1.09188e-08 ) ergs/cm2
1-s peak spectrum fit
Power-law model
Time interval is from   -0.281 sec. to    0.719 sec.

Spectral model in power-law:
------------------------------------------------------------
Parameters  : value       lower 90%   higher 90%
Photon index: -2.22389     ( -0.513459   0.433013 )
Norm@50keV  : 4.06087E-03    ( -0.00148074   0.00146514 )
------------------------------------------------------------
#Fit statistic : Chi-Squared =          69.53 using 59 PHA bins.
# Reduced chi-squared =          1.220 for     57 degrees of freedom
# Null hypothesis probability =   1.233666e-01

Photon flux (15-150 keV)    in 1 sec: 0.680923 ( -0.16071  0.161032 ) ph/cm2/s
Energy fluence (15-150 keV)             : 3.83239e-08 ( -1.15174e-08  1.25471e-08 ) ergs/cm2
Cutoff power-law model
Time interval is from   -0.281 sec. to    0.719 sec.
Spectral model in the cutoff power-law:
------------------------------------------------------------
Parameters  : value       lower 90%   higher 90%
Photon index: -1.22529     ( -0.890758   3.70891 )
Epeak [keV] : 27.1507      (   )
Norm@50keV  : 1.80182E-02    (     )
------------------------------------------------------------
#Fit statistic : Chi-Squared =          68.53 using 59 PHA bins.
# Reduced chi-squared =          1.224 for     56 degrees of freedom
# Null hypothesis probability =   1.215481e-01

Photon flux (15-150 keV)    in 1 sec: 0.667914 ( -0.158528  0.160745 ) ph/cm2/s
Energy fluence (15-150 keV)             : 3.42492e-08 ( -1.14353e-08  1.408e-08 ) ergs/cm2
Time-resolved spectra
Distribution
T90 vs. Hardness ratio plot
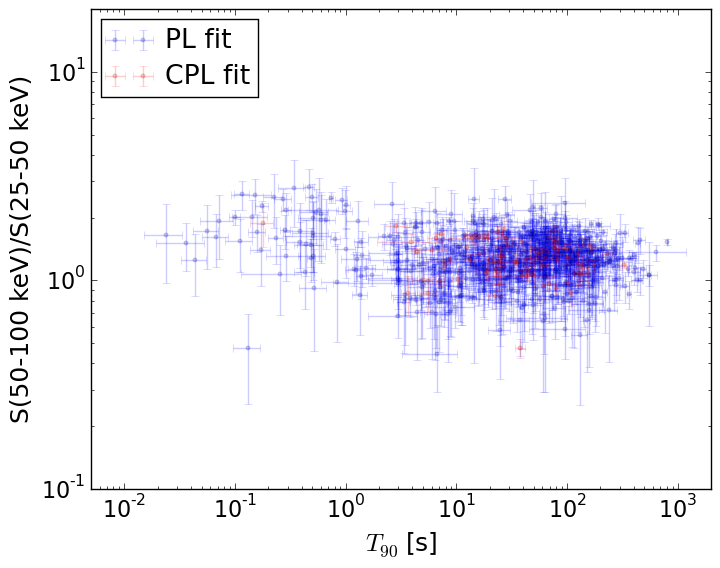
T90                                   = N/A sec.
Hardness ratio (energy fluence ratio) = N/A
S(15-50 keV) vs. S(50-150 keV) plot
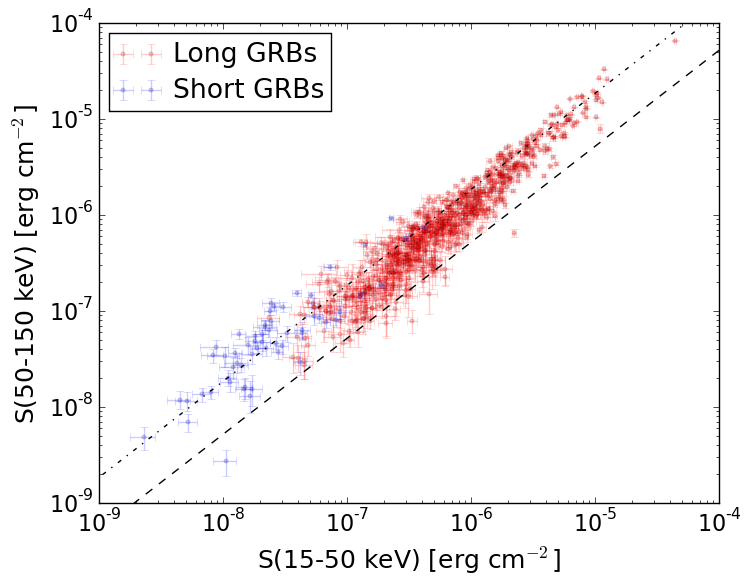
S(15-50 keV)  = N/A
S(50-150 keV) = N/A
The dash-dotted line and the dashed line traces the fluences calculated from the Band function with Epeak = 15 and 150 keV, respectively. Both lines assume a canonical values of alpha = -1 and beta = -2.5.
Mask shadow pattern
IMX = -0.0988866503755, IMY = -0.380037565843
Spacecraft aspect plot
Bright source in the event data image
Event data image of 15-350 keV band
Time interval of the image:
0.000000 0.496000

# RAcent  DECcent POSerr Theta    Phi  PeakCts   SNR AngSep     Name
#  [deg]    [deg]    ['] [deg]  [deg]                   [']
137.2574  41.8393    1.4  21.4  104.6   0.0741   8.3 ------	UNKNOWN
200.9319  11.3494    2.0  53.6   -4.7   0.1372   5.9 ------	UNKNOWN
Webpage updated on:
Sun Jun 21 01:28:06 EDT 2015