Analysis Summary
Notes:
- 1) No attempt has been made to eliminate the non-significant decimal places.
- 2) This batgrbproduct analysis is done using the HEASARC data.
- 3) This batgrbproduct analysis is using the flight position for the mask-weighting calculation.
======================================================================
BAT GRB EVENT DATA PROCESSING REPORT
Process Script Ver: batgrbproduct v2.46
Process Start Time: Wed Dec 24 14:20:26 EST 2014
Host Name: bat1
Current Working Dir: /local/data/bat1/alien/Swift_3rdBATcatalog/event/batevent_reproc/trigger301578
======================================================================
Trigger: 00301578 Segment: 000
BAT Trigger Time: 222754919.924 [s; MET]
Trigger Stop: 222754919.988 [s; MET]
UTC: 2008-01-23T04:21:57.402220 [includes UTCF correction]
Where From?: (*SHORT BURST*) TDRSS scaled map message
BAT
RA: 338.928685995783 Dec: -64.8899237672072 [deg; J2000]
Catalogged Source?: NO
Point Source?: YES
GRB Indicated?: YES [ by BAT flight software ]
Image S/N Ratio: 7.04
Image Trigger?: NO
Rate S/N Ratio: 36.9864840178139 [ if not an image trigger ]
Image S/N Ratio: 7.04
Analysis Position: [ source = BAT ]
RA: 338.928685995783 Dec: -64.8899237672072 [deg; J2000]
Refined Position: [ source = BAT pre-slew burst ]
RA: 338.929 Dec: -64.8899 [deg; J2000]
{ 22h 35m 43.0s , -64d -53' -23.6" }
+/- 3.01180324954 [arcmin] (estimated 90% radius based on SNR)
SNR: 6.29705086247
Angular difference between the analysis and refined position is 0.008121 arcmin
Partial Coding Fraction: 0.2050781 [ including projection effects ]
Duration
T90: 114.911999970675 +/- 55.267328797349
Measured from: 0.0279999971389771
to: 114.939999967813 [s; relative to TRIGTIME]
T50: 50.2719999849796 +/- 55.9885634028748
Measured from: 8.8120000064373
to: 59.0839999914169 [s; relative to TRIGTIME]
Fluence
Peak Flux (peak 1 second)
Measured from: -0.0480000078678131
to: 0.951999992132187 [s; relative to TRIGTIME]
Total Fluence
Measured from: 0.0119999945163727
to: 121.131999999285 [s; relative to TRIGTIME]
Band 1 Band 2 Band 3 Band 4
15-25 25-50 50-100 100-350 keV
Total 0.422964 0.284330 0.291417 -0.011039
0.091516 0.087083 0.074064 0.062707 [error]
Peak -0.002709 0.074689 0.068032 0.031129
0.015005 0.015003 0.013920 0.012061 [error]
[ fluence units of on-axis counts / fully illuminated detector ]
======================================================================
====== Table of the duration information =============================
Value tstart tstop
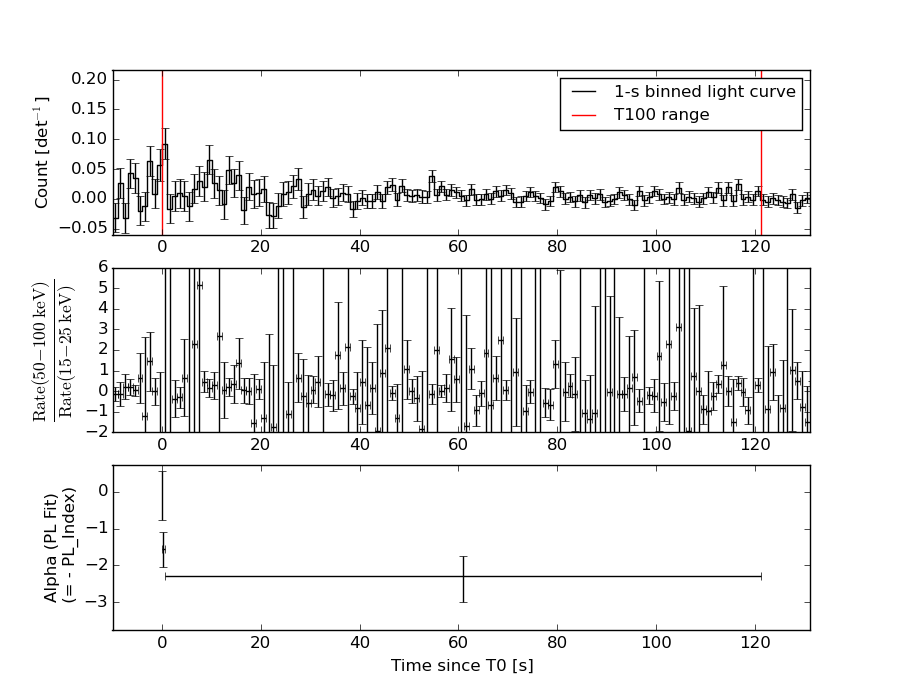
T100 121.120 0.012 121.132
T90 114.912 0.028 114.940
T50 50.272 8.812 59.084
Peak 1.000 -0.048 0.952
====== Spectral Analysis Summary =====================================
Model : spectral model: simple power-law (PL) and cutoff power-law (CPL)
Ph_index : photon index: E^{Ph_index}
Ph_90err : 90% error of the photon index
Epeak : Epeak in keV
Epeak_90err: 90% error of Epeak
Norm : normalization at 50 keV in both the PL model and CPL model
Nomr_90err : 90% error of the normalization
chi2 : Chi-Squared
dof : degree of freedo
=== Time-averaged spectral analysis ===
(Best model with acceptable fit: PL)
Model Ph_index Ph_90err_low Ph_90err_hi Epeak Epeak_90err_low Epeak_90err_hi Norm Nomr_90err_low Norm_90err_hi chi2 dof
PL -2.069 -0.546 0.468 - - - 4.95e-04 -1.67e-04 1.55e-04 48.220 57
CPL -1.985 N/A N/A 8.243 N/A N/A 5.50e-04 N/A N/A 48.220 56
=== 1-s peak spectral analysis ===
(Best model with acceptable fit: PL)
Model Ph_index Ph_90err_low Ph_90err_hi Epeak Epeak_90err_low Epeak_90err_hi Norm Nomr_90err_low Norm_90err_hi chi2 dof
PL -1.130 -0.412 0.443 - - - 1.28e-02 -3.33e-03 3.27e-03 55.030 57
CPL -0.203 -6.449 -1.836 116.436 N/A N/A 3.16e-02 N/A N/A 54.100 56
=== Fluence/Peak Flux Summary ===
Model Band1 Band2 Band3 Band4 Band5 Total
15-25 25-50 50-100 100-350 15-150 15-350 keV
Fluence PL 1.31e-07 1.70e-07 1.62e-07 2.74e-07 5.55e-07 7.38e-07 erg/cm2
90%_error_low -4.51e-08 -4.30e-08 -7.05e-08 -1.79e-07 -1.62e-07 -2.77e-07 erg/cm2
90%_error_hi 4.78e-08 4.27e-08 7.36e-08 3.21e-07 1.69e-07 3.80e-07 erg/cm2
Peak flux PL 3.70e-01 4.65e-01 4.25e-01 6.77e-01 1.49e+00 1.94e+00 ph/cm2/s
90%_error_low -1.73e-01 -1.53e-01 -1.09e-01 -3.04e-01 -4.02e-01 -4.80e-01 ph/cm2/s
90%_error_hi 2.15e-01 1.52e-01 1.08e-01 4.25e-01 4.12e-01 4.84e-01 ph/cm2/s
Fluence CPL 1.30e-07 1.72e-07 1.63e-07 3.76e-07 5.52e-07 7.03e-07 erg/cm2
90%_error_low -5.06e-08 -4.27e-08 -7.42e-08 -2.79e-07 -1.71e-07 -3.12e-07 erg/cm2
90%_error_hi 4.29e-08 4.27e-08 7.56e-08 1.51e-07 1.67e-07 3.69e-07 erg/cm2
Peak flux CPL 2.81e-01 4.77e-01 4.75e-01 3.42e-01 1.43e+00 1.57e+00 ph/cm2/s
90%_error_low -1.89e-01 -1.73e-01 -1.38e-01 -3.42e-01 -4.03e-01 -4.97e-01 ph/cm2/s
90%_error_hi 2.60e-01 1.72e-01 1.45e-01 4.90e-01 4.22e-01 6.63e-01 ph/cm2/s
======================================================================
Image
Pre-slew 50.0-350.0 keV image (Event data)
#RAcent DECcent POSerr Theta  Phi  Peak_Cts  SNR Name
338.929 -64.890 0.000 50.094 -26.299 0.050 6.297 TRIG_00301578

Image time interval: 0.000 to 0.064 [sec]
Light Curves
Note: The mask-weighted lightcurves have units of either count/det or counts/sec/det, where a det is 0.4 x 0.4 = 0.16 sq cm.
Full-time range; 1 s binning
Other quick-look light curves:
- 64 ms binning (zoomed)
- 16 ms binning (zoomed)
- 8 ms binning (zoomed)
- 2 ms binning (zoomed)
- SN=5 or 10 s binning (full-time range)
- Raw light curve
Spectra
- 64 ms binning (zoomed)
- 16 ms binning (zoomed)
- 8 ms binning (zoomed)
- 2 ms binning (zoomed)
- SN=5 or 10 s binning (full-time range)
- Raw light curve
Spectra
Notes:
- 1) The fitting includes the systematic errors.
- 2) When the burst includes telescope slew time periods, the fitting uses an average response file made from multiple 5-s response files through out the slew time plus single time preiod for the non-slew times, and weighted by the total counts in the corresponding time period using addrmf. An average response file is needed becuase a spectral fit using the pre-slew DRM will introduce some errors in both a spectral shape and a normalization if the PHA file contains a lot of the slew/post-slew time interval.
- 3) For fits to more complicated models (e.g. a power-law over a cutoff power-law), the BAT team has decided to require a chi-square improvement of more than 6 for each extra dof.
Time averaged spectrum fit using the average DRM
Power-law model
Time interval is from    0.012 sec. to  121.132 sec.

Spectral model in power-law:
------------------------------------------------------------
Parameters  : value       lower 90%   higher 90%
Photon index: -2.06926     ( -0.545964   0.467642 )
Norm@50keV  : 4.94545E-04    ( -0.000166583   0.00015511 )
------------------------------------------------------------
#Fit statistic : Chi-Squared =          48.22 using 59 PHA bins.
# Reduced chi-squared =         0.8460 for     57 degrees of freedom
# Null hypothesis probability =   7.896269e-01

Photon flux (15-150 keV)    in 121.1 sec: 7.66513E-02 ( -0.0191461  0.0191667 ) ph/cm2/s
Energy fluence (15-150 keV)             : 5.55001e-07 ( -1.62e-07  1.68624e-07 ) ergs/cm2
Cutoff power-law model

Time interval is from    0.012 sec. to  121.132 sec.
Spectral model in the cutoff power-law:
------------------------------------------------------------
Parameters  : value       lower 90%   higher 90%
Photon index: -1.98488     (       )
Epeak [keV] : 8.24290      (   )
Norm@50keV  : 5.49770E-04    (     )
------------------------------------------------------------
#Fit statistic : Chi-Squared =          48.22 using 59 PHA bins.
# Reduced chi-squared =         0.8611 for     56 degrees of freedom
# Null hypothesis probability =   7.606882e-01

Photon flux (15-150 keV)    in 121.1 sec: 7.64260E-02 ( -0.0189753  0.0189787 ) ph/cm2/s
Energy fluence (15-150 keV)             : 5.52095e-07 ( -1.70841e-07  1.67162e-07 ) ergs/cm2
1-s peak spectrum fit
Power-law model
Time interval is from   -0.048 sec. to    0.952 sec.

Spectral model in power-law:
------------------------------------------------------------
Parameters  : value       lower 90%   higher 90%
Photon index: -1.12956     ( -0.412389   0.442614 )
Norm@50keV  : 1.28185E-02    ( -0.00332728   0.00327267 )
------------------------------------------------------------
#Fit statistic : Chi-Squared =          55.03 using 59 PHA bins.
# Reduced chi-squared =         0.9655 for     57 degrees of freedom
# Null hypothesis probability =   5.491572e-01

Photon flux (15-150 keV)    in 1 sec: 1.49142 ( -0.4019  0.41152 ) ph/cm2/s
Energy fluence (15-150 keV)             : 1.32798e-07 ( -3.34178e-08  3.34858e-08 ) ergs/cm2
Cutoff power-law model
Time interval is from   -0.048 sec. to    0.952 sec.
Spectral model in the cutoff power-law:
------------------------------------------------------------
Parameters  : value       lower 90%   higher 90%
Photon index: -2.21674     ( -4.43622   0.177339 )
Epeak [keV] : 68.7242      (   )
Norm@50keV  : 2.70325E-04    (     )
------------------------------------------------------------
#Fit statistic : Chi-Squared =          54.03 using 59 PHA bins.
# Reduced chi-squared =         0.9648 for     56 degrees of freedom
# Null hypothesis probability =   5.499083e-01

Photon flux (15-150 keV)    in 1 sec: 1.42904 ( -0.40314  0.42205 ) ph/cm2/s
Energy fluence (15-150 keV)             : 1.29181e-07 ( -3.53687e-08  3.4659e-08 ) ergs/cm2
Time-resolved spectra
Distribution
T90 vs. Hardness ratio plot
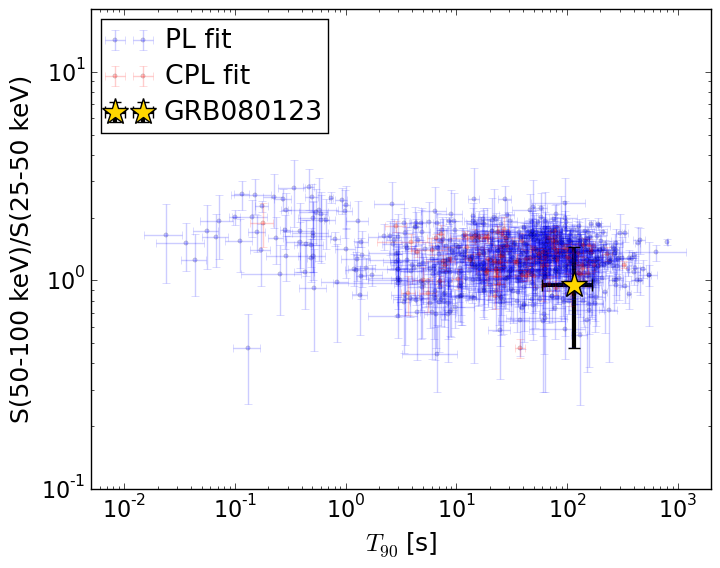
T90                                   = 114.912 sec.
Hardness ratio (energy fluence ratio) = 0.95314754695
S(15-50 keV) vs. S(50-150 keV) plot
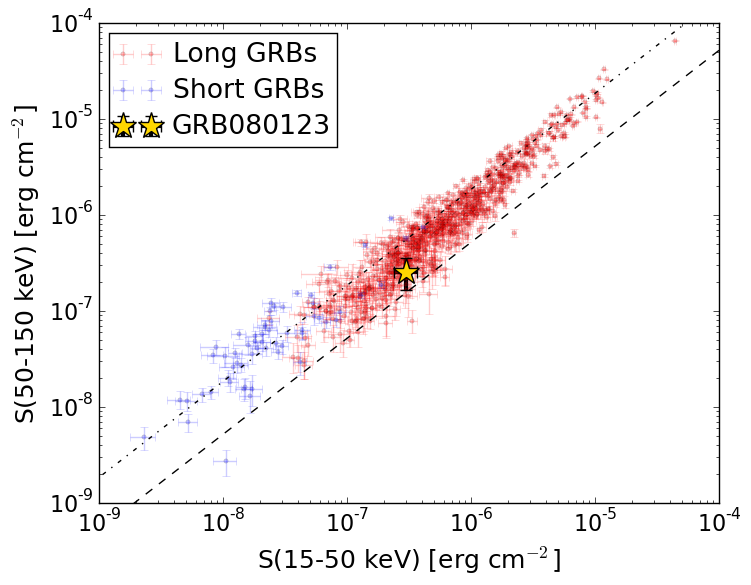
S(15-50 keV)  = 3.012223e-07
S(50-150 keV) = 2.5377671e-07
The dash-dotted line and the dashed line traces the fluences calculated from the Band function with Epeak = 15 and 150 keV, respectively. Both lines assume a canonical values of alpha = -1 and beta = -2.5.
Mask shadow pattern
IMX = 1.07195403911, IMY = 0.529777073925
Spacecraft aspect plot
Bright source in the pre-burst/pre-slew/post-slew images
Pre-burst image of 15-350 keV band
Time interval of the image:
-70.223410 0.012000

# RAcent  DECcent POSerr Theta    Phi  PeakCts   SNR AngSep     Name
#  [deg]    [deg]    ['] [deg]  [deg]                   [']
186.7597 -62.7182    3.4  43.8   45.1   1.1502   3.4    4.2	GX 301-2
244.9692 -15.6586    0.5  27.9  165.9   2.3056  23.4    1.3	Sco X-1
255.7804 -37.7549    7.1   4.5 -165.6   0.1407   1.6   11.1	4U 1700-377
256.2677 -36.3386    8.2   5.9 -163.4   0.1200   1.4    9.6	GX 349+2
263.0246 -24.8768   89.8  18.5 -149.6  -0.0117  -0.1    7.9	GX 1+4
264.6747 -44.5140   17.1   7.4  -61.2  -0.0596  -0.7    4.8	4U 1735-44
268.4314  -1.4178    3.9  42.5 -152.9   0.4398   2.9    4.3	SW J1753.5-0127
270.2172 -24.9452    3.7  21.3 -132.2   0.3019   3.2    8.8	GX 5-1
270.4628 -25.7154    7.2  20.8 -130.5   0.1552   1.6    8.8	GRS 1758-258
274.0112 -14.0640    2.2  32.5 -137.1   0.5828   5.2    1.7	GX 17+2
276.1191 -30.3887    8.3  20.6 -111.0   0.1331   1.4   10.1	H1820-303
285.1312 -24.8261    5.4  30.2 -108.4  -0.2955  -2.1    7.7	HT1900.1-2455
263.1169 -33.8138    3.1  10.5 -133.2   0.3188   3.7    6.5	GX 354-0
244.2452 -58.9966    2.9  18.1   25.2   0.3349   4.0 ------	UNKNOWN
256.0880 -20.5814    2.3  21.6 -170.3   0.4306   5.1 ------	UNKNOWN
323.0197 -46.6195    3.1  47.2  -53.1   1.5601   3.7 ------	UNKNOWN
Pre-slew background subtracted image of 15-350 keV band
Time interval of the image:
0.012000 9.376590

# RAcent  DECcent POSerr Theta    Phi  PeakCts   SNR AngSep     Name
#  [deg]    [deg]    ['] [deg]  [deg]                   [']
186.7543 -62.7331   16.8  43.8   45.1  -0.0793  -0.7    3.5	GX 301-2
244.8608 -15.7447    5.2  27.8  165.7  -0.0804  -2.2    9.3	Sco X-1
256.0639 -37.9568    3.0   4.3 -162.3   0.1161   3.9    7.7	4U 1700-377
256.6114 -36.3587   14.7   5.9 -160.8   0.0239   0.8    9.3	GX 349+2
263.1008 -24.8358    5.1  18.6 -149.4  -0.0683  -2.3    7.4	GX 1+4
264.6428 -44.4548    4.6   7.3  -61.6   0.0723   2.5    4.3	4U 1735-44
268.4834  -1.4191   27.0  42.5 -152.8   0.0224   0.4    7.2	SW J1753.5-0127
270.3733 -25.1636    9.7  21.2 -131.5   0.0424   1.2    7.0	GX 5-1
270.4231 -25.8651    4.6  20.6 -130.3  -0.0897  -2.5    9.8	GRS 1758-258
274.0771 -14.0926    9.0  32.5 -136.9  -0.0564  -1.3    5.3	GX 17+2
276.1271 -30.4152   74.1  20.6 -111.0  -0.0055  -0.2   10.9	H1820-303
285.1818 -24.9031    6.5  30.2 -108.2   0.0851   1.8    8.0	HT1900.1-2455
262.9579 -33.7465    7.5  10.5 -134.0  -0.0473  -1.5    5.5	GX 354-0
275.0188 -30.5705    2.0  19.7 -112.5   0.2069   5.8 ------	UNKNOWN
322.7604 -56.8572    2.2  44.3  -39.4   0.3500   5.3 ------	UNKNOWN
Post-slew image of 15-350 keV band
Time interval of the image:
90.176600 962.099200

# RAcent  DECcent POSerr Theta    Phi  PeakCts   SNR AngSep     Name
#  [deg]    [deg]    ['] [deg]  [deg]                   [']
186.5492 -62.6268    0.0  50.9  149.3   5.3569   2.3    9.1	GX 301-2
256.0792 -37.7788    5.3  53.4 -149.0   3.5844   2.2    5.9	4U 1700-377
256.5087 -36.5235   11.8  54.3 -147.8   2.1295   1.0    7.0	GX 349+2
264.7302 -44.4586  202.1  44.2 -146.7   0.0517   0.1    0.8	4U 1735-44
237.3231 -58.9547    3.5  43.0 -178.9   2.2373   3.3 ------	UNKNOWN
 11.6166 -24.4720    3.1  45.5   -3.1   3.3338   3.8 ------	UNKNOWN
243.5149 -37.4772    4.6  58.7 -159.1   8.2710   2.5 ------	UNKNOWN
341.8193 -14.8863    3.9  50.0  -43.0   7.3667   3.0 ------	UNKNOWN
305.7897 -29.4933    4.7  40.9  -93.2   6.4318   2.5 ------	UNKNOWN