Analysis Summary
Notes:
- 1) No attempt has been made to eliminate the non-significant decimal places.
- 2) This batgrbproduct analysis is done using the HEASARC data.
- 3) This batgrbproduct analysis is using the flight position for the mask-weighting calculation.
======================================================================
BAT GRB EVENT DATA PROCESSING REPORT
Process Script Ver: batgrbproduct v2.46
Process Start Time: Mon Jan 20 04:59:14 EST 2014
Host Name: batevent1
Current Working Dir: /local/data/batevent/batevent_reproc/trigger301981
======================================================================
Trigger: 00301981 Segment: 000
BAT Trigger Time: 223279608 [s; MET]
Trigger Stop: 223279672 [s; MET]
UTC: 2008-01-29T06:06:45.464120 [includes UTCF correction]
Where From?: TDRSS position message
BAT
RA: 105.280011758568 Dec: -7.82688688603851 [deg; J2000]
Catalogged Source?: NO
Point Source?: YES
GRB Indicated?: YES [ by BAT flight software ]
Image S/N Ratio: 7.51
Image Trigger?: YES
Rate S/N Ratio: 0 [ if not an image trigger ]
Image S/N Ratio: 7.51
Analysis Position: [ source = BAT ]
RA: 105.280011758568 Dec: -7.82688688603851 [deg; J2000]
Refined Position: [ source = BAT pre-slew burst ]
RA: 105.287918693116 Dec: -7.84878702628647 [deg; J2000]
{ 07h 01m 09.1s , -07d 50' 55.6" }
+/- 2.0979526670691 [arcmin] (estimated 90% radius based on SNR)
+/- 1.08096063871601 [arcmin] (formal 1-sigma fit error)
SNR: 10.5538339688152
Angular difference between the analysis and refined position is 1.395530 arcmin
Partial Coding Fraction: 0.46875 [ including projection effects ]
Duration
T90: 50.1800000071526 +/- 9.16545032804407
Measured from: -1.44400000572205
to: 48.7360000014305 [s; relative to TRIGTIME]
T50: 25.8240000009537 +/- 8.11501521505903
Measured from: 8.5
to: 34.3240000009537 [s; relative to TRIGTIME]
Fluence
Peak Flux (peak 1 second)
Measured from: 27.0119999945164
to: 28.0119999945164 [s; relative to TRIGTIME]
Total Fluence
Measured from: -3.45600000023842
to: 52.4320000112057 [s; relative to TRIGTIME]
Band 1 Band 2 Band 3 Band 4
15-25 25-50 50-100 100-350 keV
Total 0.245843 0.448381 0.393414 0.088385
0.060115 0.062663 0.054931 0.046762 [error]
Peak 0.000221 0.031510 0.022339 0.011426
0.008306 0.008451 0.007610 0.006220 [error]
[ fluence units of on-axis counts / fully illuminated detector ]
======================================================================
====== Table of the duration information =============================
Value tstart tstop
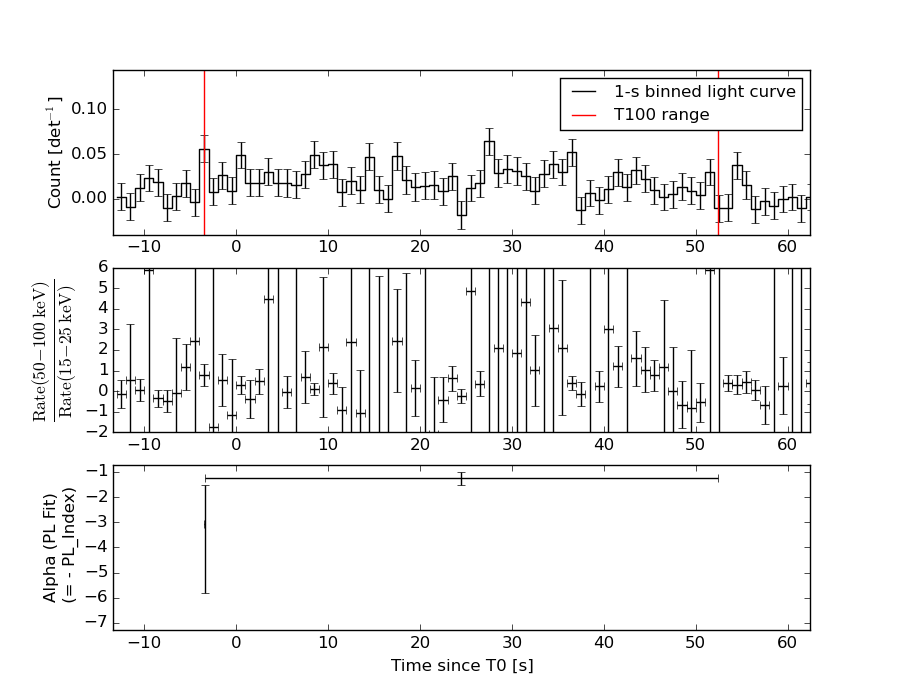
T100 55.888 -3.456 52.432
T90 50.180 -1.444 48.736
T50 25.824 8.500 34.324
Peak 1.000 27.012 28.012
====== Spectral Analysis Summary =====================================
Model : spectral model: simple power-law (PL) and cutoff power-law (CPL)
Ph_index : photon index: E^{Ph_index}
Ph_90err : 90% error of the photon index
Epeak : Epeak in keV
Epeak_90err: 90% error of Epeak
Norm : normalization at 50 keV in both the PL model and CPL model
Nomr_90err : 90% error of the normalization
chi2 : Chi-Squared
dof : degree of freedo
=== Time-averaged spectral analysis ===
(Best model with acceptable fit: PL)
Model Ph_index Ph_90err_low Ph_90err_hi Epeak Epeak_90err_low Epeak_90err_hi Norm Nomr_90err_low Norm_90err_hi chi2 dof
PL -1.268 -0.256 0.266 - - - 1.51e-03 -2.22e-04 2.22e-04 52.570 57
CPL -1.270 -0.252 0.274 9999.360 -9999.360 -9999.360 1.51e-03 -2.21e-04 2.82e-03 52.570 56
=== 1-s peak spectral analysis ===
(Best model with acceptable fit: PL)
Model Ph_index Ph_90err_low Ph_90err_hi Epeak Epeak_90err_low Epeak_90err_hi Norm Nomr_90err_low Norm_90err_hi chi2 dof
PL -1.023 -0.570 0.687 - - - 4.75e-03 -1.79e-03 1.69e-03 58.680 57
CPL -0.664 -3.555 -1.402 217.110 N/A N/A 6.86e-03 N/A N/A 58.620 56
=== Fluence/Peak Flux Summary ===
Model Band1 Band2 Band3 Band4 Band5 Total
15-25 25-50 50-100 100-350 15-150 15-350 keV
Fluence PL 8.66e-08 1.83e-07 3.05e-07 1.15e-06 8.39e-07 1.72e-06 erg/cm2
90%_error_low -2.43e-08 -3.26e-08 -5.17e-08 -3.83e-07 -1.30e-07 -4.20e-07 erg/cm2
90%_error_hi 2.64e-08 3.17e-08 5.09e-08 5.03e-07 1.31e-07 5.18e-07 erg/cm2
Peak flux PL 1.24e-01 1.66e-01 1.63e-01 2.89e-01 5.48e-01 7.42e-01 ph/cm2/s
90%_error_low -8.04e-02 -8.01e-02 -5.59e-02 -1.64e-01 -2.03e-01 -2.48e-01 ph/cm2/s
90%_error_hi 1.07e-01 7.76e-02 5.53e-02 2.75e-01 2.08e-01 2.57e-01 ph/cm2/s
Fluence CPL 8.76e-08 1.83e-07 3.03e-07 1.14e-06 8.40e-07 1.73e-06 erg/cm2
90%_error_low -1.80e-08 -2.48e-08 -5.12e-08 N/A -1.37e-07 -8.29e-07 erg/cm2
90%_error_hi 2.72e-08 3.34e-08 5.89e-08 N/A 1.30e-07 2.40e-07 erg/cm2
Peak flux CPL 1.13e-01 1.70e-01 1.71e-01 2.06e-01 5.42e-01 6.59e-01 ph/cm2/s
90%_error_low -1.13e-01 -8.39e-02 -6.31e-02 -2.06e-01 -2.03e-01 -3.00e-01 ph/cm2/s
90%_error_hi 1.16e-01 8.95e-02 7.73e-02 3.39e-01 2.11e-01 3.17e-01 ph/cm2/s
======================================================================
Image
Pre-slew 15.0-350.0 keV image (Event data)
#   RAcent    DECcent   POSerr    Theta     Phi              Peak Cts       SNR   Name
  105.2879    -7.8488   0.0182    41.5279   176.7982         1.3076689     10.554 TRIG_00301981

Foreground time interval of the image:
 -3.456  52.432 (delta_t =  55.888 [sec])
Background time interval of the image:
-355.699 -264.950 (delta_t =  90.749 [sec])
-239.000  -3.456 (delta_t = 235.544 [sec])
Light Curves
Note: The mask-weighted lightcurves have units of either count/det or counts/sec/det, where a det is 0.4 x 0.4 = 0.16 sq cm.
Full-time range; 1 s binning
Other quick-look light curves:
- 64 ms binning (zoomed)
- 16 ms binning (zoomed)
- 8 ms binning (zoomed)
- 2 ms binning (zoomed)
- SN=5 or 10 s binning (full-time range)
- Raw light curve
Spectra
- 64 ms binning (zoomed)
- 16 ms binning (zoomed)
- 8 ms binning (zoomed)
- 2 ms binning (zoomed)
- SN=5 or 10 s binning (full-time range)
- Raw light curve
Spectra
Notes:
- 1) The fitting includes the systematic errors.
- 2) When the burst includes telescope slew time periods, the fitting uses an average response file made from multiple 5-s response files through out the slew time plus single time preiod for the non-slew times, and weighted by the total counts in the corresponding time period using addrmf. An average response file is needed becuase a spectral fit using the pre-slew DRM will introduce some errors in both a spectral shape and a normalization if the PHA file contains a lot of the slew/post-slew time interval.
- 3) For fits to more complicated models (e.g. a power-law over a cutoff power-law), the BAT team has decided to require a chi-square improvement of more than 6 for each extra dof.
Time averaged spectrum fit using the average DRM
Power-law model
Time interval is from   -3.456 sec. to   52.432 sec.

Spectral model in power-law:
------------------------------------------------------------
Parameters  : value       lower 90%   higher 90%
Photon index: -1.26839     ( -0.256252   0.266422 )
Norm@50keV  : 1.50713E-03    ( -0.000221911   0.000221558 )
------------------------------------------------------------
#Fit statistic : Chi-Squared =          52.57 using 59 PHA bins.
# Reduced chi-squared =         0.9223 for     57 degrees of freedom
# Null hypothesis probability =   6.418104e-01

Photon flux (15-150 keV)    in 55.89 sec: 0.178801 ( -0.028069  0.028226 ) ph/cm2/s
Energy fluence (15-150 keV)             : 8.39082e-07 ( -1.30102e-07  1.307e-07 ) ergs/cm2
Cutoff power-law model
Time interval is from   -3.456 sec. to   52.432 sec.
Spectral model in the cutoff power-law:
------------------------------------------------------------
Parameters  : value       lower 90%   higher 90%
Photon index: -1.27013     ( -0.254438   0.272074 )
Epeak [keV] : 9999.36      ( -9999.36 -9999.36 )
Norm@50keV  : 1.51276E-03    ( -0.000220558   0.00282278 )
------------------------------------------------------------
#Fit statistic : Chi-Squared =          52.57 using 59 PHA bins.
# Reduced chi-squared =         0.9388 for     56 degrees of freedom
# Null hypothesis probability =   6.053364e-01

Photon flux (15-150 keV)    in 55.89 sec: 0.179055 ( -0.028673  0.028257 ) ph/cm2/s
Energy fluence (15-150 keV)             : 8.4034e-07 ( -1.36662e-07  1.29911e-07 ) ergs/cm2
1-s peak spectrum fit
Power-law model
Time interval is from   27.012 sec. to   28.012 sec.

Spectral model in power-law:
------------------------------------------------------------
Parameters  : value       lower 90%   higher 90%
Photon index: -1.02299     ( -0.569715   0.687446 )
Norm@50keV  : 4.75369E-03    ( -0.00179388   0.00168954 )
------------------------------------------------------------
#Fit statistic : Chi-Squared =          58.68 using 59 PHA bins.
# Reduced chi-squared =          1.030 for     57 degrees of freedom
# Null hypothesis probability =   4.135409e-01

Photon flux (15-150 keV)    in 1 sec: 0.548014 ( -0.202614  0.208251 ) ph/cm2/s
Energy fluence (15-150 keV)             : 5.09965e-08 ( -1.72872e-08  1.73427e-08 ) ergs/cm2
Cutoff power-law model
Time interval is from   27.012 sec. to   28.012 sec.
Spectral model in the cutoff power-law:
------------------------------------------------------------
Parameters  : value       lower 90%   higher 90%
Photon index: -2.1528     ( -2.06669   0.0861122 )
Epeak [keV] : 49.8066      (   )
Norm@50keV  : 1.77806E-04    (     )
------------------------------------------------------------
#Fit statistic : Chi-Squared =          58.38 using 59 PHA bins.
# Reduced chi-squared =          1.043 for     56 degrees of freedom
# Null hypothesis probability =   3.878926e-01

Photon flux (15-150 keV)    in 1 sec: 0.541971 ( -0.203412  0.211233 ) ph/cm2/s
Energy fluence (15-150 keV)             : 5.04232e-08 ( -1.87377e-08  1.77086e-08 ) ergs/cm2
Time-resolved spectra
Distribution
T90 vs. Hardness ratio plot
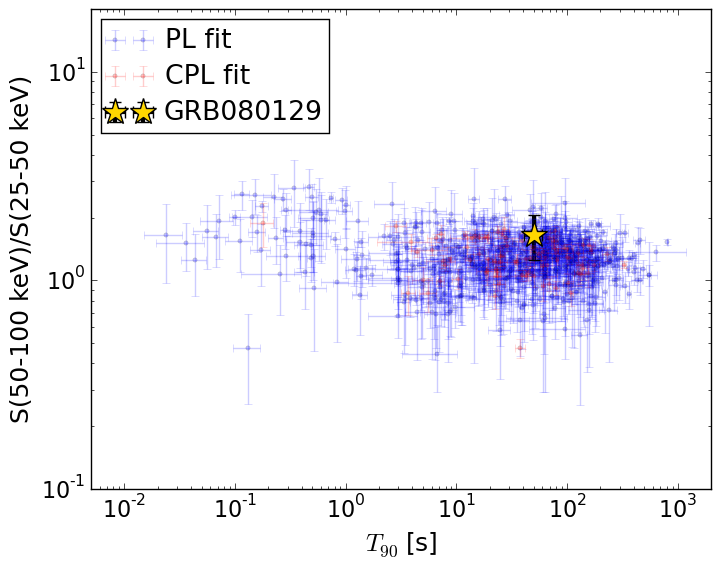
T90                                   = 50.18 sec.
Hardness ratio (energy fluence ratio) = 1.66050411098
S(15-50 keV) vs. S(50-150 keV) plot
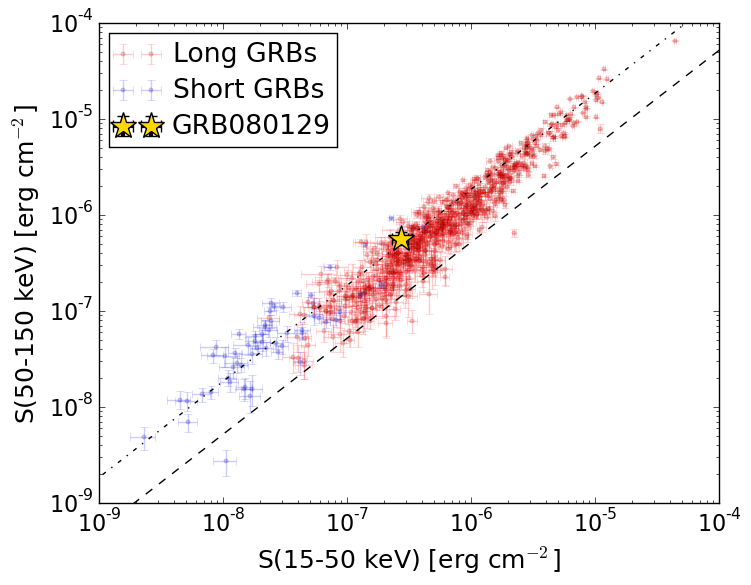
S(15-50 keV)  = 2.7004501e-07
S(50-150 keV) = 5.690341e-07
The dash-dotted line and the dashed line traces the fluences calculated from the Band function with Epeak = 15 and 150 keV, respectively. Both lines assume a canonical values of alpha = -1 and beta = -2.5.
Mask shadow pattern
IMX = -8.842114871837599E-01, IMY = -4.946245927239137E-02
Spacecraft aspect plot
Bright source in the pre-burst/pre-slew/post-slew images
Pre-burst image of 15-350 keV band
Time interval of the image:
-355.699400 -264.950000
-239.000000 -3.456000

# RAcent  DECcent POSerr Theta    Phi  PeakCts   SNR AngSep     Name
#  [deg]    [deg]    ['] [deg]  [deg]                   [']
 83.6300  22.0086    0.3  28.7 -120.5  13.5991  44.6    0.4	Crab
125.7051 -10.9129    2.4  45.3  147.5   2.9097   4.9 ------	UNKNOWN
187.6852  60.9734    3.5  54.0   19.3   4.7035   3.3 ------	UNKNOWN
187.4862  71.6039    2.2  53.9    6.1   4.5239   5.2 ------	UNKNOWN
143.5859  64.7696    2.8  36.7    4.9   1.2708   4.2 ------	UNKNOWN
100.0023 -22.5409    3.3  57.0  179.3   5.1239   3.5 ------	UNKNOWN
102.6388 -12.6533    2.4  46.8  179.1   1.9923   4.8 ------	UNKNOWN
106.5517  21.9371    2.0  12.7 -163.9   1.1947   5.7 ------	UNKNOWN
 99.8636   6.2452    2.7  29.6 -167.0   0.9927   4.2 ------	UNKNOWN
 67.4852  86.5330    2.9  54.8  -19.0   3.0073   4.0 ------	UNKNOWN
 11.4319  83.8638    3.1  58.6  -22.9   5.4207   3.7 ------	UNKNOWN
Pre-slew background subtracted image of 15-350 keV band
Time interval of the image:
-3.456000 52.432000

# RAcent  DECcent POSerr Theta    Phi  PeakCts   SNR AngSep     Name
#  [deg]    [deg]    ['] [deg]  [deg]                   [']
 83.4771  21.9852    4.9  28.9 -120.4   0.2316   2.3    8.9	Crab
180.1025  51.8281    2.5  50.6   31.2   1.6927   4.7 ------	UNKNOWN
132.9909  48.4697    2.9  21.2   21.2   0.3004   4.0 ------	UNKNOWN
105.2879  -7.8488    1.1  41.5  176.8   1.3074  10.6 ------	UNKNOWN
 88.4594  -9.5723    2.4  48.8 -161.9   0.8114   4.9 ------	UNKNOWN
Post-slew image of 15-350 keV band
Time interval of the image:
404.200600 963.120000

# RAcent  DECcent POSerr Theta    Phi  PeakCts   SNR AngSep     Name
#  [deg]    [deg]    ['] [deg]  [deg]                   [']
147.4353  33.2376    3.4  37.7   82.8   3.2002   3.4 ------	UNKNOWN
290.9053  88.5164    2.4  23.1 -131.7   1.3903   4.8 ------	UNKNOWN
268.2673  56.0982    2.5  41.2  -77.6   6.6444   4.7 ------	UNKNOWN