Analysis Summary
Notes:
- 1) No attempt has been made to eliminate the non-significant decimal places.
- 2) This batgrbproduct analysis is done using the HEASARC data.
- 3) This batgrbproduct analysis is using the flight position for the mask-weighting calculation.
======================================================================
                  BAT GRB EVENT DATA PROCESSING REPORT
    Process Script Ver: batgrbproduct v2.46
    Process Start Time: Mon Jan 20 04:42:51 EST 2014
             Host Name: batevent1
   Current Working Dir: /local/data/batevent/batevent_reproc/trigger302728
======================================================================

  Trigger: 00302728      Segment: 000

  BAT Trigger Time: 224112624   [s; MET]
      Trigger Stop: 224112688   [s; MET]
               UTC: 2008-02-07T21:30:21.441560    [includes UTCF correction]
       Where From?: TDRSS position message

  BAT
    RA: 207.513016835087   Dec: 7.5139985942329  [deg; J2000]

     Catalogged Source?: NO
     Point Source?:      YES
     GRB Indicated?:     YES    [ by BAT flight software ]
     Image S/N Ratio:    15.83
     Image Trigger?:     YES
     Rate S/N Ratio:     0  [ if not an image trigger ]
     Image S/N Ratio:    15.83

  Analysis Position:   [ source = BAT ]
    RA: 207.513016835087   Dec: 7.5139985942329  [deg; J2000]

  Refined Position:   [ source = BAT pre-slew burst ]
    RA: 207.515129773953   Dec: 7.49224929255474  [deg; J2000]
        { 13h 50m 03.6s , +07d 29' 32.1" }
         +/- 1.14950852327648 [arcmin] (estimated 90% radius based on SNR)
         +/- 0.394970094257361 [arcmin] (formal 1-sigma fit error)
    SNR: 24.9271361631863

  Angular difference between the analysis and refined position is 1.310997 arcmin

  Partial Coding Fraction: 1.015625    [ including projection effects ]

  Duration
     T90: 292.460000008345 +/- 7.98527645796442
        Measured from: 30.7840000092983
                   to: 323.244000017643     [s; relative to TRIGTIME]
     T50: 111.840000003576 +/- 19.6082656987265
        Measured from: 77.0040000081062
                   to: 188.844000011683     [s; relative to TRIGTIME]


  Fluence
     Peak Flux  (peak 1 second)
        Measured from: 330.33599999547
                   to: 331.33599999547     [s; relative to TRIGTIME]
     Total Fluence
        Measured from: 5.15999999642372
                   to: 332.891999989748     [s; relative to TRIGTIME]

             Band 1     Band 2     Band 3     Band 4
              15-25      25-50     50-100    100-350     keV
 Total     3.077512   4.053600   2.929785   0.617283
           0.095627   0.099712   0.087707   0.074592 [error]
 Peak      0.025363   0.047041   0.040416   0.022408
           0.011917   0.012595   0.011467   0.008859 [error]

     [ fluence units of on-axis counts / fully illuminated detector ]

======================================================================


====== Table of the duration information =============================

        Value   tstart    tstop
T100  327.732    5.160  332.892
T90   292.460   30.784  323.244
T50   111.840   77.004  188.844
Peak    1.000  330.336  331.336


====== Spectral Analysis Summary =====================================

Model      : spectral model: simple power-law (PL) and cutoff power-law (CPL)
Ph_index   : photon index: E^{Ph_index}
Ph_90err   : 90% error of the photon index
Epeak      : Epeak in keV
Epeak_90err: 90% error of Epeak
Norm       : normalization at 50 keV in both the PL model and CPL model
Nomr_90err : 90% error of the normalization
chi2       : Chi-Squared
dof        : degree of freedo

=== Time-averaged spectral analysis ===
(Best model with acceptable fit: PL)

Model Ph_index Ph_90err_low Ph_90err_hi  Epeak  Epeak_90err_low  Epeak_90err_hi  Norm       Nomr_90err_low    Norm_90err_hi    chi2    dof
PL      -1.561    -0.058      0.058       -           -               -         2.08e-03     -6.40e-05          6.40e-05      63.510   57
CPL     -1.246    -0.231      0.244      124.610     -32.923       180.415      2.94e-03     -6.46e-04          8.84e-04      57.990   56


=== 1-s peak spectral analysis ===
(Best model with acceptable fit: PL)

Model Ph_index Ph_90err_low Ph_90err_hi  Epeak  Epeak_90err_low  Epeak_90err_hi  Norm       Nomr_90err_low    Norm_90err_hi    chi2    dof
PL      -1.417     -0.481     0.486       -           -               -         8.99e-03     -2.53e-03          2.52e-03      42.660   57
CPL     -0.989     -1.456     2.667      127.371    -127.371      -127.371      1.44e-02     -7.83e-03          2.32e-01      42.500   56


=== Fluence/Peak Flux Summary ===

              Model    Band1     Band2     Band3     Band4     Band5     Total
                       15-25     25-50    50-100    100-350    15-150    15-350    keV
Fluence         PL   9.19e-07  1.63e-06  2.21e-06  6.17e-06  6.40e-06  1.09e-05   erg/cm2
      90%_error_low -5.31e-08 -5.49e-08 -8.83e-08 -5.38e-07 -2.11e-07 -5.96e-07   erg/cm2
      90%_error_hi   5.43e-08  5.48e-08  8.81e-08  5.73e-07  2.11e-07  6.24e-07   erg/cm2
Peak flux       PL   3.42e-01  3.61e-01  2.71e-01  3.28e-01  1.10e+00  1.30e+00   ph/cm2/s
      90%_error_low -1.62e-01 -1.19e-01 -8.91e-02 -1.77e-01 -3.26e-01 -3.66e-01   ph/cm2/s
      90%_error_hi   1.90e-01  1.15e-01  8.64e-02  2.63e-01  3.29e-01  3.68e-01   ph/cm2/s

Fluence        CPL   8.60e-07  1.66e-06  2.25e-06  3.96e-06  6.23e-06  8.73e-06   erg/cm2
      90%_error_low -6.70e-08 -6.15e-08 -9.50e-08 -1.04e-06 -2.43e-07 -1.06e-06   erg/cm2
      90%_error_hi   6.82e-08  6.20e-08  9.58e-08  1.49e-06  2.42e-07  1.50e-06   erg/cm2
Peak flux      CPL   3.12e-01  3.75e-01  2.85e-01  2.17e-01  1.08e+00  1.19e+00   ph/cm2/s
      90%_error_low -1.97e-01 -1.24e-01 -9.85e-02 -2.17e-01 -3.34e-01 -4.16e-01   ph/cm2/s
      90%_error_hi   2.13e-01  1.39e-01  1.12e-01  1.81e-01  3.36e-01  4.57e-01   ph/cm2/s

======================================================================
Image
Pre-slew 15.0-350.0 keV image (Event data)
#   RAcent    DECcent   POSerr    Theta     Phi              Peak Cts       SNR   Name
  207.5151     7.4922   0.0077    10.0972    -1.6013         2.4510182     24.927 TRIG_00302728

Foreground time interval of the image:
  5.160  73.901 (delta_t =  68.741 [sec])
Background time interval of the image:
-132.499   5.160 (delta_t = 137.659 [sec])
Light Curves
Note: The mask-weighted lightcurves have units of either count/det or counts/sec/det, where a det is 0.4 x 0.4 = 0.16 sq cm.
Full-time range; 1 s binning
Other quick-look light curves:
- 64 ms binning (zoomed)
- 16 ms binning (zoomed)
- 8 ms binning (zoomed)
- 2 ms binning (zoomed)
- SN=5 or 10 s binning (full-time range)
- Raw light curve
Spectra
- 64 ms binning (zoomed)
- 16 ms binning (zoomed)
- 8 ms binning (zoomed)
- 2 ms binning (zoomed)
- SN=5 or 10 s binning (full-time range)
- Raw light curve
Spectra
Notes:
- 1) The fitting includes the systematic errors.
- 2) When the burst includes telescope slew time periods, the fitting uses an average response file made from multiple 5-s response files through out the slew time plus single time preiod for the non-slew times, and weighted by the total counts in the corresponding time period using addrmf. An average response file is needed becuase a spectral fit using the pre-slew DRM will introduce some errors in both a spectral shape and a normalization if the PHA file contains a lot of the slew/post-slew time interval.
- 3) For fits to more complicated models (e.g. a power-law over a cutoff power-law), the BAT team has decided to require a chi-square improvement of more than 6 for each extra dof.
Time averaged spectrum fit using the average DRM
Power-law model
Time interval is from    5.160 sec. to  332.892 sec.

Spectral model in power-law:
------------------------------------------------------------
Parameters  : value       lower 90%   higher 90%
Photon index: -1.56063     ( -0.0581782   0.0580422 )
Norm@50keV  : 2.07582E-03    ( -6.40214e-05   6.39756e-05 )
------------------------------------------------------------
#Fit statistic : Chi-Squared =          63.51 using 59 PHA bins.
# Reduced chi-squared =          1.114 for     57 degrees of freedom
# Null hypothesis probability =   2.579988e-01

Photon flux (15-150 keV)    in 327.7 sec: 0.263610 ( -0.008657  0.008678 ) ph/cm2/s
Energy fluence (15-150 keV)             : 6.39523e-06 ( -2.10845e-07  2.11499e-07 ) ergs/cm2
Cutoff power-law model
Time interval is from    5.160 sec. to  332.892 sec.
Spectral model in the cutoff power-law:
------------------------------------------------------------
Parameters  : value       lower 90%   higher 90%
Photon index: -1.24559     ( -0.230913   0.243782 )
Epeak [keV] : 124.610      ( -32.9227 180.416 )
Norm@50keV  : 2.93960E-03    ( -0.000645791   0.000883942 )
------------------------------------------------------------
#Fit statistic : Chi-Squared =          57.99 using 59 PHA bins.
# Reduced chi-squared =          1.035 for     56 degrees of freedom
# Null hypothesis probability =   4.019365e-01

Photon flux (15-150 keV)    in 327.7 sec: 0.257681 ( -0.009592  0.009617 ) ph/cm2/s
Energy fluence (15-150 keV)             : 6.23112e-06 ( -2.42915e-07  2.42044e-07 ) ergs/cm2
1-s peak spectrum fit
Power-law model
Time interval is from  330.336 sec. to  331.336 sec.

Spectral model in power-law:
------------------------------------------------------------
Parameters  : value       lower 90%   higher 90%
Photon index: -1.41749     ( -0.480682   0.485512 )
Norm@50keV  : 8.99247E-03    ( -0.0025251   0.00252489 )
------------------------------------------------------------
#Fit statistic : Chi-Squared =          42.66 using 59 PHA bins.
# Reduced chi-squared =         0.7484 for     57 degrees of freedom
# Null hypothesis probability =   9.210333e-01

Photon flux (15-150 keV)    in 1 sec: 1.09956 ( -0.326046  0.32926 ) ph/cm2/s
Energy fluence (15-150 keV)             : 8.65964e-08 ( -2.56427e-08  2.58615e-08 ) ergs/cm2
Cutoff power-law model

Time interval is from  330.336 sec. to  331.336 sec.
Spectral model in the cutoff power-law:
------------------------------------------------------------
Parameters  : value       lower 90%   higher 90%
Photon index: -0.988879     ( -1.45596   2.66713 )
Epeak [keV] : 127.371      ( -127.395 -127.395 )
Norm@50keV  : 1.44255E-02    ( -0.00782789   0.231688 )
------------------------------------------------------------
#Fit statistic : Chi-Squared =          42.50 using 59 PHA bins.
# Reduced chi-squared =         0.7590 for     56 degrees of freedom
# Null hypothesis probability =   9.083438e-01

Photon flux (15-150 keV)    in 1 sec: 1.08325 ( -0.334414  0.33636 ) ph/cm2/s
Energy fluence (15-150 keV)             : 8.51432e-08 ( -2.74426e-08  2.66332e-08 ) ergs/cm2
Time-resolved spectra

Distribution
T90 vs. Hardness ratio plot
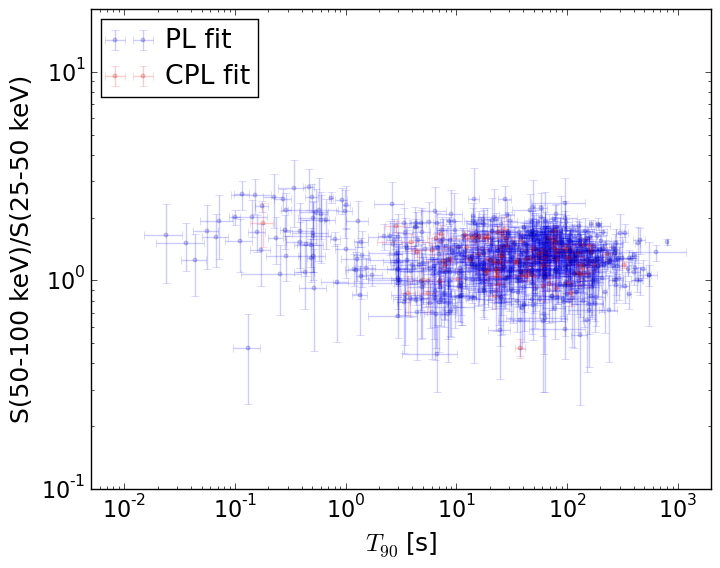
T90                                   = N/A sec.
Hardness ratio (energy fluence ratio) = N/A
S(15-50 keV) vs. S(50-150 keV) plot

S(15-50 keV)  = N/A
S(50-150 keV) = N/A
The dash-dotted line and the dashed line traces the fluences calculated from the Band function with Epeak = 15 and 150 keV, respectively. Both lines assume a canonical values of alpha = -1 and beta = -2.5.
Mask shadow pattern
IMX = 1.780072672979531E-01, IMY = 4.976312632555476E-03
Spacecraft aspect plot

Bright source in the pre-burst/pre-slew/post-slew images
Pre-burst image of 15-350 keV band
Time interval of the image:
-132.499410 5.160000

# RAcent  DECcent POSerr Theta    Phi  PeakCts   SNR AngSep     Name
#  [deg]    [deg]    ['] [deg]  [deg]                   [']
195.1665 -18.7174    2.3  38.1   20.0   0.9055   5.0 ------	UNKNOWN
230.1360  48.8030    2.5  36.5 -152.4   0.7072   4.7 ------	UNKNOWN
230.0218  27.7371    2.2  23.6 -117.9   0.6990   5.2 ------	UNKNOWN
Pre-slew background subtracted image of 15-350 keV band
Time interval of the image:
5.160000 73.900590

# RAcent  DECcent POSerr Theta    Phi  PeakCts   SNR AngSep     Name
#  [deg]    [deg]    ['] [deg]  [deg]                   [']
173.9871  14.1515    2.2  31.8   90.4   0.9860   5.3 ------	UNKNOWN
207.5151   7.4923    0.5  10.1   -1.6   2.4510  24.9 ------	UNKNOWN
242.9278   3.0138    2.1  38.2  -70.0   1.2185   5.5 ------	UNKNOWN
Post-slew image of 15-350 keV band
Time interval of the image:
112.100600 194.900590

# RAcent  DECcent POSerr Theta    Phi  PeakCts   SNR AngSep     Name
#  [deg]    [deg]    ['] [deg]  [deg]                   [']
254.4207  35.2741    5.1  51.1 -143.2  -0.7884  -2.2    4.5	Her X-1
174.0160  34.5251    3.5  41.0  122.9   1.1335   3.3 ------	UNKNOWN
171.3349  -3.9961    2.0  37.9   60.3   1.5004   5.8 ------	UNKNOWN
207.5084   7.4818    0.3   0.0  -28.9   3.3205  34.7 ------	UNKNOWN
208.5433 -45.3028    2.0  52.8  -14.1   1.5424   5.8 ------	UNKNOWN
227.6220 -39.2160    2.3  50.3  -33.5   1.4511   5.1 ------	UNKNOWN
248.2060   2.2147    2.4  40.9  -97.9   2.0214   4.9 ------	UNKNOWN