Analysis Summary
Notes:
- 1) No attempt has been made to eliminate the non-significant decimal places.
- 2) This batgrbproduct analysis is done using the HEASARC data.
- 3) This batgrbproduct analysis is using the flight position for the mask-weighting calculation.
======================================================================
BAT GRB EVENT DATA PROCESSING REPORT
Process Script Ver: batgrbproduct v2.46
Process Start Time: Mon Jan 20 04:34:11 EST 2014
Host Name: batevent1
Current Working Dir: /local/data/batevent/batevent_reproc/trigger302888
======================================================================
Trigger: 00302888 Segment: 000
BAT Trigger Time: 224322608 [s; MET]
Trigger Stop: 224322688 [s; MET]
UTC: 2008-02-10T07:50:05.435780 [includes UTCF correction]
Where From?: TDRSS position message
BAT
RA: 251.269750345052 Dec: 13.8302696590224 [deg; J2000]
Catalogged Source?: NO
Point Source?: YES
GRB Indicated?: YES [ by BAT flight software ]
Image S/N Ratio: 17.85
Image Trigger?: YES
Rate S/N Ratio: 0 [ if not an image trigger ]
Image S/N Ratio: 17.85
Analysis Position: [ source = BAT ]
RA: 251.269750345052 Dec: 13.8302696590224 [deg; J2000]
Refined Position: [ source = BAT pre-slew burst ]
RA: 251.260042347957 Dec: 13.8246798058874 [deg; J2000]
{ 16h 45m 02.4s , +13d 49' 28.8" }
+/- 1.04893127348964 [arcmin] (estimated 90% radius based on SNR)
+/- 0.384236052001109 [arcmin] (formal 1-sigma fit error)
SNR: 28.4105577698154
Angular difference between the analysis and refined position is 0.657564 arcmin
Partial Coding Fraction: 0.734375 [ including projection effects ]
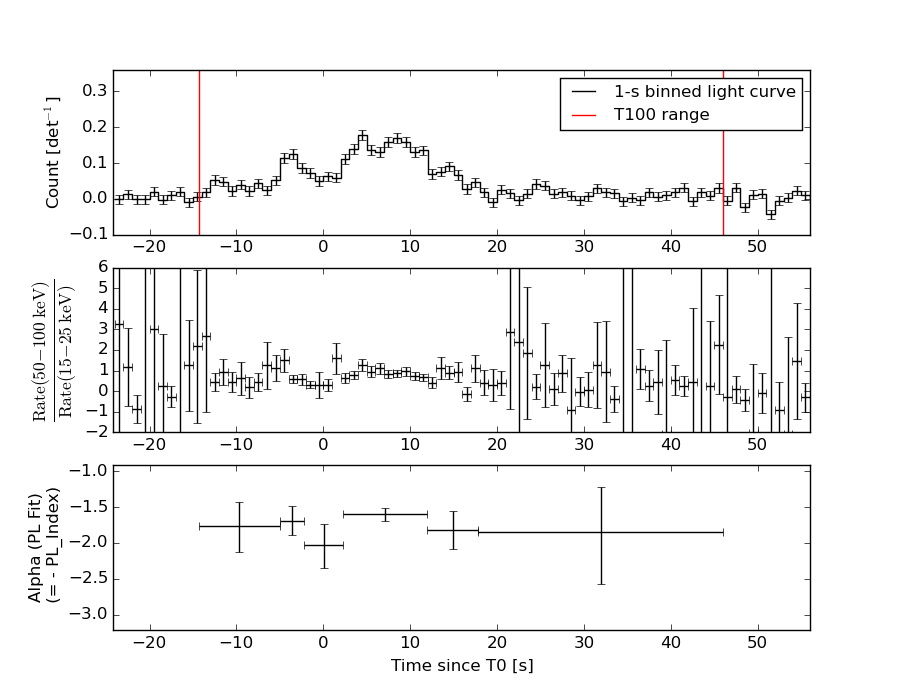
Duration
T90: 42.2639999985695 +/- 11.3673740317139
Measured from: -9.96799999475479
to: 32.2960000038147 [s; relative to TRIGTIME]
T50: 11.8039999902248 +/- 2.08513694431325
Measured from: -0.0839999914169312
to: 11.7199999988079 [s; relative to TRIGTIME]
Fluence
Peak Flux (peak 1 second)
Measured from: 4.50400000810623
to: 5.50400000810623 [s; relative to TRIGTIME]
Total Fluence
Measured from: -14.2639999985695
to: 46.0239999890327 [s; relative to TRIGTIME]
Band 1 Band 2 Band 3 Band 4
15-25 25-50 50-100 100-350 keV
Total 0.946831 1.184332 0.731852 0.245239
0.050404 0.053645 0.049398 0.049587 [error]
Peak 0.045826 0.066274 0.066179 0.017083
0.006916 0.007754 0.007278 0.006643 [error]
[ fluence units of on-axis counts / fully illuminated detector ]
======================================================================
====== Table of the duration information =============================
Value tstart tstop
T100 60.288 -14.264 46.024
T90 42.264 -9.968 32.296
T50 11.804 -0.084 11.720
Peak 1.000 4.504 5.504
====== Spectral Analysis Summary =====================================
Model : spectral model: simple power-law (PL) and cutoff power-law (CPL)
Ph_index : photon index: E^{Ph_index}
Ph_90err : 90% error of the photon index
Epeak : Epeak in keV
Epeak_90err: 90% error of Epeak
Norm : normalization at 50 keV in both the PL model and CPL model
Nomr_90err : 90% error of the normalization
chi2 : Chi-Squared
dof : degree of freedo
=== Time-averaged spectral analysis ===
(Best model with acceptable fit: PL)
Model Ph_index Ph_90err_low Ph_90err_hi Epeak Epeak_90err_low Epeak_90err_hi Norm Nomr_90err_low Norm_90err_hi chi2 dof
PL -1.716 -0.109 0.107 - - - 3.23e-03 -1.95e-04 1.93e-04 53.020 57
CPL -1.714 -0.110 0.145 9999.060 -9999.050 -9999.060 3.24e-03 -1.46e-03 1.11e-03 53.030 56
=== 1-s peak spectral analysis ===
(Best model with acceptable fit: PL)
Model Ph_index Ph_90err_low Ph_90err_hi Epeak Epeak_90err_low Epeak_90err_hi Norm Nomr_90err_low Norm_90err_hi chi2 dof
PL -1.275 -0.207 0.208 - - - 1.34e-02 -1.54e-03 1.54e-03 50.410 57
CPL -1.193 N/A N/A 531.191 N/A N/A 1.46e-02 N/A N/A 50.450 56
=== Fluence/Peak Flux Summary ===
Model Band1 Band2 Band3 Band4 Band5 Total
15-25 25-50 50-100 100-350 15-150 15-350 keV
Fluence PL 3.05e-07 4.91e-07 5.98e-07 1.43e-06 1.80e-06 2.82e-06 erg/cm2
90%_error_low -2.85e-08 -2.75e-08 -4.98e-08 -2.41e-07 -1.14e-07 -2.84e-07 erg/cm2
90%_error_hi 2.93e-08 2.75e-08 4.99e-08 2.73e-07 1.15e-07 3.09e-07 erg/cm2
Peak flux PL 4.43e-01 5.10e-01 4.21e-01 5.85e-01 1.59e+00 1.96e+00 ph/cm2/s
90%_error_low -9.32e-02 -6.71e-02 -5.95e-02 -1.59e-01 -1.86e-01 -2.36e-01 ph/cm2/s
90%_error_hi 9.95e-02 6.60e-02 5.85e-02 1.93e-01 1.86e-01 2.41e-01 ph/cm2/s
Fluence CPL 3.11e-07 4.88e-07 5.97e-07 1.65e-06 1.82e-06 2.82e-06 erg/cm2
90%_error_low N/A N/A N/A N/A -1.38e-07 -5.30e-07 erg/cm2
90%_error_hi N/A N/A N/A N/A 9.08e-08 3.05e-07 erg/cm2
Peak flux CPL 4.44e-01 5.10e-01 4.21e-01 5.82e-01 1.59e+00 1.97e+00 ph/cm2/s
90%_error_low -1.13e-01 -6.71e-02 -5.87e-02 N/A -9.59e-02 -4.63e-01 ph/cm2/s
90%_error_hi 9.89e-02 7.34e-02 6.69e-02 N/A 1.85e-01 2.32e-01 ph/cm2/s
======================================================================
Image
Pre-slew 15.0-350.0 keV image (Event data)
#   RAcent    DECcent   POSerr    Theta     Phi              Peak Cts       SNR   Name
  251.2600    13.8247   0.0068    32.6131    -5.2418         3.2025242     28.411 TRIG_00302888

Foreground time interval of the image:
-14.264  46.024 (delta_t =  60.288 [sec])
Background time interval of the image:
-365.799 -267.890 (delta_t =  97.909 [sec])
-239.000 -14.264 (delta_t = 224.736 [sec])
Light Curves
Note: The mask-weighted lightcurves have units of either count/det or counts/sec/det, where a det is 0.4 x 0.4 = 0.16 sq cm.
Full-time range; 1 s binning
Other quick-look light curves:
- 64 ms binning (zoomed)
- 16 ms binning (zoomed)
- 8 ms binning (zoomed)
- 2 ms binning (zoomed)
- SN=5 or 10 s binning (full-time range)
- Raw light curve
Spectra
- 64 ms binning (zoomed)
- 16 ms binning (zoomed)
- 8 ms binning (zoomed)
- 2 ms binning (zoomed)
- SN=5 or 10 s binning (full-time range)
- Raw light curve
Spectra
Notes:
- 1) The fitting includes the systematic errors.
- 2) When the burst includes telescope slew time periods, the fitting uses an average response file made from multiple 5-s response files through out the slew time plus single time preiod for the non-slew times, and weighted by the total counts in the corresponding time period using addrmf. An average response file is needed becuase a spectral fit using the pre-slew DRM will introduce some errors in both a spectral shape and a normalization if the PHA file contains a lot of the slew/post-slew time interval.
- 3) For fits to more complicated models (e.g. a power-law over a cutoff power-law), the BAT team has decided to require a chi-square improvement of more than 6 for each extra dof.
Time averaged spectrum fit using the average DRM
Power-law model
Time interval is from  -14.264 sec. to   46.024 sec.

Spectral model in power-law:
------------------------------------------------------------
Parameters  : value       lower 90%   higher 90%
Photon index: -1.71641     ( -0.108812   0.107387 )
Norm@50keV  : 3.23203E-03    ( -0.000194764   0.000193033 )
------------------------------------------------------------
#Fit statistic : Chi-Squared =          53.02 using 59 PHA bins.
# Reduced chi-squared =         0.9301 for     57 degrees of freedom
# Null hypothesis probability =   6.252694e-01

Photon flux (15-150 keV)    in 60.29 sec: 0.431759 ( -0.024388  0.024442 ) ph/cm2/s
Energy fluence (15-150 keV)             : 1.80221e-06 ( -1.13885e-07  1.1494e-07 ) ergs/cm2
Cutoff power-law model

Time interval is from  -14.264 sec. to   46.024 sec.
Spectral model in the cutoff power-law:
------------------------------------------------------------
Parameters  : value       lower 90%   higher 90%
Photon index: -1.71447     ( -0.110015   0.144743 )
Epeak [keV] : 9999.06      ( -9999.33 -9999.34 )
Norm@50keV  : 3.23553E-03    ( -0.00145894   0.00111071 )
------------------------------------------------------------
#Fit statistic : Chi-Squared =          53.03 using 59 PHA bins.
# Reduced chi-squared =         0.9469 for     56 degrees of freedom
# Null hypothesis probability =   5.881514e-01

Photon flux (15-150 keV)    in 60.29 sec: 0.435196 ( -0.027857  0.020959 ) ph/cm2/s
Energy fluence (15-150 keV)             : 1.82421e-06 ( -1.38066e-07  9.0816e-08 ) ergs/cm2
1-s peak spectrum fit
Power-law model
Time interval is from    4.504 sec. to    5.504 sec.

Spectral model in power-law:
------------------------------------------------------------
Parameters  : value       lower 90%   higher 90%
Photon index: -1.27455     ( -0.207388   0.208018 )
Norm@50keV  : 1.33552E-02    ( -0.00153988   0.00153544 )
------------------------------------------------------------
#Fit statistic : Chi-Squared =          50.41 using 59 PHA bins.
# Reduced chi-squared =         0.8844 for     57 degrees of freedom
# Null hypothesis probability =   7.188926e-01

Photon flux (15-150 keV)    in 1 sec: 1.58610 ( -0.18552  0.18588 ) ph/cm2/s
Energy fluence (15-150 keV)             : 1.32828e-07 ( -1.73019e-08  1.74724e-08 ) ergs/cm2
Cutoff power-law model
Time interval is from    4.504 sec. to    5.504 sec.
Spectral model in the cutoff power-law:
------------------------------------------------------------
Parameters  : value       lower 90%   higher 90%
Photon index: -1.19333     (       )
Epeak [keV] : 531.191      (   )
Norm@50keV  : 1.46081E-02    (     )
------------------------------------------------------------
#Fit statistic : Chi-Squared =          50.45 using 59 PHA bins.
# Reduced chi-squared =         0.9009 for     56 degrees of freedom
# Null hypothesis probability =   6.840343e-01

Photon flux (15-150 keV)    in 1 sec: 1.58679 ( -0.09588  0.18525 ) ph/cm2/s
Energy fluence (15-150 keV)             : 1.32892e-07 ( -1.84014e-08  1.51654e-08 ) ergs/cm2
Time-resolved spectra
Distribution
T90 vs. Hardness ratio plot
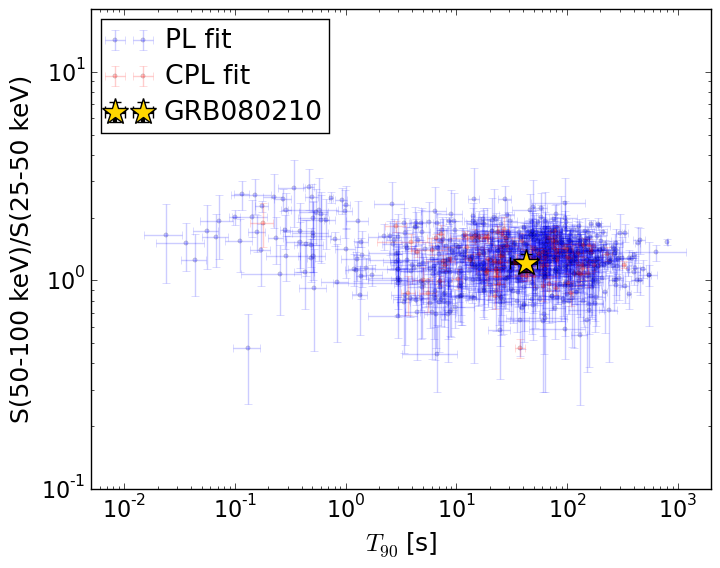
T90                                   = 42.264 sec.
Hardness ratio (energy fluence ratio) = 1.21725057024
S(15-50 keV) vs. S(50-150 keV) plot
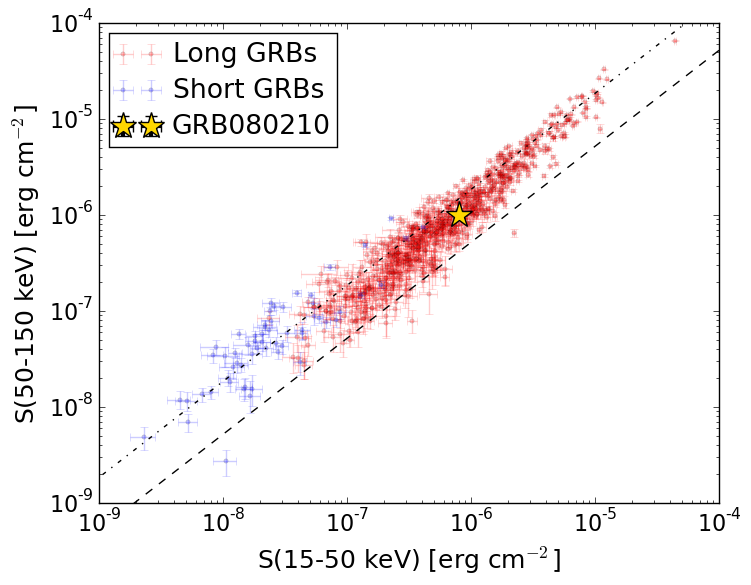
S(15-50 keV)  = 7.96106e-07
S(50-150 keV) = 1.0060845e-06
The dash-dotted line and the dashed line traces the fluences calculated from the Band function with Epeak = 15 and 150 keV, respectively. Both lines assume a canonical values of alpha = -1 and beta = -2.5.
Mask shadow pattern
IMX = 6.371740446585199E-01, IMY = 5.845579753707202E-02
Spacecraft aspect plot
Bright source in the pre-burst/pre-slew/post-slew images
Pre-burst image of 15-350 keV band
Time interval of the image:
-365.799400 -267.890000
-239.000000 -14.264000

# RAcent  DECcent POSerr Theta    Phi  PeakCts   SNR AngSep     Name
#  [deg]    [deg]    ['] [deg]  [deg]                   [']
254.2862  35.3895    8.4  10.9   -0.3   0.3328   1.4    8.8	Her X-1
268.4204  -1.3706    5.7  48.1  -31.7   1.1746   2.0    5.8	SW J1753.5-0127
288.8578  10.9470    8.4  43.5  -64.5   1.7392   1.4    3.5	GRS 1915+105
299.5873  35.1938    0.7  32.7 -103.9   7.6596  17.6    0.5	Cyg X-1
308.0461  40.9443    2.2  35.8 -118.5   2.3876   5.4    2.9	Cyg X-3
274.6472  -4.5640    2.7  52.5  -38.8   4.9999   4.3 ------	UNKNOWN
333.8677  44.5533    4.1  51.1 -135.7   3.3928   2.8 ------	UNKNOWN
Pre-slew background subtracted image of 15-350 keV band
Time interval of the image:
-14.264000 46.024000

# RAcent  DECcent POSerr Theta    Phi  PeakCts   SNR AngSep     Name
#  [deg]    [deg]    ['] [deg]  [deg]                   [']
254.3164  35.4782    6.7  10.8   -0.3   0.1528   1.7   10.7	Her X-1
268.2839  -1.4414    6.5  48.1  -31.5  -0.4166  -1.8    5.1	SW J1753.5-0127
288.9531  11.0025   10.5  43.5  -64.6  -0.4255  -1.1    9.7	GRS 1915+105
299.6166  35.1802    8.4  32.7 -103.9  -0.2403  -1.4    1.8	Cyg X-1
308.0040  40.8370    6.0  35.8 -118.3  -0.3192  -1.9    8.4	Cyg X-3
212.3093  61.7270    2.5  30.6  119.7   0.7222   4.6 ------	UNKNOWN
 59.0384  78.4053    2.3  55.2  166.5   2.5357   5.1 ------	UNKNOWN
251.2601  13.8247    0.4  32.6   -5.2   3.2028  28.4 ------	UNKNOWN
279.3414  29.7284    2.2  23.0  -70.8   0.5804   5.2 ------	UNKNOWN
Post-slew image of 15-350 keV band
Time interval of the image:
141.300600 457.800630

# RAcent  DECcent POSerr Theta    Phi  PeakCts   SNR AngSep     Name
#  [deg]    [deg]    ['] [deg]  [deg]                   [']
244.9726 -15.6331    0.2  30.1   -6.5  17.1614  55.7    0.6	Sco X-1
254.3279  35.4575   20.1  21.8  168.1   0.1652   0.6    9.4	Her X-1
256.0233 -37.8146    4.4  51.8  -23.5   1.9204   2.6    2.5	4U 1700-377
256.6072 -36.3920   23.2  50.5  -24.3  -0.3265  -0.5    8.5	GX 349+2
262.9454 -24.8763   16.0  40.3  -35.2  -0.3305  -0.7    8.6	GX 1+4
268.3083  -1.5801    7.3  22.9  -67.6   0.5238   1.6    8.4	SW J1753.5-0127
270.2677 -25.1333   13.5  43.1  -44.2   0.5014   0.9    3.4	GX 5-1
270.2758 -25.8727    5.4  43.8  -43.7  -1.3523  -2.1    7.9	GRS 1758-258
273.9091 -13.9391    3.8  35.7  -58.5  -1.4584  -3.1    8.1	GX 17+2
288.6307  10.9366    6.5  36.6 -108.5   1.1461   1.8    9.9	GRS 1915+105
299.5960  35.1828    1.2  48.3 -143.8   7.3144  10.0    1.2	Cyg X-1
308.0129  40.8094   13.0  56.0 -148.9   1.4878   0.9    9.7	Cyg X-3
263.0379 -33.7207    5.3  48.8  -31.7   1.4294   2.2    7.3	GX 354-0
219.5242 -12.5133    3.0  41.0   32.8   2.2837   3.9 ------	UNKNOWN
227.3301  -8.2745    2.7  32.4   29.8   1.5153   4.3 ------	UNKNOWN
249.7029 -36.4435    2.6  50.3  -17.0   2.8227   4.5 ------	UNKNOWN
244.5319 -44.2417    3.2  58.4  -13.0   6.1972   3.5 ------	UNKNOWN
267.3143 -26.6511    2.0  43.4  -39.8   2.8520   5.7 ------	UNKNOWN