Analysis Summary
Notes:
- 1) No attempt has been made to eliminate the non-significant decimal places.
- 2) This batgrbproduct analysis is done using the HEASARC data.
- 3) This batgrbproduct analysis is using the flight position for the mask-weighting calculation.
======================================================================
                  BAT GRB EVENT DATA PROCESSING REPORT
    Process Script Ver: batgrbproduct v2.46
    Process Start Time: Mon Jan 20 04:10:04 EST 2014
             Host Name: batevent1
   Current Working Dir: /local/data/batevent/batevent_reproc/trigger304379
======================================================================

  Trigger: 00304379      Segment: 000

  BAT Trigger Time: 225997502.144   [s; MET]
      Trigger Stop: 225997503.168   [s; MET]
               UTC: 2008-02-29T17:04:59.534140    [includes UTCF correction]
       Where From?: TDRSS position message

  BAT
    RA: 228.216781802381   Dec: -14.7122099614831  [deg; J2000]

     Catalogged Source?: NO
     Point Source?:      YES
     GRB Indicated?:     YES    [ by BAT flight software ]
     Image S/N Ratio:    10.25
     Image Trigger?:     NO
     Rate S/N Ratio:     25.4558441227157  [ if not an image trigger ]
     Image S/N Ratio:    10.25

  Analysis Position:   [ source = BAT ]
    RA: 228.216781802381   Dec: -14.7122099614831  [deg; J2000]

  Refined Position:   [ source = BAT pre-slew burst ]
    RA: 228.217202049544   Dec: -14.6986805700422  [deg; J2000]
        { 15h 12m 52.1s , -14d 41' 55.3" }
         +/- 1.49793324965752 [arcmin] (estimated 90% radius based on SNR)
         +/- 0.712984851448159 [arcmin] (formal 1-sigma fit error)
    SNR: 17.0771292084207

  Angular difference between the analysis and refined position is 0.812130 arcmin

  Partial Coding Fraction: 0.1875    [ including projection effects ]

  Duration
     T90: 64 +/- 16
        Measured from: -15.1439999938011
                   to: 48.8560000061989     [s; relative to TRIGTIME]
     T50: 16 +/- 16
        Measured from: 16.8560000061989
                   to: 32.8560000061989     [s; relative to TRIGTIME]


  Fluence
     Peak Flux  (peak 1 second)
        Measured from: 40.3560000061989
                   to: 41.3560000061989     [s; relative to TRIGTIME]
     Total Fluence
        Measured from: -15.1439999938011
                   to: 80.8560000061989     [s; relative to TRIGTIME]

             Band 1     Band 2     Band 3     Band 4
              15-25      25-50     50-100    100-350     keV
 Total     4.942118   5.874404   3.648288   0.981153
           0.102324   0.107410   0.093773   0.076839 [error]
 Peak      0.276691   0.341468   0.212336   0.042842
           0.012754   0.013540   0.011470   0.007661 [error]

     [ fluence units of on-axis counts / fully illuminated detector ]

======================================================================


====== Table of the duration information =============================

        Value   tstart    tstop
T100   96.000  -15.144   80.856
T90    64.000  -15.144   48.856
T50    16.000   16.856   32.856
Peak    1.000   40.356   41.356


====== Spectral Analysis Summary =====================================

Model      : spectral model: simple power-law (PL) and cutoff power-law (CPL)
Ph_index   : photon index: E^{Ph_index}
Ph_90err   : 90% error of the photon index
Epeak      : Epeak in keV
Epeak_90err: 90% error of Epeak
Norm       : normalization at 50 keV in both the PL model and CPL model
Nomr_90err : 90% error of the normalization
chi2       : Chi-Squared
dof        : degree of freedo

=== Time-averaged spectral analysis ===
(Best model with acceptable fit: PL)

Model Ph_index Ph_90err_low Ph_90err_hi  Epeak  Epeak_90err_low  Epeak_90err_hi  Norm       Nomr_90err_low    Norm_90err_hi    chi2    dof
PL      -1.813    -0.051      0.051       -           -               -         1.03e-02     -2.67e-04          2.67e-04      57.820   57
CPL     -1.813    -0.050      0.054     9999.360    -9999.350      -9999.360      1.03e-02     -2.61e-04          1.81e-03      57.830   56


=== 1-s peak spectral analysis ===
(Best model with acceptable fit: PL)

Model Ph_index Ph_90err_low Ph_90err_hi  Epeak  Epeak_90err_low  Epeak_90err_hi  Norm       Nomr_90err_low    Norm_90err_hi    chi2    dof
PL      -1.767     -0.088     0.087       -           -               -         5.53e-02     -2.79e-03          2.78e-03      46.230   57
CPL     -1.543     -0.267     0.354       99.721     -34.954       -99.721      7.20e-02     -1.86e-02          3.67e-02      44.900   56


=== Fluence/Peak Flux Summary ===

              Model    Band1     Band2     Band3     Band4     Band5     Total
                       15-25     25-50    50-100    100-350    15-150    15-350    keV
Fluence         PL   1.70e-06  2.57e-06  2.93e-06  6.36e-06  9.10e-06  1.36e-05   erg/cm2
      90%_error_low -8.40e-08 -7.24e-08 -1.01e-07 -4.86e-07 -2.39e-07 -5.46e-07   erg/cm2
      90%_error_hi   8.59e-08  7.23e-08  1.01e-07  5.13e-07  2.39e-07  5.66e-07   erg/cm2
Peak flux       PL   2.94e+00  2.53e+00  1.49e+00  1.31e+00  7.53e+00  8.27e+00   ph/cm2/s
      90%_error_low -2.38e-01 -1.26e-01 -9.72e-02 -1.67e-01 -3.74e-01 -3.91e-01   ph/cm2/s
      90%_error_hi   2.44e-01  1.26e-01  9.68e-02  1.81e-01  3.74e-01  3.91e-01   ph/cm2/s

Fluence        CPL   1.71e-06  2.57e-06  2.93e-06  6.35e-06  9.13e-06  1.36e-05   erg/cm2
      90%_error_low -1.06e-07 -6.90e-08 -1.35e-07    N/A    -3.64e-07 -1.37e-06   erg/cm2
      90%_error_hi   7.28e-08  1.08e-07  1.48e-07    N/A     2.85e-07  5.14e-07   erg/cm2
Peak flux      CPL   2.83e+00  2.58e+00  1.51e+00  1.00e+00  7.43e+00  7.92e+00   ph/cm2/s
      90%_error_low -2.87e-01 -1.46e-01 -1.03e-01 -3.23e-01 -3.97e-01 -5.41e-01   ph/cm2/s
      90%_error_hi   2.92e-01  1.48e-01  1.05e-01  3.72e-01  3.97e-01  6.04e-01   ph/cm2/s

======================================================================
Image
Pre-slew 15.0-350.0 keV image (Event data)
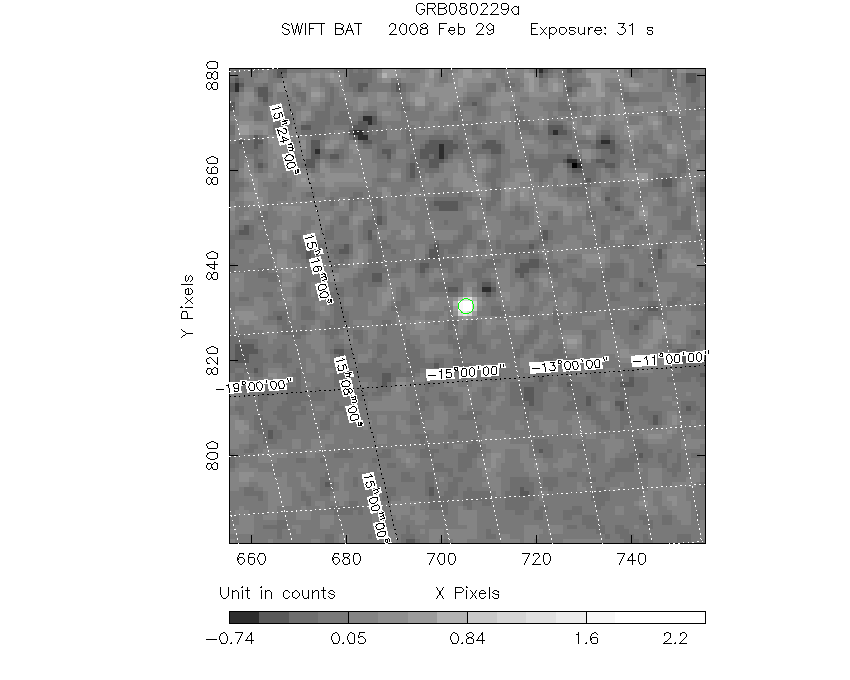
#   RAcent    DECcent   POSerr    Theta     Phi              Peak Cts       SNR   Name
  228.2172   -14.6987   0.0112    39.7182   -63.8193         2.7433711     17.077 TRIG_00304379

Foreground time interval of the image:
-15.144  15.957 (delta_t =  31.101 [sec])
Background time interval of the image:
-653.843 -647.045 (delta_t =   6.799 [sec])
-239.144 -15.144 (delta_t = 224.000 [sec])
Light Curves
Note: The mask-weighted lightcurves have units of either count/det or counts/sec/det, where a det is 0.4 x 0.4 = 0.16 sq cm.
Full-time range; 1 s binning
Other quick-look light curves:
- 64 ms binning (zoomed)
- 16 ms binning (zoomed)
- 8 ms binning (zoomed)
- 2 ms binning (zoomed)
- SN=5 or 10 s binning (full-time range)
- Raw light curve
Spectra
- 64 ms binning (zoomed)
- 16 ms binning (zoomed)
- 8 ms binning (zoomed)
- 2 ms binning (zoomed)
- SN=5 or 10 s binning (full-time range)
- Raw light curve
Spectra
Notes:
- 1) The fitting includes the systematic errors.
- 2) When the burst includes telescope slew time periods, the fitting uses an average response file made from multiple 5-s response files through out the slew time plus single time preiod for the non-slew times, and weighted by the total counts in the corresponding time period using addrmf. An average response file is needed becuase a spectral fit using the pre-slew DRM will introduce some errors in both a spectral shape and a normalization if the PHA file contains a lot of the slew/post-slew time interval.
- 3) For fits to more complicated models (e.g. a power-law over a cutoff power-law), the BAT team has decided to require a chi-square improvement of more than 6 for each extra dof.
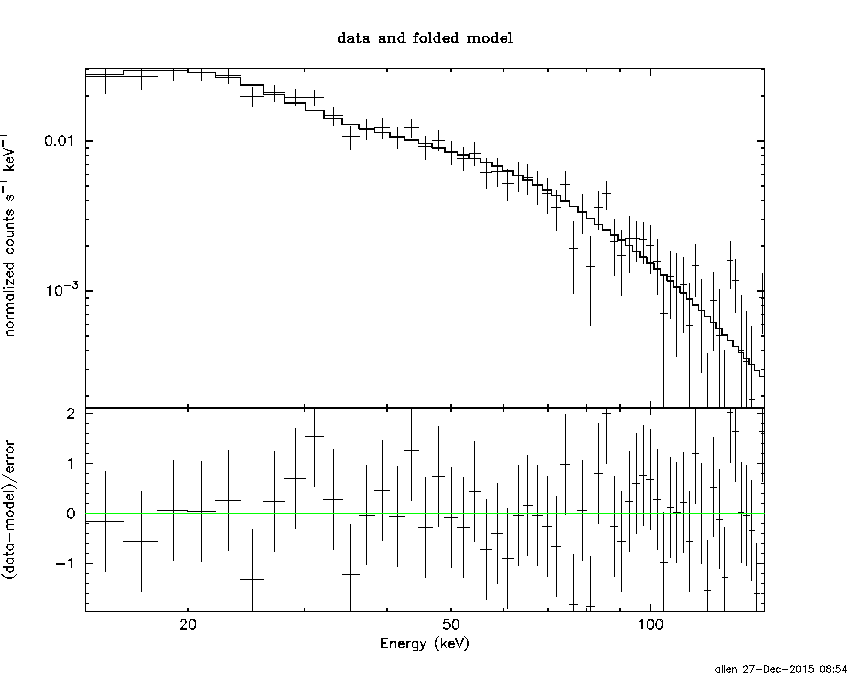
Time averaged spectrum fit using the average DRM
Power-law model
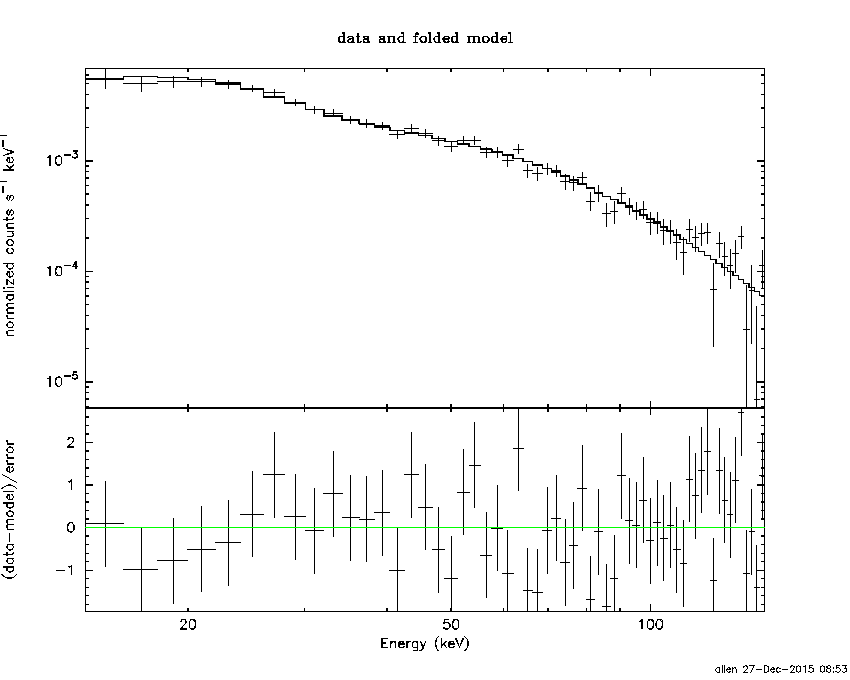
Time interval is from  -15.144 sec. to   80.856 sec.

Spectral model in power-law:
------------------------------------------------------------
Parameters  : value       lower 90%   higher 90%
Photon index: -1.81314     ( -0.0514679   0.0512392 )
Norm@50keV  : 1.02998E-02    ( -0.000266947   0.000266464 )
------------------------------------------------------------
#Fit statistic : Chi-Squared =          57.82 using 59 PHA bins.
# Reduced chi-squared =          1.014 for     57 degrees of freedom
# Null hypothesis probability =   4.447247e-01

Photon flux (15-150 keV)    in 96 sec: 1.42667 ( -0.04185  0.04205 ) ph/cm2/s
Energy fluence (15-150 keV)             : 9.10042e-06 ( -2.3863e-07  2.38817e-07 ) ergs/cm2
Cutoff power-law model
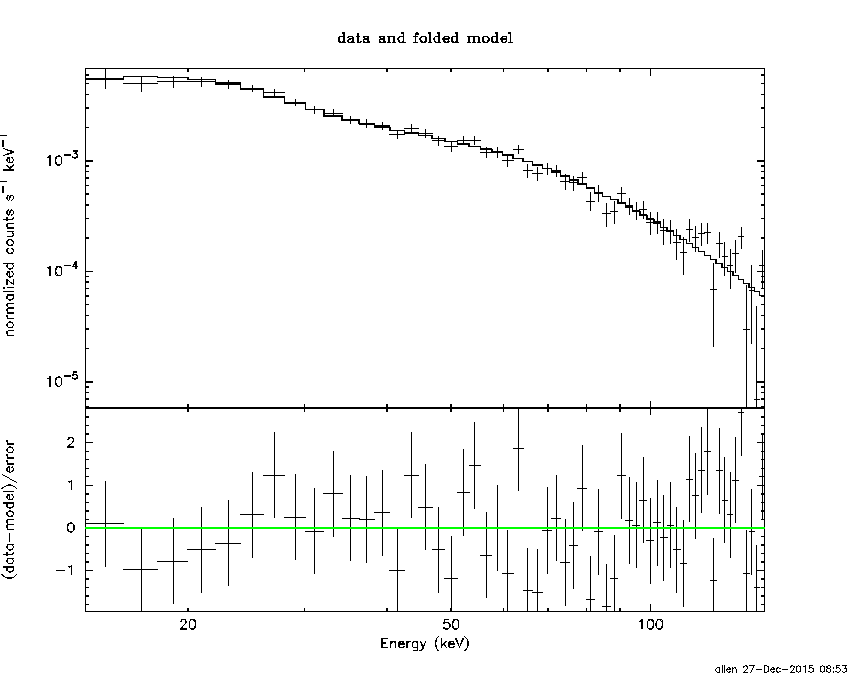
Time interval is from  -15.144 sec. to   80.856 sec.
Spectral model in the cutoff power-law:
------------------------------------------------------------
Parameters  : value       lower 90%   higher 90%
Photon index: -1.81342     ( -0.050871   0.0539837 )
Epeak [keV] : 9999.36      ( -9999.35 -9999.36 )
Norm@50keV  : 1.03066E-02    ( -0.000264628   0.00180835 )
------------------------------------------------------------
#Fit statistic : Chi-Squared =          57.83 using 59 PHA bins.
# Reduced chi-squared =          1.033 for     56 degrees of freedom
# Null hypothesis probability =   4.074460e-01

Photon flux (15-150 keV)    in 96 sec: 1.32057 ( -0.06894  0.05806 ) ph/cm2/s
Energy fluence (15-150 keV)             : 9.12896e-06 ( -3.64375e-07  2.84762e-07 ) ergs/cm2
1-s peak spectrum fit
Power-law model
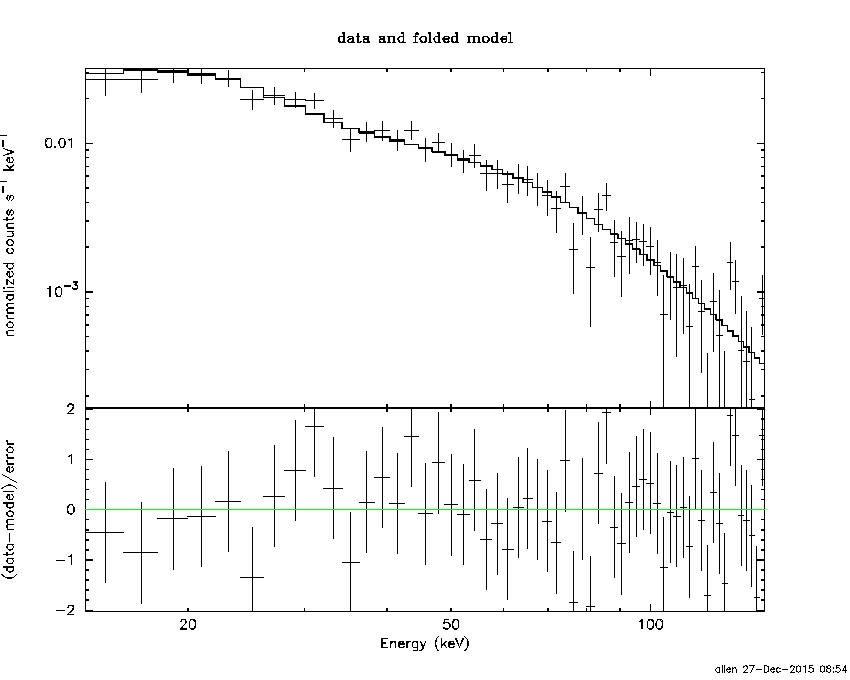
Time interval is from   40.356 sec. to   41.356 sec.

Spectral model in power-law:
------------------------------------------------------------
Parameters  : value       lower 90%   higher 90%
Photon index: -1.7667     ( -0.0879893   0.0869094 )
Norm@50keV  : 5.53066E-02    ( -0.0027927   0.00277806 )
------------------------------------------------------------
#Fit statistic : Chi-Squared =          46.23 using 59 PHA bins.
# Reduced chi-squared =         0.8111 for     57 degrees of freedom
# Null hypothesis probability =   8.452983e-01

Photon flux (15-150 keV)    in 1 sec: 7.52532 ( -0.37367  0.37442 ) ph/cm2/s
Energy fluence (15-150 keV)             : 5.09953e-07 ( -2.64491e-08  2.65844e-08 ) ergs/cm2
Cutoff power-law model
Time interval is from   40.356 sec. to   41.356 sec.
Spectral model in the cutoff power-law:
------------------------------------------------------------
Parameters  : value       lower 90%   higher 90%
Photon index: -1.54347     ( -0.266735   0.354383 )
Epeak [keV] : 99.7208      ( -34.9559 -99.7223 )
Norm@50keV  : 7.20328E-02    ( -0.0186493   0.0366522 )
------------------------------------------------------------
#Fit statistic : Chi-Squared =          44.90 using 59 PHA bins.
# Reduced chi-squared =         0.8018 for     56 degrees of freedom
# Null hypothesis probability =   8.561720e-01

Photon flux (15-150 keV)    in 1 sec: 7.43287 ( -0.39678  0.39711 ) ph/cm2/s
Energy fluence (15-150 keV)             : 5.0106e-07 ( -2.96921e-08  2.95434e-08 ) ergs/cm2
Time-resolved spectra
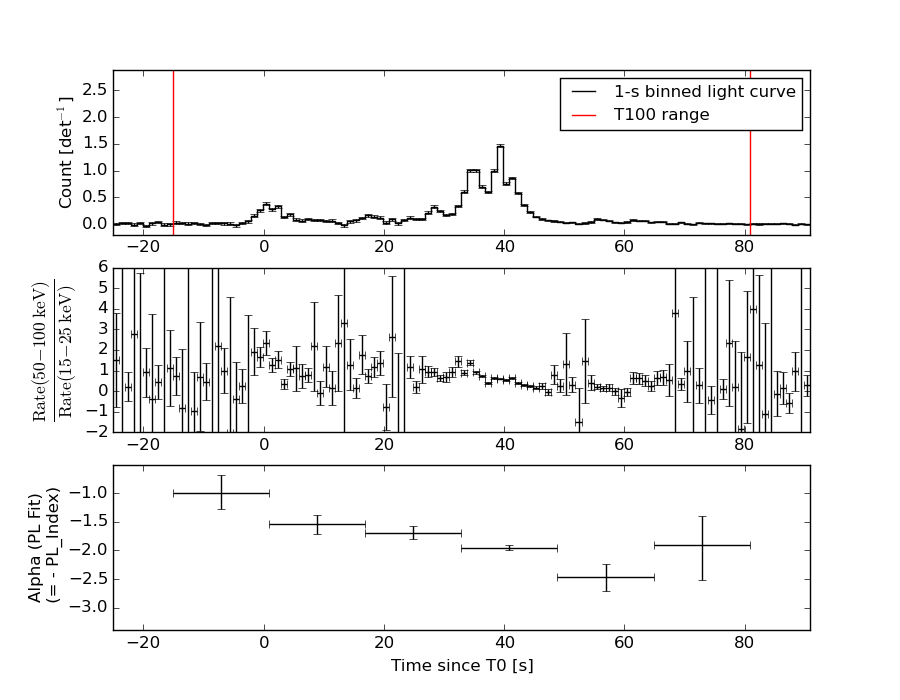
Distribution
T90 vs. Hardness ratio plot
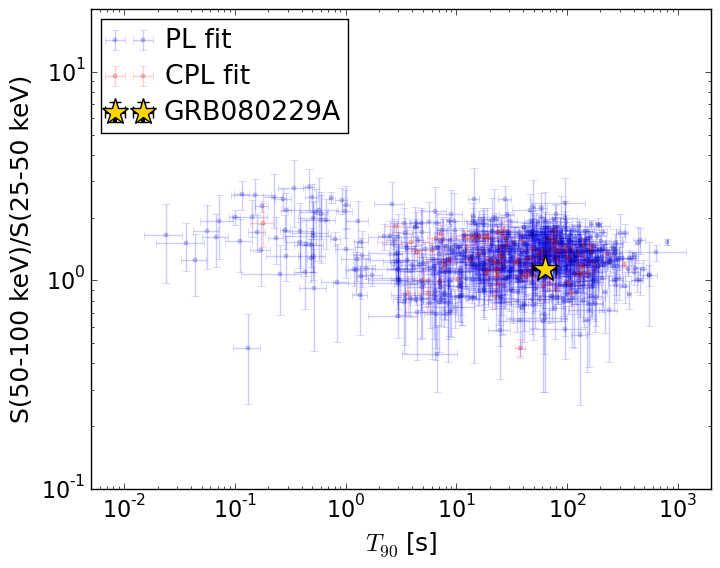
T90                                   = 64.0 sec.
Hardness ratio (energy fluence ratio) = 1.13833481235
S(15-50 keV) vs. S(50-150 keV) plot
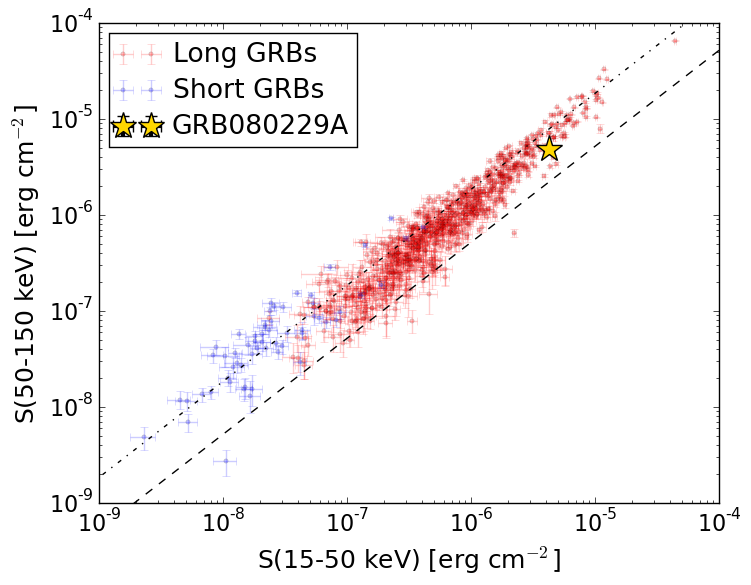
S(15-50 keV)  = 4.270223e-06
S(50-150 keV) = 4.830088e-06
The dash-dotted line and the dashed line traces the fluences calculated from the Band function with Epeak = 15 and 150 keV, respectively. Both lines assume a canonical values of alpha = -1 and beta = -2.5.
Mask shadow pattern
IMX = 3.665309447926398E-01, IMY = 7.455223896173090E-01
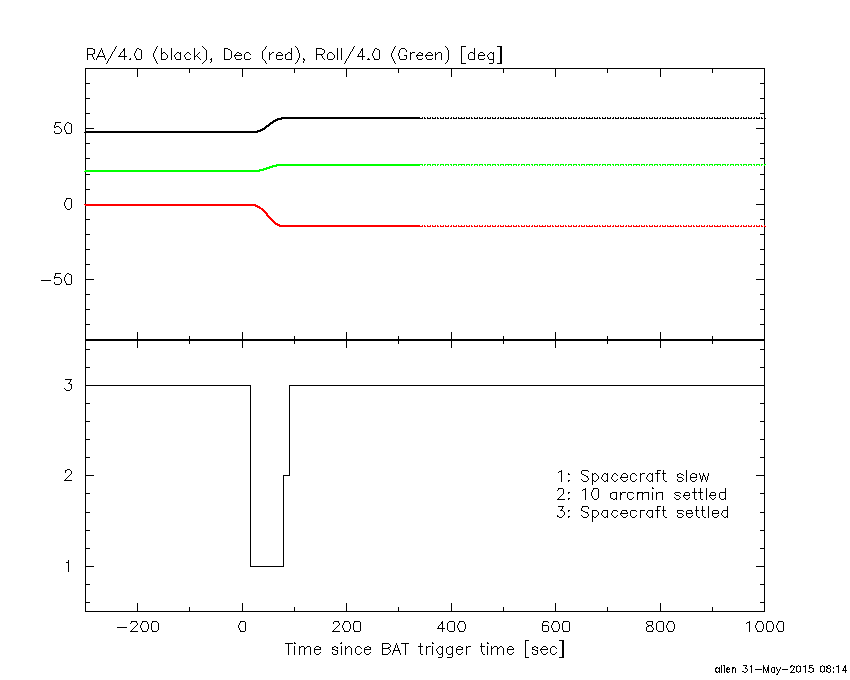
Spacecraft aspect plot
Bright source in the pre-burst/pre-slew/post-slew images
Pre-burst image of 15-350 keV band
Time interval of the image:
-653.843400 -647.044600
-239.144000 -15.144000

# RAcent  DECcent POSerr Theta    Phi  PeakCts   SNR AngSep     Name
#  [deg]    [deg]    ['] [deg]  [deg]                   [']
160.8254 -44.0397    3.1  51.0   30.9   3.3984   3.7 ------	UNKNOWN
170.0664 -51.3615    2.9  53.8   19.2   4.0891   4.0 ------	UNKNOWN
219.2895 -47.2069    2.6  52.9  -20.6   2.2763   4.5 ------	UNKNOWN
229.7491  29.6102    2.3  47.9 -128.9   4.0048   5.0 ------	UNKNOWN
232.4614 -18.7473    3.3  44.9  -60.0   3.0172   3.5 ------	UNKNOWN
Pre-slew background subtracted image of 15-350 keV band
Time interval of the image:
-15.144000 15.956590

# RAcent  DECcent POSerr Theta    Phi  PeakCts   SNR AngSep     Name
#  [deg]    [deg]    ['] [deg]  [deg]                   [']
177.6951  -7.9584    1.9  14.9   63.1   0.3686   6.1 ------	UNKNOWN
228.2172 -14.6987    0.7  39.7  -63.8   2.7430  17.1 ------	UNKNOWN
229.0669  34.6631    2.1  50.2 -134.9   1.7668   5.5 ------	UNKNOWN
Post-slew image of 15-350 keV band
Time interval of the image:
79.356600 962.928800

# RAcent  DECcent POSerr Theta    Phi  PeakCts   SNR AngSep     Name
#  [deg]    [deg]    ['] [deg]  [deg]                   [']
186.6804 -62.7505    2.1  56.1    7.4  26.4813   5.5    1.4	GX 301-2
244.9745 -15.6434    0.1  16.2  -98.6  52.2777  80.7    0.3	Sco X-1
254.5614  35.3175    5.6  55.9 -168.1   4.7727   2.1    5.3	Her X-1
256.1479 -37.7556    6.7  33.8  -55.8   1.6583   1.7    9.3	4U 1700-377
256.6326 -36.2809    0.0  33.3  -58.4  -1.3649  -1.4   12.8	GX 349+2
263.1368 -24.8704    8.4  34.3  -81.3  -1.5541  -1.4   10.2	GX 1+4
264.8838 -44.2952    9.5  42.9  -53.0  -2.0288  -1.2   11.1	4U 1735-44
268.4212  -1.4312    4.7  41.9 -118.8   4.3402   2.4    3.4	SW J1753.5-0127
270.2665 -25.1947    7.5  40.7  -82.4  -4.2447  -1.5    7.0	GX 5-1
270.4234 -25.8502    9.9  41.0  -81.4   3.2288   1.2    9.2	GRS 1758-258
262.8217 -33.7226    0.0  36.6  -66.5  -2.8053  -2.1   10.7	GX 354-0
190.1451 -44.7285    2.8  44.0   25.1   6.4196   4.1 ------	UNKNOWN
229.8389  26.4375    3.8  41.2  168.2   3.5764   3.0 ------	UNKNOWN
188.5825 -64.7526    3.6  56.8    4.9  12.1328   3.2 ------	UNKNOWN
224.2170 -11.2618    3.2   5.2  117.2   1.9788   3.6 ------	UNKNOWN
209.4263 -62.2583    2.8  49.4   -2.7   6.1179   4.1 ------	UNKNOWN
215.6658 -56.7154    3.6  43.1   -4.0   3.3271   3.2 ------	UNKNOWN
261.6409 -59.2839    2.9  50.9  -35.3   7.6382   4.0 ------	UNKNOWN