Analysis Summary
Notes:
- 1) No attempt has been made to eliminate the non-significant decimal places.
- 2) This batgrbproduct analysis is done using the HEASARC data.
- 3) This batgrbproduct analysis is using the flight position for the mask-weighting calculation.
======================================================================
                  BAT GRB EVENT DATA PROCESSING REPORT
    Process Script Ver: batgrbproduct v2.46
    Process Start Time: Mon Jan 20 03:59:06 EST 2014
             Host Name: batevent1
   Current Working Dir: /local/data/batevent/batevent_reproc/trigger305011
======================================================================

  Trigger: 00305011      Segment: 000

  BAT Trigger Time: 226581813.44   [s; MET]
      Trigger Stop: 226581821.632   [s; MET]
               UTC: 2008-03-07T11:23:30.814100    [includes UTCF correction]
       Where From?: TDRSS position message

  BAT
    RA: 136.632785318983   Dec: 35.1682786660791  [deg; J2000]

     Catalogged Source?: NO
     Point Source?:      YES
     GRB Indicated?:     YES    [ by BAT flight software ]
     Image S/N Ratio:    7.15
     Image Trigger?:     NO
     Rate S/N Ratio:     9  [ if not an image trigger ]
     Image S/N Ratio:    7.15

  Analysis Position:   [ source = BAT ]
    RA: 136.632785318983   Dec: 35.1682786660791  [deg; J2000]

  Refined Position:   [ source = BAT pre-slew burst ]
    RA: 136.632227440901   Dec: 35.1513774257805  [deg; J2000]
        { 09h 06m 31.7s , +35d 09' 05.0" }
         +/- 1.55259397658995 [arcmin] (estimated 90% radius based on SNR)
         +/- 0.957767741886135 [arcmin] (formal 1-sigma fit error)
    SNR: 16.2247691847975

  Angular difference between the analysis and refined position is 1.014444 arcmin

  Partial Coding Fraction: 0.8125    [ including projection effects ]

  Duration
     T90: 124 +/- 23.3452350598575
        Measured from: 2.56000000238419
                   to: 126.560000002384     [s; relative to TRIGTIME]
     T50: 50 +/- 28.2842712474619
        Measured from: 12.5600000023842
                   to: 62.5600000023842     [s; relative to TRIGTIME]


  Fluence
     Peak Flux  (peak 1 second)
        Measured from: 8.56000000238419
                   to: 9.56000000238419     [s; relative to TRIGTIME]
     Total Fluence
        Measured from: -0.439999997615814
                   to: 140.560000002384     [s; relative to TRIGTIME]

             Band 1     Band 2     Band 3     Band 4
              15-25      25-50     50-100    100-350     keV
 Total     0.566583   0.601229   0.367487   0.143710
           0.057595   0.059674   0.052071   0.044176 [error]
 Peak      0.002164   0.019172   0.021325   0.002617
           0.005161   0.005588   0.004943   0.004027 [error]

     [ fluence units of on-axis counts / fully illuminated detector ]

======================================================================


====== Table of the duration information =============================

        Value   tstart    tstop
T100  141.000   -0.440  140.560
T90   124.000    2.560  126.560
T50    50.000   12.560   62.560
Peak    1.000    8.560    9.560


====== Spectral Analysis Summary =====================================

Model      : spectral model: simple power-law (PL) and cutoff power-law (CPL)
Ph_index   : photon index: E^{Ph_index}
Ph_90err   : 90% error of the photon index
Epeak      : Epeak in keV
Epeak_90err: 90% error of Epeak
Norm       : normalization at 50 keV in both the PL model and CPL model
Nomr_90err : 90% error of the normalization
chi2       : Chi-Squared
dof        : degree of freedo

=== Time-averaged spectral analysis ===
(Best model with acceptable fit: PL)

Model Ph_index Ph_90err_low Ph_90err_hi  Epeak  Epeak_90err_low  Epeak_90err_hi  Norm       Nomr_90err_low    Norm_90err_hi    chi2    dof
PL      -1.699    -0.199      0.193       -           -               -         7.10e-04     -8.57e-05          8.39e-05      49.330   57
CPL     -1.701    -0.196      0.532     9999.280    -9999.270      -9999.280      7.10e-04     -8.54e-05          6.72e-04      49.330   56


=== 1-s peak spectral analysis ===
(Best model with acceptable fit: PL)

Model Ph_index Ph_90err_low Ph_90err_hi  Epeak  Epeak_90err_low  Epeak_90err_hi  Norm       Nomr_90err_low    Norm_90err_hi    chi2    dof
PL      -0.636     -0.537     0.659       -           -               -         3.20e-03     -1.18e-03          1.09e-03      48.880   57
CPL     -0.301      0.301     4.105      342.020    -342.020      -342.020      4.25e-03     -2.14e-03          5.56e-02      48.810   56


=== Fluence/Peak Flux Summary ===

              Model    Band1     Band2     Band3     Band4     Band5     Total
                       15-25     25-50    50-100    100-350    15-150    15-350    keV
Fluence         PL   1.54e-07  2.51e-07  3.09e-07  7.52e-07  9.27e-07  1.47e-06   erg/cm2
      90%_error_low -2.47e-08 -2.62e-08 -5.08e-08 -2.27e-07 -1.17e-07 -2.80e-07   erg/cm2
      90%_error_hi   2.54e-08  2.62e-08  5.11e-08  2.87e-07  1.19e-07  3.29e-07   erg/cm2
Peak flux       PL   5.80e-02  9.81e-02  1.26e-01  3.27e-01  3.72e-01  6.09e-01   ph/cm2/s
      90%_error_low -3.71e-02 -4.64e-02 -3.66e-02 -1.69e-01 -1.17e-01 -1.94e-01   ph/cm2/s
      90%_error_hi   5.23e-02  4.65e-02  3.65e-02  2.83e-01  1.20e-01  2.41e-01   ph/cm2/s

Fluence        CPL   1.55e-07  2.48e-07  3.10e-07  7.50e-07  9.44e-07  1.48e-06   erg/cm2
      90%_error_low -2.87e-08 -2.65e-08    N/A       N/A    -8.01e-08 -5.25e-07   erg/cm2
      90%_error_hi   2.72e-08  3.54e-08    N/A       N/A     1.01e-07  1.32e-07   erg/cm2
Peak flux      CPL   5.10e-02  9.72e-02  1.31e-01  2.50e-01  3.67e-01  5.99e-01   ph/cm2/s
      90%_error_low -5.10e-02 -9.72e-02 -4.12e-02 -2.50e-01 -1.23e-01 -3.26e-01   ph/cm2/s
      90%_error_hi   5.80e-02  4.90e-02  5.19e-02  3.42e-01  1.21e-01  2.05e-01   ph/cm2/s

======================================================================
Image
Pre-slew 15.0-350.0 keV image (Event data)
#   RAcent    DECcent   POSerr    Theta     Phi              Peak Cts       SNR   Name
  136.6322    35.1514   0.0118    14.6022    99.2895         1.1813287     16.225 TRIG_00305011

Foreground time interval of the image:
 -0.440  49.861 (delta_t =  50.301 [sec])
Background time interval of the image:
-239.440  -0.440 (delta_t = 239.000 [sec])
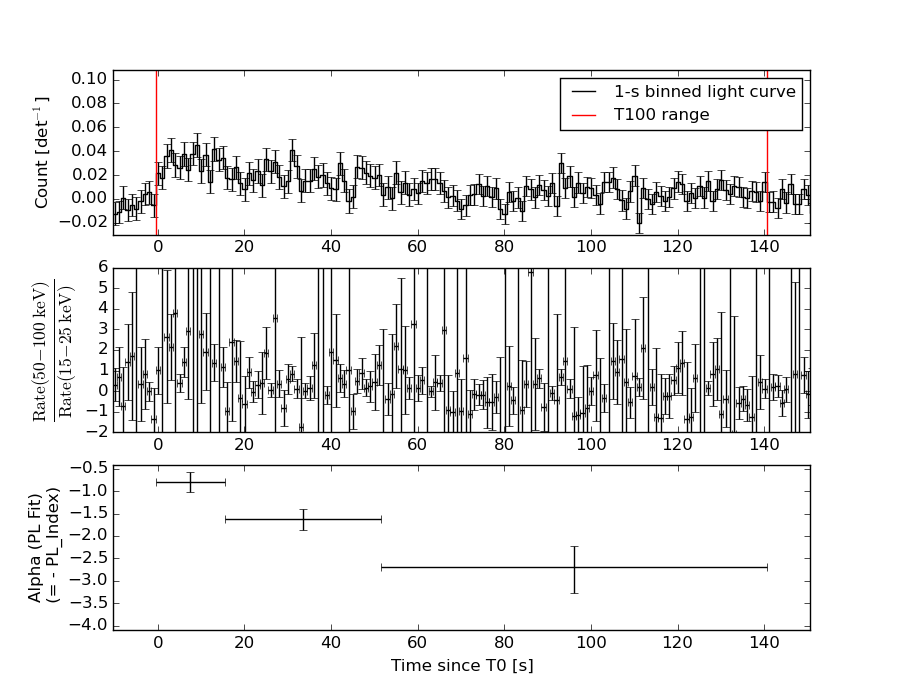
Light Curves
Note: The mask-weighted lightcurves have units of either count/det or counts/sec/det, where a det is 0.4 x 0.4 = 0.16 sq cm.
Full-time range; 1 s binning
Other quick-look light curves:
- 64 ms binning (zoomed)
- 16 ms binning (zoomed)
- 8 ms binning (zoomed)
- 2 ms binning (zoomed)
- SN=5 or 10 s binning (full-time range)
- Raw light curve
Spectra
- 64 ms binning (zoomed)
- 16 ms binning (zoomed)
- 8 ms binning (zoomed)
- 2 ms binning (zoomed)
- SN=5 or 10 s binning (full-time range)
- Raw light curve
Spectra
Notes:
- 1) The fitting includes the systematic errors.
- 2) When the burst includes telescope slew time periods, the fitting uses an average response file made from multiple 5-s response files through out the slew time plus single time preiod for the non-slew times, and weighted by the total counts in the corresponding time period using addrmf. An average response file is needed becuase a spectral fit using the pre-slew DRM will introduce some errors in both a spectral shape and a normalization if the PHA file contains a lot of the slew/post-slew time interval.
- 3) For fits to more complicated models (e.g. a power-law over a cutoff power-law), the BAT team has decided to require a chi-square improvement of more than 6 for each extra dof.
Time averaged spectrum fit using the average DRM
Power-law model

Time interval is from   -0.440 sec. to  140.560 sec.

Spectral model in power-law:
------------------------------------------------------------
Parameters  : value       lower 90%   higher 90%
Photon index: -1.69897     ( -0.198745   0.193282 )
Norm@50keV  : 7.10105E-04    ( -8.57503e-05   8.39157e-05 )
------------------------------------------------------------
#Fit statistic : Chi-Squared =          49.33 using 59 PHA bins.
# Reduced chi-squared =         0.8654 for     57 degrees of freedom
# Null hypothesis probability =   7.550703e-01

Photon flux (15-150 keV)    in 141 sec: 9.42799E-02 ( -0.0098571  0.0098601 ) ph/cm2/s
Energy fluence (15-150 keV)             : 9.27255e-07 ( -1.17099e-07  1.19292e-07 ) ergs/cm2
Cutoff power-law model
Time interval is from   -0.440 sec. to  140.560 sec.
Spectral model in the cutoff power-law:
------------------------------------------------------------
Parameters  : value       lower 90%   higher 90%
Photon index: -1.70145     ( -0.196376   0.531398 )
Epeak [keV] : 9999.28      ( -9999.35 -9999.36 )
Norm@50keV  : 7.10465E-04    ( -8.55767e-05   0.000671364 )
------------------------------------------------------------
#Fit statistic : Chi-Squared =          49.33 using 59 PHA bins.
# Reduced chi-squared =         0.8809 for     56 degrees of freedom
# Null hypothesis probability =   7.235132e-01

Photon flux (15-150 keV)    in 141 sec: 9.48514E-02 ( -0.0104338  0.0092826 ) ph/cm2/s
Energy fluence (15-150 keV)             : 9.43537e-07 ( -8.0063e-08  1.00652e-07 ) ergs/cm2
1-s peak spectrum fit
Power-law model
Time interval is from    8.560 sec. to    9.560 sec.

Spectral model in power-law:
------------------------------------------------------------
Parameters  : value       lower 90%   higher 90%
Photon index: -0.636107     ( -0.536512   0.659275 )
Norm@50keV  : 3.20303E-03    ( -0.00118135   0.00108534 )
------------------------------------------------------------
#Fit statistic : Chi-Squared =          48.88 using 59 PHA bins.
# Reduced chi-squared =         0.8575 for     57 degrees of freedom
# Null hypothesis probability =   7.693370e-01

Photon flux (15-150 keV)    in 1 sec: 0.372431 ( -0.117296  0.119913 ) ph/cm2/s
Energy fluence (15-150 keV)             : 4.0268e-08 ( -1.19723e-08  1.2021e-08 ) ergs/cm2
Cutoff power-law model
Time interval is from    8.560 sec. to    9.560 sec.
Spectral model in the cutoff power-law:
------------------------------------------------------------
Parameters  : value       lower 90%   higher 90%
Photon index: -0.301328     ( 0.30126   4.10519 )
Epeak [keV] : 342.020      ( -341.987 -341.987 )
Norm@50keV  : 4.25079E-03    ( -0.00213572   0.0555808 )
------------------------------------------------------------
#Fit statistic : Chi-Squared =          48.81 using 59 PHA bins.
# Reduced chi-squared =         0.8717 for     56 degrees of freedom
# Null hypothesis probability =   7.410974e-01

Photon flux (15-150 keV)    in 1 sec: 0.366993 ( -0.122968  0.120629 ) ph/cm2/s
Energy fluence (15-150 keV)             : 4.00295e-08 ( -1.23059e-08  1.18864e-08 ) ergs/cm2
Time-resolved spectra
Distribution
T90 vs. Hardness ratio plot
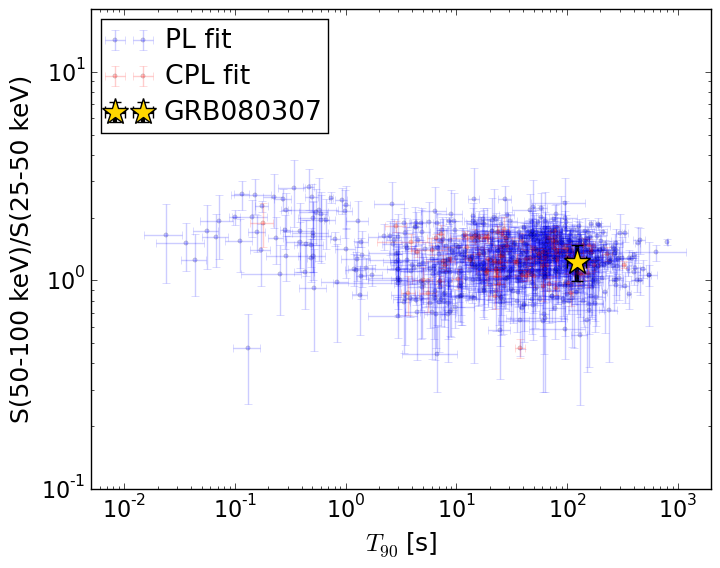
T90                                   = 124.0 sec.
Hardness ratio (energy fluence ratio) = 1.23208293693
S(15-50 keV) vs. S(50-150 keV) plot
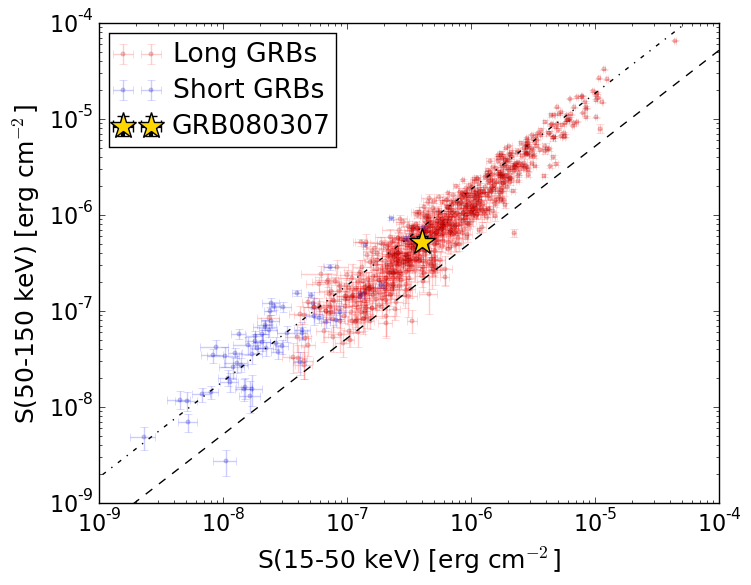
S(15-50 keV)  = 4.050404e-07
S(50-150 keV) = 5.222067e-07
The dash-dotted line and the dashed line traces the fluences calculated from the Band function with Epeak = 15 and 150 keV, respectively. Both lines assume a canonical values of alpha = -1 and beta = -2.5.
Mask shadow pattern
IMX = -4.205418108156107E-02, IMY = -2.571044896457641E-01
Spacecraft aspect plot
Bright source in the pre-burst/pre-slew/post-slew images
Pre-burst image of 15-350 keV band
Time interval of the image:
-239.440000 -0.440000

# RAcent  DECcent POSerr Theta    Phi  PeakCts   SNR AngSep     Name
#  [deg]    [deg]    ['] [deg]  [deg]                   [']
 83.6280  22.0183    0.3  40.4 -147.3  10.4684  38.7    0.4	Crab
251.7999  68.4053    2.5  59.2  -14.9   4.9023   4.6 ------	UNKNOWN
354.5855  80.1076    3.2  50.6  -44.5   3.7166   3.6 ------	UNKNOWN
 45.2588  69.9081    2.4  43.6  -63.8   3.9336   4.8 ------	UNKNOWN
 54.2714  61.0232    2.4  41.6  -77.7   3.3838   4.9 ------	UNKNOWN
Pre-slew background subtracted image of 15-350 keV band
Time interval of the image:
-0.440000 49.860600

# RAcent  DECcent POSerr Theta    Phi  PeakCts   SNR AngSep     Name
#  [deg]    [deg]    ['] [deg]  [deg]                   [']
 83.6220  22.0145    3.1  40.4 -147.3  -0.3851  -3.7    0.6	Crab
136.6322  35.1513    0.7  14.6   99.3   1.1812  16.2 ------	UNKNOWN
132.3332  49.0574    2.4   6.5   24.9   0.3181   4.9 ------	UNKNOWN
 98.3740   8.3942    3.0  43.5 -176.5   0.4449   3.9 ------	UNKNOWN
 89.5491  53.1424    2.2  23.0  -94.2   0.4310   5.2 ------	UNKNOWN
327.2766  80.9620    2.0  52.3  -39.1   1.8007   5.7 ------	UNKNOWN
Post-slew image of 15-350 keV band
Time interval of the image:
86.060600 962.593100

# RAcent  DECcent POSerr Theta    Phi  PeakCts   SNR AngSep     Name
#  [deg]    [deg]    ['] [deg]  [deg]                   [']
 83.6295  22.0131    1.1  47.8 -129.5  19.5727  10.5    0.2	Crab
143.7080   3.0851    3.5  32.8  128.5   2.4500   3.3 ------	UNKNOWN
166.3879  29.5007    2.5  25.7   56.0   2.5993   4.7 ------	UNKNOWN
162.9601  47.6551    3.0  23.2   11.0   1.6423   3.9 ------	UNKNOWN
 91.3281  -6.1606    3.0  59.4 -163.1  14.9524   3.8 ------	UNKNOWN
 97.9275  42.5855    2.1  30.7 -102.6   3.1134   5.4 ------	UNKNOWN
 91.3912  61.3984    3.2  38.6  -71.4   3.6111   3.6 ------	UNKNOWN