Analysis Summary
Notes:
- 1) No attempt has been made to eliminate the non-significant decimal places.
- 2) This batgrbproduct analysis is done using the HEASARC data.
- 3) This batgrbproduct analysis is using the flight position for the mask-weighting calculation.
======================================================================
                  BAT GRB EVENT DATA PROCESSING REPORT
    Process Script Ver: batgrbproduct v2.46
    Process Start Time: Mon Oct  5 14:41:23 EDT 2015
             Host Name: bat1
   Current Working Dir: /local/data/bat1/alien/Swift_3rdBATcatalog/event/batevent_reproc/trigger306323
======================================================================

  Trigger: 00306323      Segment: 000

  BAT Trigger Time: 227240704   [s; MET]
      Trigger Stop: 227240768   [s; MET]
               UTC: 2008-03-15T02:25:01.356140    [includes UTCF correction]
       Where From?: TDRSS position message

  BAT
    RA: 155.181603570327   Dec: 41.7290018673236  [deg; J2000]

     Catalogged Source?: NO
     Point Source?:      YES
     GRB Indicated?:     YES    [ by BAT flight software ]
     Image S/N Ratio:    7.51
     Image Trigger?:     YES
     Rate S/N Ratio:     0  [ if not an image trigger ]
     Image S/N Ratio:    7.51

  Analysis Position:   [ source = BAT ]
    RA: 155.181603570327   Dec: 41.7290018673236  [deg; J2000]

  Refined Position:   [ source = BAT pre-slew burst ]
    RA: 155.112593553519   Dec: 41.6772078380079  [deg; J2000]
        { 10h 20m 27.0s , +41d 40' 37.9" }
         +/- 3.27121754076449 [arcmin] (estimated 90% radius based on SNR)
         +/- 1.33876906995558 [arcmin] (formal 1-sigma fit error)
    SNR: 5.59524618192219

  Angular difference between the analysis and refined position is 4.383386 arcmin

  Partial Coding Fraction: 0.984375    [ including projection effects ]

  Duration
     T90: N/A +/- N/A
        Measured from: N/A
                   to: N/A     [s; relative to TRIGTIME]
     T50: N/A +/- N/A
        Measured from: N/A
                   to: N/A     [s; relative to TRIGTIME]

    WARNING: battblocks failed.  Used TDRSS fore/background intervals

======================================================================


====== Table of the duration information =============================

        Value   tstart    tstop
T100     N/A      N/A      N/A
T90      N/A      N/A      N/A
T50      N/A      N/A      N/A
Peak     N/A      N/A      N/A


====== Spectral Analysis Summary =====================================

Model      : spectral model: simple power-law (PL) and cutoff power-law (CPL)
Ph_index   : photon index: E^{Ph_index}
Ph_90err   : 90% error of the photon index
Epeak      : Epeak in keV
Epeak_90err: 90% error of Epeak
Norm       : normalization at 50 keV in both the PL model and CPL model
Nomr_90err : 90% error of the normalization
chi2       : Chi-Squared
dof        : degree of freedo

=== Time-averaged spectral analysis ===
(Best model with acceptable fit: N/A)

Model Ph_index Ph_90err_low Ph_90err_hi  Epeak  Epeak_90err_low  Epeak_90err_hi  Norm       Nomr_90err_low    Norm_90err_hi    chi2    dof
PL      -2.177    -0.618      0.473       -           -               -         2.32e-04     -1.05e-04          1.02e-04      63.240   57
CPL      1.581     N/A        N/A          30.146      N/A           N/A         7.97e-02        N/A               N/A         55.370   56


=== 1-s peak spectral analysis ===
(Best model with acceptable fit: N/A)

Model Ph_index Ph_90err_low Ph_90err_hi  Epeak  Epeak_90err_low  Epeak_90err_hi  Norm       Nomr_90err_low    Norm_90err_hi    chi2    dof
PL      N/A         N/A       N/A          -           -               -           N/A           N/A               N/A         N/A        N/A
CPL     N/A         N/A       N/A          N/A         N/A           N/A           N/A           N/A               N/A         N/A        N/A


=== Fluence/Peak Flux Summary ===

              Model    Band1     Band2     Band3     Band4     Band5     Total
                       15-25     25-50    50-100    100-350    15-150    15-350    keV
Fluence         PL   3.63e-08  4.36e-08  3.80e-08  5.65e-08  1.38e-07  1.71e-07   erg/cm2
      90%_error_low -1.31e-08 -1.54e-08 -2.02e-08 -4.08e-08 -5.33e-08 -7.52e-08   erg/cm2
      90%_error_hi   1.35e-08  1.53e-08  2.44e-08  8.45e-08  5.89e-08  1.18e-07   erg/cm2
Peak flux       PL     N/A      N/A      N/A      N/A      N/A      N/A     ph/cm2/s
Image
Pre-slew 15.0-350.0 keV image (Event data)
#   RAcent    DECcent   POSerr    Theta     Phi              Peak Cts       SNR   Name
  155.1126    41.6772   0.0344    15.8722    15.4159         0.3813305      5.595 TRIG_00306323

Foreground time interval of the image:
  0.000  64.000 (delta_t =  64.000 [sec])
Background time interval of the image:
Light Curves
Note: The mask-weighted lightcurves have units of either count/det or counts/sec/det, where a det is 0.4 x 0.4 = 0.16 sq cm.
Full-time range; 1 s binning
Other quick-look light curves:
- 64 ms binning (zoomed)
- 16 ms binning (zoomed)
- 8 ms binning (zoomed)
- 2 ms binning (zoomed)
- SN=5 or 10 s binning (full-time range)
- Raw light curve
Spectra
- 64 ms binning (zoomed)
- 16 ms binning (zoomed)
- 8 ms binning (zoomed)
- 2 ms binning (zoomed)
- SN=5 or 10 s binning (full-time range)
- Raw light curve
Spectra
Notes:
- 1) The fitting includes the systematic errors.
- 2) When the burst includes telescope slew time periods, the fitting uses an average response file made from multiple 5-s response files through out the slew time plus single time preiod for the non-slew times, and weighted by the total counts in the corresponding time period using addrmf. An average response file is needed becuase a spectral fit using the pre-slew DRM will introduce some errors in both a spectral shape and a normalization if the PHA file contains a lot of the slew/post-slew time interval.
- 3) For fits to more complicated models (e.g. a power-law over a cutoff power-law), the BAT team has decided to require a chi-square improvement of more than 6 for each extra dof.
Time averaged spectrum fit using the average DRM
Power-law model

Time interval is from    0.000 sec. to   64.000 sec.

Spectral model in power-law:
------------------------------------------------------------
Parameters  : value       lower 90%   higher 90%
Photon index: -2.1773     ( -0.576184   0.515333 )
Norm@50keV  : 2.32142E-04    ( -0.000103919   0.000103692 )
------------------------------------------------------------
#Fit statistic : Chi-Squared =          63.24 using 59 PHA bins.
# Reduced chi-squared =          1.110 for     57 degrees of freedom
# Null hypothesis probability =   2.654480e-01

Photon flux (15-150 keV)    in 64 sec: 3.79073E-02 ( -0.0122655  0.0124197 ) ph/cm2/s
Energy fluence (15-150 keV)             : 1.37994e-07 ( -5.33027e-08  5.89032e-08 ) ergs/cm2
Cutoff power-law model

Time interval is from    0.000 sec. to   64.000 sec.
Spectral model in the cutoff power-law:
------------------------------------------------------------
Parameters  : value       lower 90%   higher 90%
Photon index: 10     (       )
Epeak [keV] : 28.0572      (   )
Norm@50keV  : 9.52285E+04    (     )
------------------------------------------------------------
#Fit statistic : Chi-Squared =          51.06 using 59 PHA bins.
# Reduced chi-squared =         0.9119 for     56 degrees of freedom
# Null hypothesis probability =   6.617619e-01

Photon flux (15-150 keV)    in 64 sec: 3.70292E-02 ( -0.0091733  0.0115768 ) ph/cm2/s
Energy fluence (15-150 keV)             : 1.00737e-07 ( -2.55092e-08  3.38735e-08 ) ergs/cm2
1-s peak spectrum fit
1-s peak spectrum unavailable, likely because there are no event data in the 1-s peak range.
Time-resolved spectra

Distribution
T90 vs. Hardness ratio plot
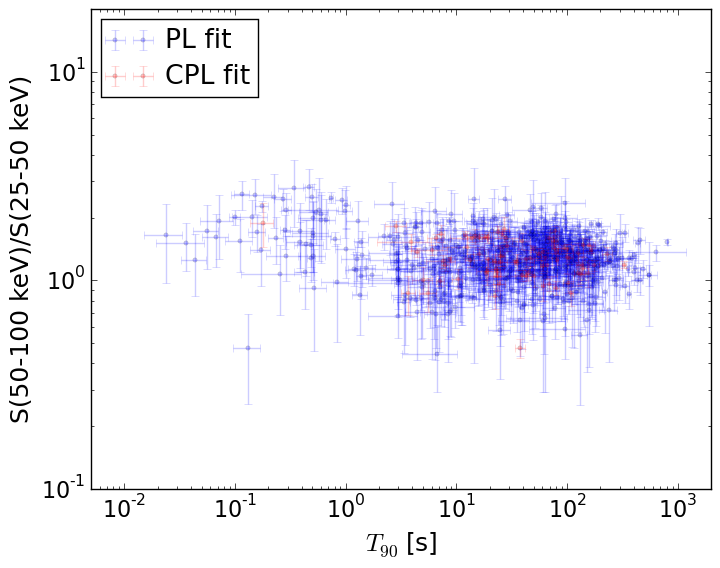
T90                                   = N/A sec.
Hardness ratio (energy fluence ratio) = N/A
S(15-50 keV) vs. S(50-150 keV) plot
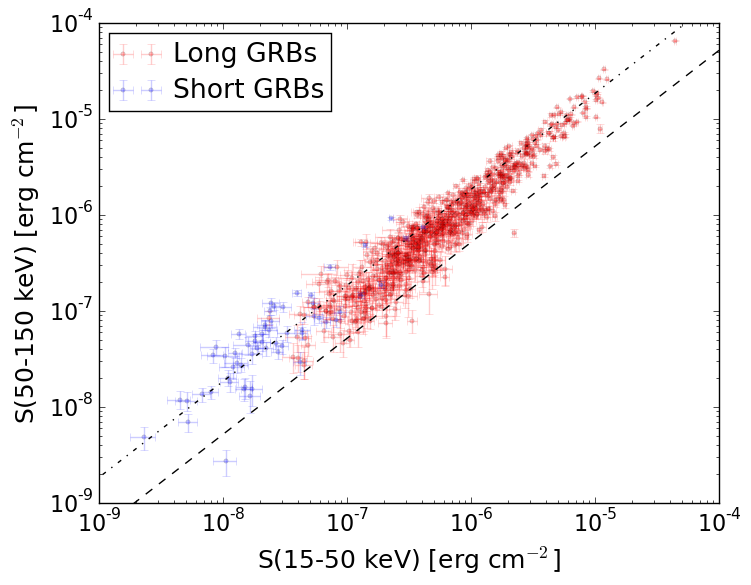
S(15-50 keV)  = N/A
S(50-150 keV) = N/A
The dash-dotted line and the dashed line traces the fluences calculated from the Band function with Epeak = 15 and 150 keV, respectively. Both lines assume a canonical values of alpha = -1 and beta = -2.5.
Mask shadow pattern
IMX = 2.741022794739115E-01, IMY = -7.558222851770033E-02
Spacecraft aspect plot
Bright source in the pre-burst/pre-slew/post-slew images
Pre-burst image of 15-350 keV band
Time interval of the image:
Pre-slew background subtracted image of 15-350 keV band
Time interval of the image:
0.000000 64.000000

# RAcent  DECcent POSerr Theta    Phi  PeakCts   SNR AngSep     Name
#  [deg]    [deg]    ['] [deg]  [deg]                   [']
 83.6402  22.0014    1.0  47.7 -136.1   2.7142  11.4    0.9	Crab
155.1125  41.6772    2.1  15.9   15.4   0.3815   5.6 ------	UNKNOWN
 99.8869   0.3017    3.0  48.8 -172.3   0.5477   3.9 ------	UNKNOWN
 85.2908  60.4120    2.2  41.1  -80.7   1.5649   5.3 ------	UNKNOWN
Post-slew image of 15-350 keV band
Time interval of the image:
110.100590 963.068800

# RAcent  DECcent POSerr Theta    Phi  PeakCts   SNR AngSep     Name
#  [deg]    [deg]    ['] [deg]  [deg]                   [']
150.8411   2.0259    2.3  39.9  126.8   5.3497   5.0 ------	UNKNOWN
122.8546  58.4515    3.1  26.2  -99.3   1.7279   3.7 ------	UNKNOWN