Analysis Summary
Notes:
- 1) No attempt has been made to eliminate the non-significant decimal places.
- 2) This batgrbproduct analysis is done using the HEASARC data.
- 3) This batgrbproduct analysis is using the flight position for the mask-weighting calculation.
======================================================================
                  BAT GRB EVENT DATA PROCESSING REPORT
    Process Script Ver: batgrbproduct v2.46
    Process Start Time: Sat May  9 19:26:25 EDT 2015
             Host Name: bat1
   Current Working Dir: /local/data/bat1/alien/Swift_3rdBATcatalog/event/batevent_reproc/trigger306754
======================================================================

  Trigger: 00306754      Segment: 000

  BAT Trigger Time: 227598344.704   [s; MET]
      Trigger Stop: 227598356.864   [s; MET]
               UTC: 2008-03-19T05:45:42.050320    [includes UTCF correction]
       Where From?: TDRSS position message

  BAT
    RA: 206.354093753083   Dec: 44.0789866539064  [deg; J2000]

     Catalogged Source?: NO
     Point Source?:      YES
     GRB Indicated?:     YES    [ by BAT flight software ]
     Image S/N Ratio:    7.23
     Image Trigger?:     NO
     Rate S/N Ratio:     15.9687194226713  [ if not an image trigger ]
     Image S/N Ratio:    7.23

  Analysis Position:   [ source = BAT ]
    RA: 206.354093753083   Dec: 44.0789866539064  [deg; J2000]

  Refined Position:   [ source = BAT pre-slew burst ]
    RA: 206.343666097454   Dec: 44.0742659493499  [deg; J2000]
        { 13h 45m 22.5s , +44d 04' 27.4" }
         +/- 1.39127981500385 [arcmin] (estimated 90% radius based on SNR)
         +/- 0.491324840393505 [arcmin] (formal 1-sigma fit error)
    SNR: 18.9775675179077

  Angular difference between the analysis and refined position is 0.531280 arcmin

  Partial Coding Fraction: 0.07421875    [ including projection effects ]

  Duration
     T90: 43.6159999668598 +/- 5.54007363463985
        Measured from: 1.33599999547005
                   to: 44.9519999623299     [s; relative to TRIGTIME]
     T50: 22.175999969244 +/- 3.15264968326133
        Measured from: 7.54399999976158
                   to: 29.7199999690056     [s; relative to TRIGTIME]


  Fluence
     Peak Flux  (peak 1 second)
        Measured from: 4.15600001811981
                   to: 5.15600001811981     [s; relative to TRIGTIME]
     Total Fluence
        Measured from: -0.375999987125397
                   to: 49     [s; relative to TRIGTIME]

             Band 1     Band 2     Band 3     Band 4
              15-25      25-50     50-100    100-350     keV
 Total     1.481759   2.201088   1.975721   0.545452
           0.134242   0.143648   0.127533   0.105127 [error]
 Peak      0.076547   0.135379   0.050490   0.016615
           0.019929   0.021939   0.018646   0.015129 [error]

     [ fluence units of on-axis counts / fully illuminated detector ]

======================================================================


====== Table of the duration information =============================

        Value   tstart    tstop
T100   49.376   -0.376   49.000
T90    43.616    1.336   44.952
T50    22.176    7.544   29.720
Peak    1.000    4.156    5.156


====== Spectral Analysis Summary =====================================

Model      : spectral model: simple power-law (PL) and cutoff power-law (CPL)
Ph_index   : photon index: E^{Ph_index}
Ph_90err   : 90% error of the photon index
Epeak      : Epeak in keV
Epeak_90err: 90% error of Epeak
Norm       : normalization at 50 keV in both the PL model and CPL model
Nomr_90err : 90% error of the normalization
chi2       : Chi-Squared
dof        : degree of freedo

=== Time-averaged spectral analysis ===
(Best model with acceptable fit: PL)

Model Ph_index Ph_90err_low Ph_90err_hi  Epeak  Epeak_90err_low  Epeak_90err_hi  Norm       Nomr_90err_low    Norm_90err_hi    chi2    dof
PL      -1.543    -0.116      0.116       -           -               -         9.56e-03     -6.41e-04          6.41e-04      54.310   57
CPL     -1.324    -0.280      0.478      167.660      N/A           N/A         1.21e-02        N/A               N/A         53.600   56


=== 1-s peak spectral analysis ===
(Best model with acceptable fit: PL)

Model Ph_index Ph_90err_low Ph_90err_hi  Epeak  Epeak_90err_low  Epeak_90err_hi  Norm       Nomr_90err_low    Norm_90err_hi    chi2    dof
PL      -1.958     -0.367     0.338       -           -               -         1.76e-02     -4.42e-03          4.34e-03      44.130   57
CPL      1.323     -2.595     7.526       44.817      -8.439        15.713      1.09e+00     -1.09e+00          1.42e+04      38.680   56


=== Fluence/Peak Flux Summary ===

              Model    Band1     Band2     Band3     Band4     Band5     Total
                       15-25     25-50    50-100    100-350    15-150    15-350    keV
Fluence         PL   6.28e-07  1.12e-06  1.54e-06  4.39e-06  4.45e-06  7.68e-06   erg/cm2
      90%_error_low -7.60e-08 -8.43e-08 -1.26e-07 -7.31e-07 -3.12e-07 -8.26e-07   erg/cm2
      90%_error_hi   7.90e-08  8.38e-08  1.25e-07  8.21e-07  3.12e-07  8.91e-07   erg/cm2
Peak flux       PL   1.13e+00  8.67e-01  4.46e-01  3.31e-01  2.60e+00  2.77e+00   ph/cm2/s
      90%_error_low -3.61e-01 -2.03e-01 -1.35e-01 -1.57e-01 -6.17e-01 -6.41e-01   ph/cm2/s
      90%_error_hi   3.90e-01  2.03e-01  1.35e-01  2.10e-01  6.20e-01  6.42e-01   ph/cm2/s

Fluence        CPL   6.00e-07  1.15e-06  1.58e-06  3.29e-06  4.41e-06  6.61e-06   erg/cm2
      90%_error_low -9.36e-08 -9.49e-08 -1.44e-07 -1.39e-06 -3.25e-07 -1.41e-06   erg/cm2
      90%_error_hi   9.34e-08  9.67e-08  1.47e-07  1.34e-06  3.24e-07  9.96e-07   erg/cm2
Peak flux      CPL   7.05e-01  1.20e+00  4.68e-01  2.10e-02  2.40e+00  2.40e+00   ph/cm2/s
      90%_error_low -7.05e-01 -3.39e-01 -2.51e-01 -2.10e-02 -6.84e-01 -6.89e-01   ph/cm2/s
      90%_error_hi   5.14e-01  3.66e-01  2.09e-01  1.68e-01  6.63e-01  6.66e-01   ph/cm2/s

======================================================================
Image
Pre-slew 15.0-350.0 keV image (Event data)

#   RAcent    DECcent   POSerr    Theta     Phi              Peak Cts       SNR   Name
  206.3437    44.0743   0.0101    52.8353    14.9556         6.2527644     18.978 TRIG_00306754

Foreground time interval of the image:
 -0.376  49.000 (delta_t =  49.376 [sec])
Background time interval of the image:
-239.704 -177.664 (delta_t =  62.040 [sec])
-119.704  -0.376 (delta_t = 119.328 [sec])
Light Curves
Note: The mask-weighted lightcurves have units of either count/det or counts/sec/det, where a det is 0.4 x 0.4 = 0.16 sq cm.
Full-time range; 1 s binning
Other quick-look light curves:
- 64 ms binning (zoomed)
- 16 ms binning (zoomed)
- 8 ms binning (zoomed)
- 2 ms binning (zoomed)
- SN=5 or 10 s binning (full-time range)
- Raw light curve
Spectra
- 64 ms binning (zoomed)
- 16 ms binning (zoomed)
- 8 ms binning (zoomed)
- 2 ms binning (zoomed)
- SN=5 or 10 s binning (full-time range)
- Raw light curve
Spectra
Notes:
- 1) The fitting includes the systematic errors.
- 2) When the burst includes telescope slew time periods, the fitting uses an average response file made from multiple 5-s response files through out the slew time plus single time preiod for the non-slew times, and weighted by the total counts in the corresponding time period using addrmf. An average response file is needed becuase a spectral fit using the pre-slew DRM will introduce some errors in both a spectral shape and a normalization if the PHA file contains a lot of the slew/post-slew time interval.
- 3) For fits to more complicated models (e.g. a power-law over a cutoff power-law), the BAT team has decided to require a chi-square improvement of more than 6 for each extra dof.
Time averaged spectrum fit using the average DRM
Power-law model

Time interval is from   -0.376 sec. to   49.000 sec.

Spectral model in power-law:
------------------------------------------------------------
Parameters  : value       lower 90%   higher 90%
Photon index: -1.54288     ( -0.1157   0.115603 )
Norm@50keV  : 9.56213E-03    ( -0.000641406   0.000641074 )
------------------------------------------------------------
#Fit statistic : Chi-Squared =          54.31 using 59 PHA bins.
# Reduced chi-squared =         0.9529 for     57 degrees of freedom
# Null hypothesis probability =   5.764778e-01

Photon flux (15-150 keV)    in 49.38 sec: 1.20806 ( -0.08781  0.08813 ) ph/cm2/s
Energy fluence (15-150 keV)             : 4.45032e-06 ( -3.11646e-07  3.12468e-07 ) ergs/cm2
Cutoff power-law model
Time interval is from   -0.376 sec. to   49.000 sec.
Spectral model in the cutoff power-law:
------------------------------------------------------------
Parameters  : value       lower 90%   higher 90%
Photon index: -1.3241     ( -0.279843   0.47844 )
Epeak [keV] : 167.660      (   )
Norm@50keV  : 1.21460E-02    (     )
------------------------------------------------------------
#Fit statistic : Chi-Squared =          53.60 using 59 PHA bins.
# Reduced chi-squared =         0.9572 for     56 degrees of freedom
# Null hypothesis probability =   5.662317e-01

Photon flux (15-150 keV)    in 49.38 sec: 1.19551 ( -0.09127  0.09149 ) ph/cm2/s
Energy fluence (15-150 keV)             : 4.40921e-06 ( -3.24976e-07  3.23618e-07 ) ergs/cm2
1-s peak spectrum fit
Power-law model
Time interval is from    4.156 sec. to    5.156 sec.

Spectral model in power-law:
------------------------------------------------------------
Parameters  : value       lower 90%   higher 90%
Photon index: -1.95824     ( -0.367016   0.337845 )
Norm@50keV  : 1.76300E-02    ( -0.00442197   0.00433613 )
------------------------------------------------------------
#Fit statistic : Chi-Squared =          44.13 using 59 PHA bins.
# Reduced chi-squared =         0.7741 for     57 degrees of freedom
# Null hypothesis probability =   8.938020e-01

Photon flux (15-150 keV)    in 1 sec: 2.59527 ( -0.61723  0.6203 ) ph/cm2/s
Energy fluence (15-150 keV)             : 1.62308e-07 ( -3.93491e-08  3.9603e-08 ) ergs/cm2
Cutoff power-law model
Time interval is from    4.156 sec. to    5.156 sec.
Spectral model in the cutoff power-law:
------------------------------------------------------------
Parameters  : value       lower 90%   higher 90%
Photon index: 1.32307     ( -2.68469   7.43562 )
Epeak [keV] : 44.8166      ( -8.20702 15.9451 )
Norm@50keV  : 1.09127    ( -1.4383   14183.6 )
------------------------------------------------------------
#Fit statistic : Chi-Squared =          38.68 using 59 PHA bins.
# Reduced chi-squared =         0.6906 for     56 degrees of freedom
# Null hypothesis probability =   9.624678e-01

Photon flux (15-150 keV)    in 1 sec: 2.39567 ( -0.68364  0.66344 ) ph/cm2/s
Energy fluence (15-150 keV)             : 1.43107e-07 ( -4.06197e-08  4.4535e-08 ) ergs/cm2
Time-resolved spectra

Distribution
T90 vs. Hardness ratio plot

T90                                   = 43.616 sec.
Hardness ratio (energy fluence ratio) = 1.37280921917
S(15-50 keV) vs. S(50-150 keV) plot
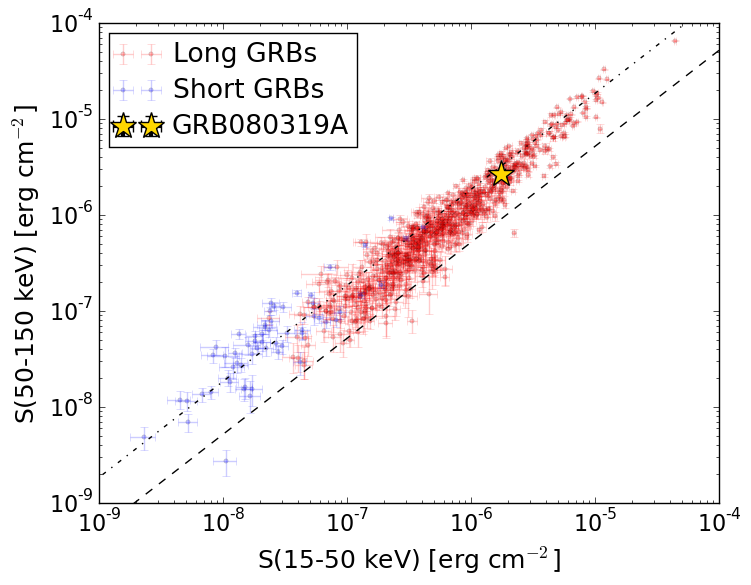
S(15-50 keV)  = 1.751256e-06
S(50-150 keV) = 2.699044e-06
The dash-dotted line and the dashed line traces the fluences calculated from the Band function with Epeak = 15 and 150 keV, respectively. Both lines assume a canonical values of alpha = -1 and beta = -2.5.
Mask shadow pattern
IMX = 1.274452504749787E+00, IMY = -3.404304836468816E-01
Spacecraft aspect plot
Bright source in the pre-burst/pre-slew/post-slew images
Pre-burst image of 15-350 keV band
Time interval of the image:
-239.704000 -177.664300
-119.704000 -0.376000

# RAcent  DECcent POSerr Theta    Phi  PeakCts   SNR AngSep     Name
#  [deg]    [deg]    ['] [deg]  [deg]                   [']
 83.6304  22.0150    0.7  47.8 -133.9   7.5070  16.2    0.2	Crab
178.7476  29.4985    2.6  35.8   44.2   0.9348   4.4 ------	UNKNOWN
119.0681 -11.0036    2.2  49.1  160.3   2.0252   5.3 ------	UNKNOWN
165.7920  35.1868    2.6  23.8   38.6   0.6028   4.4 ------	UNKNOWN
200.6181  49.0104    2.2  48.0    9.8   1.4508   5.1 ------	UNKNOWN
138.4723  28.6295    2.5   6.7  123.2   0.5460   4.6 ------	UNKNOWN
 86.5605  -0.8268    3.4  58.9 -159.2   3.0364   3.5 ------	UNKNOWN
Pre-slew background subtracted image of 15-350 keV band
Time interval of the image:
-0.376000 49.000000

# RAcent  DECcent POSerr Theta    Phi  PeakCts   SNR AngSep     Name
#  [deg]    [deg]    ['] [deg]  [deg]                   [']
 83.5115  22.2139    0.0  47.8 -133.6  -0.4482  -1.8   13.7	Crab
206.3436  44.0742    0.6  52.8   15.0   6.2531  19.0 ------	UNKNOWN
Post-slew image of 15-350 keV band
Time interval of the image:
540.796600 662.377100
720.296000 962.303800

# RAcent  DECcent POSerr Theta    Phi  PeakCts   SNR AngSep     Name
#  [deg]    [deg]    ['] [deg]  [deg]                   [']
254.4551  35.3396   38.5  37.5  -40.0  -0.0958  -0.3    0.2	Her X-1
195.5884  52.3229    3.4  10.9 -163.7   0.6481   3.4 ------	UNKNOWN
269.9378  31.2048    2.9  50.7  -44.6   5.3199   4.0 ------	UNKNOWN