Analysis Summary
Notes:
- 1) No attempt has been made to eliminate the non-significant decimal places.
- 2) This batgrbproduct analysis is done using the HEASARC data.
- 3) This batgrbproduct analysis is using the flight position for the mask-weighting calculation.
======================================================================
                  BAT GRB EVENT DATA PROCESSING REPORT
    Process Script Ver: batgrbproduct v2.46
    Process Start Time: Mon Jan 20 03:40:30 EST 2014
             Host Name: batevent1
   Current Working Dir: /local/data/batevent/batevent_reproc/trigger306778
======================================================================

  Trigger: 00306778      Segment: 000

  BAT Trigger Time: 227622359.616   [s; MET]
      Trigger Stop: 227622360.64   [s; MET]
               UTC: 2008-03-19T12:25:56.961660    [includes UTCF correction]
       Where From?: TDRSS position message

  BAT
    RA: 258.973352489113   Dec: 55.4098844023449  [deg; J2000]

     Catalogged Source?: NO
     Point Source?:      YES
     GRB Indicated?:     YES    [ by BAT flight software ]
     Image S/N Ratio:    15.1
     Image Trigger?:     NO
     Rate S/N Ratio:     69.3613725354393  [ if not an image trigger ]
     Image S/N Ratio:    15.1

  Analysis Position:   [ source = BAT ]
    RA: 258.973352489113   Dec: 55.4098844023449  [deg; J2000]

  Refined Position:   [ source = BAT pre-slew burst ]
    RA: 259.008096885045   Dec: 55.3913388801278  [deg; J2000]
        { 17h 16m 01.9s , +55d 23' 28.8" }
         +/- 0.916906688220536 [arcmin] (estimated 90% radius based on SNR)
         +/- 0.273196054266063 [arcmin] (formal 1-sigma fit error)
    SNR: 34.4302049307086

  Angular difference between the analysis and refined position is 1.624630 arcmin

  Partial Coding Fraction: 0.3046875    [ including projection effects ]

  Duration
     T90: 29.5519999861717 +/- 9.41457083506473
        Measured from: 0.212000012397766
                   to: 29.7639999985695     [s; relative to TRIGTIME]
     T50: 7.45600000023842 +/- 0.45291942449091
        Measured from: 1.95600000023842
                   to: 9.41200000047684     [s; relative to TRIGTIME]


  Fluence
     Peak Flux  (peak 1 second)
        Measured from: 0.127999991178513
                   to: 1.12799999117851     [s; relative to TRIGTIME]
     Total Fluence
        Measured from: -0.328000009059906
                   to: 43.4200000166893     [s; relative to TRIGTIME]

             Band 1     Band 2     Band 3     Band 4
              15-25      25-50     50-100    100-350     keV
 Total     1.062880   1.879763   1.685047   0.497519
           0.056512   0.061847   0.058308   0.052195 [error]
 Peak      0.122295   0.212427   0.233555   0.079877
           0.010521   0.013101   0.013873   0.011627 [error]

     [ fluence units of on-axis counts / fully illuminated detector ]

======================================================================


====== Table of the duration information =============================

        Value   tstart    tstop
T100   43.748   -0.328   43.420
T90    29.552    0.212   29.764
T50     7.456    1.956    9.412
Peak    1.000    0.128    1.128


====== Spectral Analysis Summary =====================================

Model      : spectral model: simple power-law (PL) and cutoff power-law (CPL)
Ph_index   : photon index: E^{Ph_index}
Ph_90err   : 90% error of the photon index
Epeak      : Epeak in keV
Epeak_90err: 90% error of Epeak
Norm       : normalization at 50 keV in both the PL model and CPL model
Nomr_90err : 90% error of the normalization
chi2       : Chi-Squared
dof        : degree of freedo

=== Time-averaged spectral analysis ===
(Best model with acceptable fit: PL)

Model Ph_index Ph_90err_low Ph_90err_hi  Epeak  Epeak_90err_low  Epeak_90err_hi  Norm       Nomr_90err_low    Norm_90err_hi    chi2    dof
PL      -1.285    -0.068      0.068       -           -               -         8.10e-03     -3.02e-04          3.02e-04      48.770   57
CPL     -1.018    -0.271      0.285      201.645     -76.535      4411.335      1.08e-02     -2.40e-03          3.70e-03      45.870   56


=== 1-s peak spectral analysis ===
(Best model with acceptable fit: PL)

Model Ph_index Ph_90err_low Ph_90err_hi  Epeak  Epeak_90err_low  Epeak_90err_hi  Norm       Nomr_90err_low    Norm_90err_hi    chi2    dof
PL      -1.067     -0.107     0.108       -           -               -         4.40e-02     -2.75e-03          2.75e-03      40.650   57
CPL     -0.906     -0.214     0.436      380.265    -380.265      -380.265      5.23e-02     -1.05e-02          2.97e-02      40.200   56


=== Fluence/Peak Flux Summary ===

              Model    Band1     Band2     Band3     Band4     Band5     Total
                       15-25     25-50    50-100    100-350    15-150    15-350    keV
Fluence         PL   3.70e-07  7.75e-07  1.27e-06  4.72e-06  3.51e-06  7.14e-06   erg/cm2
      90%_error_low -2.71e-08 -3.38e-08 -5.71e-08 -4.66e-07 -1.43e-07 -5.01e-07   erg/cm2
      90%_error_hi   2.79e-08  3.37e-08  5.70e-08  5.02e-07  1.43e-07  5.30e-07   erg/cm2
Peak flux       PL   1.20e+00  1.56e+00  1.49e+00  2.52e+00  5.09e+00  6.77e+00   ph/cm2/s
      90%_error_low -1.43e-01 -1.16e-01 -1.06e-01 -3.64e-01 -3.23e-01 -4.67e-01   ph/cm2/s
      90%_error_hi   1.49e-01  1.15e-01  1.06e-01  4.00e-01  3.23e-01  4.76e-01   ph/cm2/s

Fluence        CPL   3.48e-07  7.90e-07  1.30e-06  3.27e-06  3.45e-06  5.71e-06   erg/cm2
      90%_error_low -3.41e-08 -3.73e-08 -6.48e-08 -9.63e-07 -1.57e-07 -9.63e-07   erg/cm2
      90%_error_hi   3.49e-08  3.77e-08  6.55e-08  1.36e-06  1.56e-07  1.35e-06   erg/cm2
Peak flux      CPL   5.82e-01  4.45e-01  2.38e-01  2.22e-01  1.35e+00  1.53e+00   ph/cm2/s
      90%_error_low -1.27e-01 -1.66e-01 -6.08e-02 -1.93e-02 -4.87e-01 -4.87e-01   ph/cm2/s
      90%_error_hi   1.87e-01  1.09e-01  3.68e-02  1.48e-02  3.07e-01  2.27e-01   ph/cm2/s

======================================================================
Image
Pre-slew 15.0-350.0 keV image (Event data)
#   RAcent    DECcent   POSerr    Theta     Phi              Peak Cts       SNR   Name
  259.0081    55.3913   0.0056    33.6705  -101.4636         5.3084307     34.430 TRIG_00306778

Foreground time interval of the image:
 -0.328  43.420 (delta_t =  43.748 [sec])
Background time interval of the image:
-132.915  -0.328 (delta_t = 132.587 [sec])
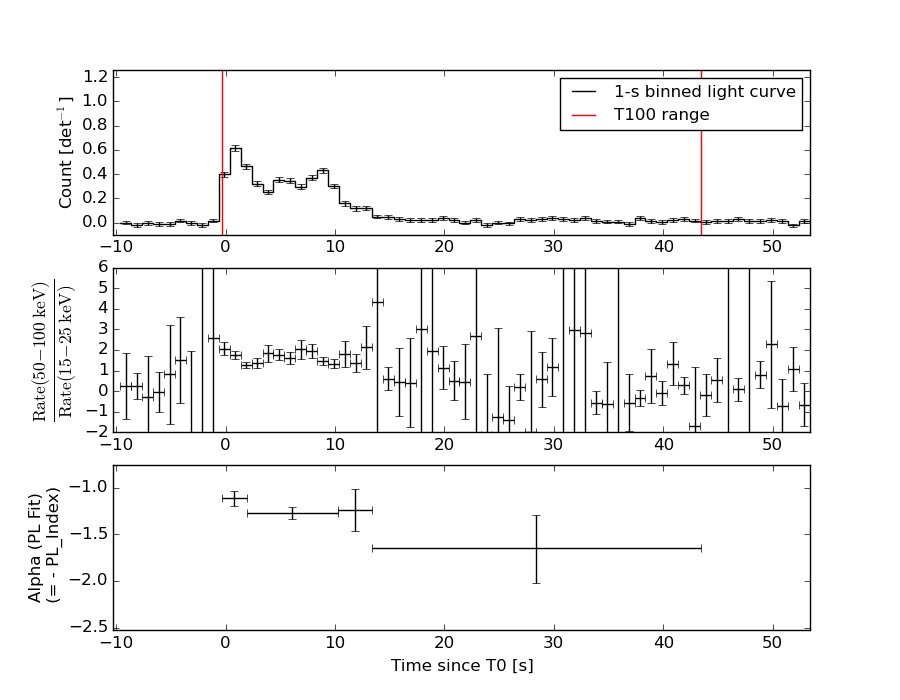
Light Curves
Note: The mask-weighted lightcurves have units of either count/det or counts/sec/det, where a det is 0.4 x 0.4 = 0.16 sq cm.
Full-time range; 1 s binning
Other quick-look light curves:
- 64 ms binning (zoomed)
- 16 ms binning (zoomed)
- 8 ms binning (zoomed)
- 2 ms binning (zoomed)
- SN=5 or 10 s binning (full-time range)
- Raw light curve
Spectra
- 64 ms binning (zoomed)
- 16 ms binning (zoomed)
- 8 ms binning (zoomed)
- 2 ms binning (zoomed)
- SN=5 or 10 s binning (full-time range)
- Raw light curve
Spectra
Notes:
- 1) The fitting includes the systematic errors.
- 2) When the burst includes telescope slew time periods, the fitting uses an average response file made from multiple 5-s response files through out the slew time plus single time preiod for the non-slew times, and weighted by the total counts in the corresponding time period using addrmf. An average response file is needed becuase a spectral fit using the pre-slew DRM will introduce some errors in both a spectral shape and a normalization if the PHA file contains a lot of the slew/post-slew time interval.
- 3) For fits to more complicated models (e.g. a power-law over a cutoff power-law), the BAT team has decided to require a chi-square improvement of more than 6 for each extra dof.
Time averaged spectrum fit using the average DRM
Power-law model
Time interval is from   -0.328 sec. to   43.420 sec.

Spectral model in power-law:
------------------------------------------------------------
Parameters  : value       lower 90%   higher 90%
Photon index: -1.28538     ( -0.0680927   0.0683079 )
Norm@50keV  : 8.09523E-03    ( -0.000302179   0.000302175 )
------------------------------------------------------------
#Fit statistic : Chi-Squared =          48.77 using 59 PHA bins.
# Reduced chi-squared =         0.8556 for     57 degrees of freedom
# Null hypothesis probability =   7.728952e-01

Photon flux (15-150 keV)    in 43.75 sec: 0.963239 ( -0.037976  0.038041 ) ph/cm2/s
Energy fluence (15-150 keV)             : 3.51284e-06 ( -1.42851e-07  1.43264e-07 ) ergs/cm2
Cutoff power-law model
Time interval is from   -0.328 sec. to   43.420 sec.
Spectral model in the cutoff power-law:
------------------------------------------------------------
Parameters  : value       lower 90%   higher 90%
Photon index: -1.0185     ( -0.270552   0.284828 )
Epeak [keV] : 201.645      ( -76.5348 4411.34 )
Norm@50keV  : 1.07585E-02    ( -0.00239631   0.00369611 )
------------------------------------------------------------
#Fit statistic : Chi-Squared =          45.87 using 59 PHA bins.
# Reduced chi-squared =         0.8191 for     56 degrees of freedom
# Null hypothesis probability =   8.309642e-01

Photon flux (15-150 keV)    in 43.75 sec: 0.948807 ( -0.040486  0.040535 ) ph/cm2/s
Energy fluence (15-150 keV)             : 3.45277e-06 ( -1.56689e-07  1.5574e-07 ) ergs/cm2
1-s peak spectrum fit
Power-law model
Time interval is from    0.128 sec. to    1.128 sec.

Spectral model in power-law:
------------------------------------------------------------
Parameters  : value       lower 90%   higher 90%
Photon index: -1.06733     ( -0.107177   0.107926 )
Norm@50keV  : 4.39965E-02    ( -0.00274632   0.00274566 )
------------------------------------------------------------
#Fit statistic : Chi-Squared =          40.65 using 59 PHA bins.
# Reduced chi-squared =         0.7132 for     57 degrees of freedom
# Null hypothesis probability =   9.499147e-01

Photon flux (15-150 keV)    in 1 sec: 5.08836 ( -0.32261  0.32277 ) ph/cm2/s
Energy fluence (15-150 keV)             : 4.64954e-07 ( -3.26493e-08  3.2806e-08 ) ergs/cm2
Cutoff power-law model
Time interval is from    0.128 sec. to    1.128 sec.
Spectral model in the cutoff power-law:
------------------------------------------------------------
Parameters  : value       lower 90%   higher 90%
Photon index: -0.906133     ( -0.21407   0.436374 )
Epeak [keV] : 380.265      ( -380.266 -380.266 )
Norm@50keV  : 5.22550E-02    ( -0.0104771   0.0296523 )
------------------------------------------------------------
#Fit statistic : Chi-Squared =          40.20 using 59 PHA bins.
# Reduced chi-squared =         0.7178 for     56 degrees of freedom
# Null hypothesis probability =   9.449950e-01

Photon flux (15-150 keV)    in 1 sec: 1.35382 ( -0.486639  0.3071 ) ph/cm2/s
Energy fluence (15-150 keV)             : 4.61636e-07 ( -3.40928e-08  3.38941e-08 ) ergs/cm2
Time-resolved spectra
Distribution
T90 vs. Hardness ratio plot
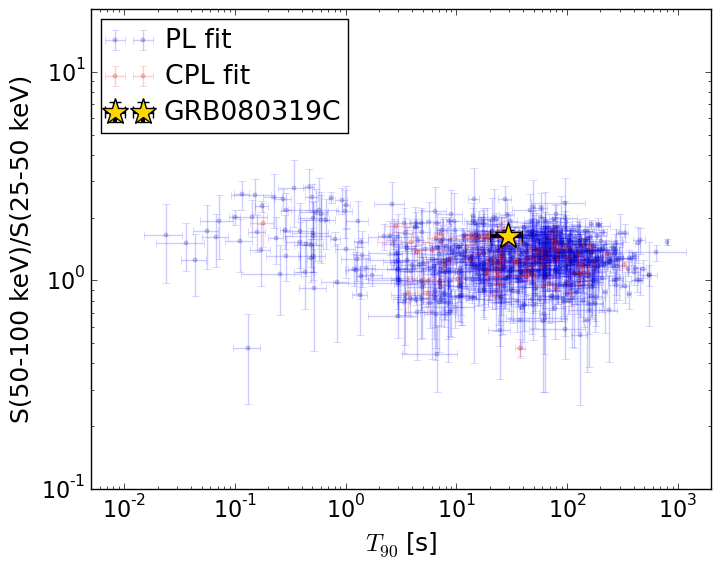
T90                                   = 29.552 sec.
Hardness ratio (energy fluence ratio) = 1.64108011465
S(15-50 keV) vs. S(50-150 keV) plot
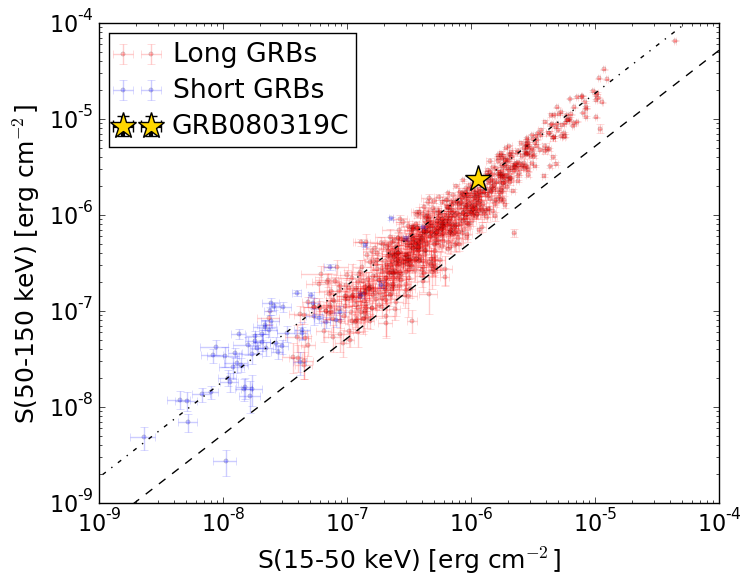
S(15-50 keV)  = 1.1454112e-06
S(50-150 keV) = 2.367468e-06
The dash-dotted line and the dashed line traces the fluences calculated from the Band function with Epeak = 15 and 150 keV, respectively. Both lines assume a canonical values of alpha = -1 and beta = -2.5.
Mask shadow pattern
IMX = -1.323988251153645E-01, IMY = 6.528828242920284E-01
Spacecraft aspect plot
Bright source in the pre-burst/pre-slew/post-slew images
Pre-burst image of 15-350 keV band
Time interval of the image:
-132.915400 -0.328000

# RAcent  DECcent POSerr Theta    Phi  PeakCts   SNR AngSep     Name
#  [deg]    [deg]    ['] [deg]  [deg]                   [']
254.3603  35.3884   12.1  29.4  -63.0  -0.1471  -0.9    5.5	Her X-1
203.1634  -3.7668    2.3  42.4   58.4   2.1083   5.0 ------	UNKNOWN
229.8173 -11.0839    2.3  48.7   20.6   1.6145   5.1 ------	UNKNOWN
162.0736  62.8832    2.3  42.8 -177.5   0.8080   5.0 ------	UNKNOWN
266.3436  10.1180    3.5  50.9  -35.4   1.2787   3.3 ------	UNKNOWN
271.0396  31.9011    3.1  43.7  -64.2   1.8640   3.7 ------	UNKNOWN
273.7099  67.1019    3.4  43.8 -116.1   1.8213   3.4 ------	UNKNOWN
Pre-slew background subtracted image of 15-350 keV band
Time interval of the image:
-0.328000 43.420000

# RAcent  DECcent POSerr Theta    Phi  PeakCts   SNR AngSep     Name
#  [deg]    [deg]    ['] [deg]  [deg]                   [']
254.4272  35.4760   11.9  29.4  -63.2  -0.1104  -1.0    8.2	Her X-1
259.0081  55.3914    0.3  33.7 -101.5   5.3077  34.4 ------	UNKNOWN
Post-slew image of 15-350 keV band
Time interval of the image:
208.084600 962.484000

# RAcent  DECcent POSerr Theta    Phi  PeakCts   SNR AngSep     Name
#  [deg]    [deg]    ['] [deg]  [deg]                   [']
254.6691  35.2234    0.0  20.4   18.7  -0.2099  -0.7   12.6	Her X-1
268.3265  -1.4124   17.0  57.3   -2.5   1.2936   0.7    3.5	SW J1753.5-0127
288.6751  10.9458    5.2  50.2  -30.7  -1.9915  -2.2    7.3	GRS 1915+105
299.5648  35.2019    0.6  34.2  -62.4  11.5491  20.9    1.3	Cyg X-1
308.0971  40.9527    2.6  34.9  -77.9   3.7244   4.4    0.6	Cyg X-3
106.1979  68.7630    2.9  54.2  176.8   5.3589   4.0 ------	UNKNOWN
252.9535  87.8005    2.3  32.4 -171.8   1.8294   5.0 ------	UNKNOWN
293.4878  59.8891    2.4  18.8 -109.4   1.6589   4.8 ------	UNKNOWN
288.1969  13.5267    3.0  47.6  -31.4   3.0803   3.9 ------	UNKNOWN
310.0225  38.1816    3.5  37.9  -76.2   3.3158   3.3 ------	UNKNOWN
298.8044  14.8660    2.0  50.8  -44.5  11.7438   5.8 ------	UNKNOWN