Analysis Summary
Notes:
- 1) No attempt has been made to eliminate the non-significant decimal places.
- 2) This batgrbproduct analysis is done using the HEASARC data.
- 3) This batgrbproduct analysis is using the flight position for the mask-weighting calculation.
======================================================================
BAT GRB EVENT DATA PROCESSING REPORT
Process Script Ver: batgrbproduct v2.46
Process Start Time: Mon Jan 20 03:30:09 EST 2014
Host Name: batevent1
Current Working Dir: /local/data/batevent/batevent_reproc/trigger306858
======================================================================
Trigger: 00306858 Segment: 000
BAT Trigger Time: 227680661.12 [s; MET]
Trigger Stop: 227680662.528 [s; MET]
UTC: 2008-03-20T04:37:38.464040 [includes UTCF correction]
Where From?: TDRSS position message
BAT
RA: 177.780563457759 Dec: 57.1439944141214 [deg; J2000]
Catalogged Source?: NO
Point Source?: YES
GRB Indicated?: YES [ by BAT flight software ]
Image S/N Ratio: 7.64
Image Trigger?: NO
Rate S/N Ratio: 9.9498743710662 [ if not an image trigger ]
Image S/N Ratio: 7.64
Analysis Position: [ source = BAT ]
RA: 177.780563457759 Dec: 57.1439944141214 [deg; J2000]
Refined Position: [ source = BAT pre-slew burst ]
RA: 177.76947854575 Dec: 57.1649626544674 [deg; J2000]
{ 11h 51m 04.7s , +57d 09' 53.9" }
+/- 1.65599568147119 [arcmin] (estimated 90% radius based on SNR)
+/- 0.720250420995516 [arcmin] (formal 1-sigma fit error)
SNR: 14.7971019435478
Angular difference between the analysis and refined position is 1.308789 arcmin
Partial Coding Fraction: 0.9375 [ including projection effects ]
Duration
T90: 13.8160000145435 +/- 1.8587436576694
Measured from: -1.1240000128746
to: 12.6920000016689 [s; relative to TRIGTIME]
T50: 7.22000002861023 +/- 2.25913347151323
Measured from: 0.431999981403351
to: 7.65200001001358 [s; relative to TRIGTIME]
Fluence
Peak Flux (peak 1 second)
Measured from: 0.0519999861717224
to: 1.05199998617172 [s; relative to TRIGTIME]
Total Fluence
Measured from: -1.67199999094009
to: 13.8479999899864 [s; relative to TRIGTIME]
Band 1 Band 2 Band 3 Band 4
15-25 25-50 50-100 100-350 keV
Total 0.141806 0.183449 0.121112 0.050930
0.018450 0.019370 0.017628 0.016211 [error]
Peak 0.016449 0.027019 0.021605 0.008083
0.004815 0.005193 0.004666 0.004124 [error]
[ fluence units of on-axis counts / fully illuminated detector ]
======================================================================
====== Table of the duration information =============================
Value tstart tstop
T100 15.520 -1.672 13.848
T90 13.816 -1.124 12.692
T50 7.220 0.432 7.652
Peak 1.000 0.052 1.052
====== Spectral Analysis Summary =====================================
Model : spectral model: simple power-law (PL) and cutoff power-law (CPL)
Ph_index : photon index: E^{Ph_index}
Ph_90err : 90% error of the photon index
Epeak : Epeak in keV
Epeak_90err: 90% error of Epeak
Norm : normalization at 50 keV in both the PL model and CPL model
Nomr_90err : 90% error of the normalization
chi2 : Chi-Squared
dof : degree of freedo
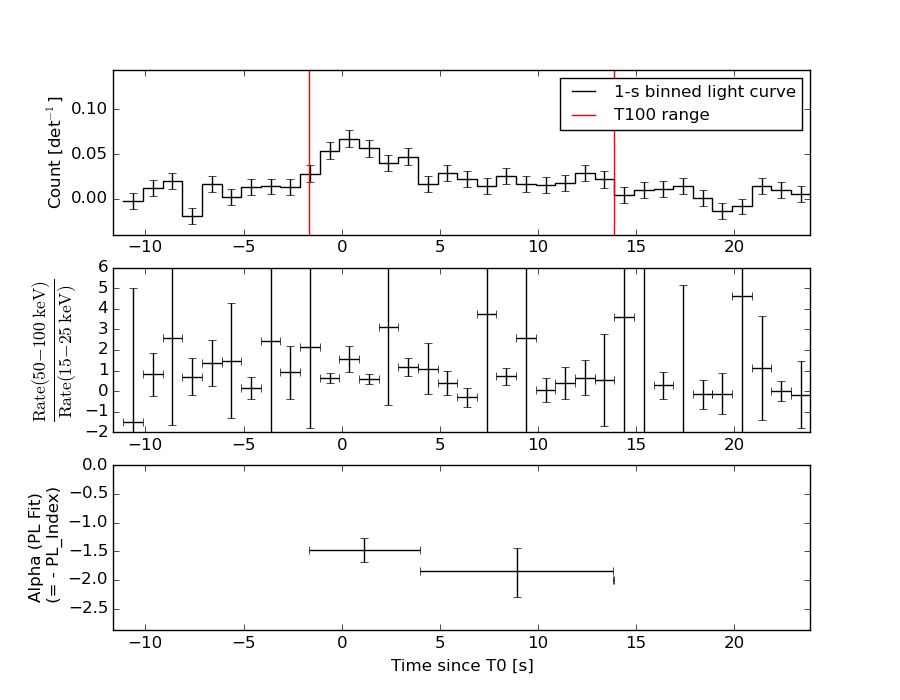
=== Time-averaged spectral analysis ===
(Best model with acceptable fit: PL)
Model Ph_index Ph_90err_low Ph_90err_hi Epeak Epeak_90err_low Epeak_90err_hi Norm Nomr_90err_low Norm_90err_hi chi2 dof
PL -1.623 -0.214 0.209 - - - 1.96e-03 -2.58e-04 2.53e-04 43.190 57
CPL -1.508 -0.326 0.906 189.724 -189.724 -189.724 2.27e-03 -5.65e-04 4.98e-03 43.130 56
=== 1-s peak spectral analysis ===
(Best model with acceptable fit: PL)
Model Ph_index Ph_90err_low Ph_90err_hi Epeak Epeak_90err_low Epeak_90err_hi Norm Nomr_90err_low Norm_90err_hi chi2 dof
PL -1.327 -0.353 0.357 - - - 4.66e-03 -9.89e-04 9.84e-04 56.080 57
CPL -0.734 N/A N/A 104.773 N/A N/A 9.43e-03 N/A N/A 55.540 56
=== Fluence/Peak Flux Summary ===
Model Band1 Band2 Band3 Band4 Band5 Total
15-25 25-50 50-100 100-350 15-150 15-350 keV
Fluence PL 4.35e-08 7.42e-08 9.64e-08 2.53e-07 2.83e-07 4.67e-07 erg/cm2
90%_error_low -7.79e-09 -8.72e-09 -1.70e-08 -8.14e-08 -3.99e-08 -9.91e-08 erg/cm2
90%_error_hi 8.04e-09 8.70e-09 1.71e-08 1.05e-07 4.07e-08 1.18e-07 erg/cm2
Peak flux PL 1.62e-01 1.81e-01 1.44e-01 1.91e-01 5.58e-01 6.79e-01 ph/cm2/s
90%_error_low -5.63e-02 -4.20e-02 -3.72e-02 -8.38e-02 -1.18e-01 -1.48e-01 ph/cm2/s
90%_error_hi 6.17e-02 4.11e-02 3.67e-02 1.18e-01 1.19e-01 1.52e-01 ph/cm2/s
Fluence CPL 4.31e-08 7.53e-08 9.65e-08 2.03e-07 2.80e-07 4.18e-07 erg/cm2
90%_error_low -8.55e-09 -9.71e-09 -1.77e-08 -1.55e-07 -4.82e-08 -1.65e-07 erg/cm2
90%_error_hi 7.54e-09 1.19e-08 1.75e-08 6.94e-08 4.38e-08 8.25e-08 erg/cm2
Peak flux CPL 1.48e-01 1.93e-01 1.51e-01 9.66e-02 5.47e-01 5.88e-01 ph/cm2/s
90%_error_low -6.57e-02 -4.92e-02 -4.08e-02 -9.66e-02 -1.22e-01 -1.53e-01 ph/cm2/s
90%_error_hi 6.97e-02 5.38e-02 4.29e-02 1.26e-01 1.22e-01 1.80e-01 ph/cm2/s
======================================================================
Image
Pre-slew 15.0-350.0 keV image (Event data)
#   RAcent    DECcent   POSerr    Theta     Phi              Peak Cts       SNR   Name
  177.7695    57.1650   0.0130    22.0875  -178.3213         0.4939436     14.797 TRIG_00306858

Foreground time interval of the image:
 -1.672  13.848 (delta_t =  15.520 [sec])
Background time interval of the image:
-239.120  -1.672 (delta_t = 237.448 [sec])
Light Curves
Note: The mask-weighted lightcurves have units of either count/det or counts/sec/det, where a det is 0.4 x 0.4 = 0.16 sq cm.
Full-time range; 1 s binning
Other quick-look light curves:
- 64 ms binning (zoomed)
- 16 ms binning (zoomed)
- 8 ms binning (zoomed)
- 2 ms binning (zoomed)
- SN=5 or 10 s binning (full-time range)
- Raw light curve
Spectra
- 64 ms binning (zoomed)
- 16 ms binning (zoomed)
- 8 ms binning (zoomed)
- 2 ms binning (zoomed)
- SN=5 or 10 s binning (full-time range)
- Raw light curve
Spectra
Notes:
- 1) The fitting includes the systematic errors.
- 2) When the burst includes telescope slew time periods, the fitting uses an average response file made from multiple 5-s response files through out the slew time plus single time preiod for the non-slew times, and weighted by the total counts in the corresponding time period using addrmf. An average response file is needed becuase a spectral fit using the pre-slew DRM will introduce some errors in both a spectral shape and a normalization if the PHA file contains a lot of the slew/post-slew time interval.
- 3) For fits to more complicated models (e.g. a power-law over a cutoff power-law), the BAT team has decided to require a chi-square improvement of more than 6 for each extra dof.
Time averaged spectrum fit using the average DRM
Power-law model
Time interval is from   -1.672 sec. to   13.848 sec.

Spectral model in power-law:
------------------------------------------------------------
Parameters  : value       lower 90%   higher 90%
Photon index: -1.62256     ( -0.214044   0.208911 )
Norm@50keV  : 1.95787E-03    ( -0.000257725   0.000252945 )
------------------------------------------------------------
#Fit statistic : Chi-Squared =          43.19 using 59 PHA bins.
# Reduced chi-squared =         0.7577 for     57 degrees of freedom
# Null hypothesis probability =   9.117879e-01

Photon flux (15-150 keV)    in 15.52 sec: 0.253394 ( -0.029666  0.029672 ) ph/cm2/s
Energy fluence (15-150 keV)             : 2.83467e-07 ( -3.98696e-08  4.071e-08 ) ergs/cm2
Cutoff power-law model
Time interval is from   -1.672 sec. to   13.848 sec.
Spectral model in the cutoff power-law:
------------------------------------------------------------
Parameters  : value       lower 90%   higher 90%
Photon index: -1.50765     ( -0.324722   0.907669 )
Epeak [keV] : 189.724      ( -192.582 -192.582 )
Norm@50keV  : 2.27049E-03    ( -0.000559039   0.00498659 )
------------------------------------------------------------
#Fit statistic : Chi-Squared =          43.13 using 59 PHA bins.
# Reduced chi-squared =         0.7702 for     56 degrees of freedom
# Null hypothesis probability =   8.961430e-01

Photon flux (15-150 keV)    in 15.52 sec: 0.252214 ( -0.030803  0.030476 ) ph/cm2/s
Energy fluence (15-150 keV)             : 2.79596e-07 ( -4.82234e-08  4.3783e-08 ) ergs/cm2
1-s peak spectrum fit
Power-law model
Time interval is from    0.052 sec. to    1.052 sec.

Spectral model in power-law:
------------------------------------------------------------
Parameters  : value       lower 90%   higher 90%
Photon index: -1.32727     ( -0.353286   0.35733 )
Norm@50keV  : 4.65631E-03    ( -0.000988862   0.000984201 )
------------------------------------------------------------
#Fit statistic : Chi-Squared =          56.08 using 59 PHA bins.
# Reduced chi-squared =         0.9838 for     57 degrees of freedom
# Null hypothesis probability =   5.097363e-01

Photon flux (15-150 keV)    in 1 sec: 0.558404 ( -0.118438  0.118649 ) ph/cm2/s
Energy fluence (15-150 keV)             : 4.57193e-08 ( -1.07465e-08  1.09581e-08 ) ergs/cm2
Cutoff power-law model
Time interval is from    0.052 sec. to    1.052 sec.
Spectral model in the cutoff power-law:
------------------------------------------------------------
Parameters  : value       lower 90%   higher 90%
Photon index: -0.733508     (       )
Epeak [keV] : 104.773      (   )
Norm@50keV  : 9.43428E-03    (     )
------------------------------------------------------------
#Fit statistic : Chi-Squared =          55.54 using 59 PHA bins.
# Reduced chi-squared =         0.9917 for     56 degrees of freedom
# Null hypothesis probability =   4.923194e-01

Photon flux (15-150 keV)    in 1 sec: 0.546845 ( -0.122179  0.121719 ) ph/cm2/s
Energy fluence (15-150 keV)             : 4.34851e-08 ( -1.20569e-08  1.20874e-08 ) ergs/cm2
Time-resolved spectra
Distribution
T90 vs. Hardness ratio plot
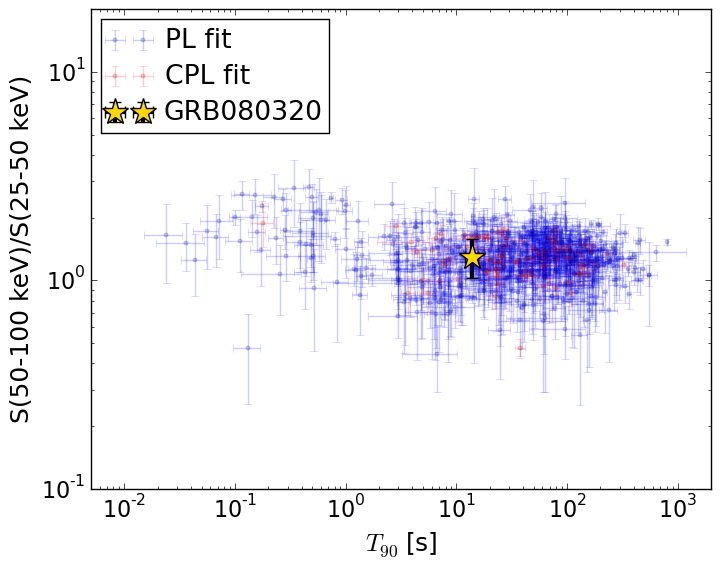
T90                                   = 13.816 sec.
Hardness ratio (energy fluence ratio) = 1.29909219122
S(15-50 keV) vs. S(50-150 keV) plot
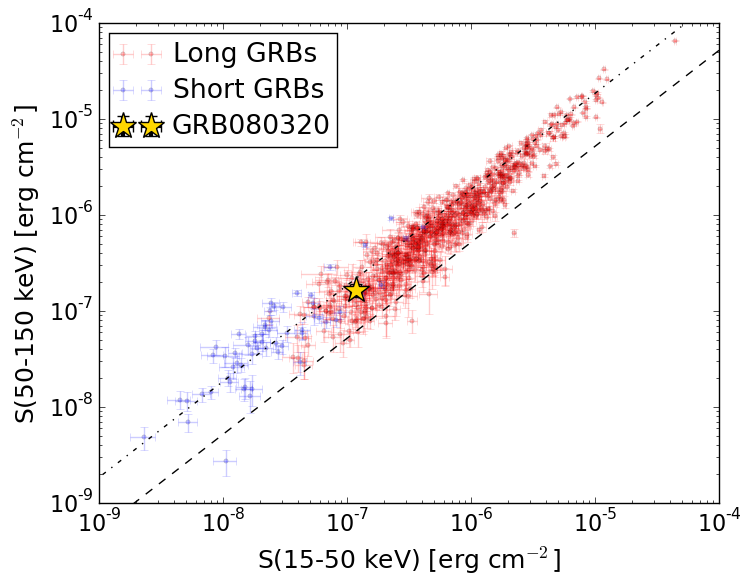
S(15-50 keV)  = 1.177637e-07
S(50-150 keV) = 1.6570476e-07
The dash-dotted line and the dashed line traces the fluences calculated from the Band function with Epeak = 15 and 150 keV, respectively. Both lines assume a canonical values of alpha = -1 and beta = -2.5.
Mask shadow pattern
IMX = -4.056294241503268E-01, IMY = 1.188761161799625E-02
Spacecraft aspect plot
Bright source in the pre-burst/pre-slew/post-slew images
Pre-burst image of 15-350 keV band
Time interval of the image:
-239.120000 -1.672000

# RAcent  DECcent POSerr Theta    Phi  PeakCts   SNR AngSep     Name
#  [deg]    [deg]    ['] [deg]  [deg]                   [']
254.3504  35.4530    9.0  37.3  -48.2   0.3554   1.3    8.5	Her X-1
204.9581  -2.2351    2.6  46.3   47.2   3.3904   4.4 ------	UNKNOWN
220.0524  24.3710    2.4  22.7   11.3   0.8379   4.8 ------	UNKNOWN
223.8137  42.3050    2.1  12.8  -42.8   0.8491   5.4 ------	UNKNOWN
272.4188  64.6508    3.3  41.1  -98.2   3.3110   3.6 ------	UNKNOWN
Pre-slew background subtracted image of 15-350 keV band
Time interval of the image:
-1.672000 13.848000

# RAcent  DECcent POSerr Theta    Phi  PeakCts   SNR AngSep     Name
#  [deg]    [deg]    ['] [deg]  [deg]                   [']
254.3080  35.2121   12.6  37.4  -47.9  -0.0549  -0.9   10.7	Her X-1
191.1070   6.1474    2.6  40.2   69.2   0.6407   4.5 ------	UNKNOWN
177.7695  57.1650    0.8  22.1 -178.3   0.4939  14.8 ------	UNKNOWN
233.1466  20.3869    2.1  32.5   -6.6   0.2241   5.5 ------	UNKNOWN
207.8806  52.8815    2.0   8.9 -128.7   0.1889   5.7 ------	UNKNOWN
Post-slew image of 15-350 keV band
Time interval of the image:
81.980600 93.980590

# RAcent  DECcent POSerr Theta    Phi  PeakCts   SNR AngSep     Name
#  [deg]    [deg]    ['] [deg]  [deg]                   [']
254.3764  35.4802    6.0  20.2   21.4  -0.0599  -1.9    9.2	Her X-1
268.4484  -1.4423    2.6  57.4   -0.9   0.8041   4.4    4.9	SW J1753.5-0127
288.7043  10.8776   20.3  50.2  -28.9  -0.0460  -0.6    6.9	GRS 1915+105
299.5540  35.1577    2.7  34.2  -60.5   0.2263   4.2    3.2	Cyg X-1
308.1798  41.0285    5.8  34.9  -76.3   0.1265   2.0    5.5	Cyg X-3
256.8826   0.3139    2.4  55.1   13.0   0.8086   4.9 ------	UNKNOWN
234.9479  45.9162    1.9  17.8   78.3   0.2117   6.2 ------	UNKNOWN
265.0477   6.2056    2.2  49.4    2.5   0.3417   5.3 ------	UNKNOWN
 89.7630  65.9263    2.0  58.4 -174.7   1.0499   5.6 ------	UNKNOWN
344.6890  56.7460    2.5  44.6 -118.5   0.5615   4.6 ------	UNKNOWN