Analysis Summary
Notes:
- 1) No attempt has been made to eliminate the non-significant decimal places.
- 2) This batgrbproduct analysis is done using the HEASARC data.
- 3) This batgrbproduct analysis is using the flight position for the mask-weighting calculation.
======================================================================
                  BAT GRB EVENT DATA PROCESSING REPORT
    Process Script Ver: batgrbproduct v2.46
    Process Start Time: Mon Jan 20 03:20:41 EST 2014
             Host Name: batevent1
   Current Working Dir: /local/data/batevent/batevent_reproc/trigger307604
======================================================================

  Trigger: 00307604      Segment: 000

  BAT Trigger Time: 228110960   [s; MET]
      Trigger Stop: 228111024   [s; MET]
               UTC: 2008-03-25T04:09:17.332080    [includes UTCF correction]
       Where From?: TDRSS position message

  BAT
    RA: 277.894805295646   Dec: 36.5106329498597  [deg; J2000]

     Catalogged Source?: NO
     Point Source?:      YES
     GRB Indicated?:     YES    [ by BAT flight software ]
     Image S/N Ratio:    7.46
     Image Trigger?:     YES
     Rate S/N Ratio:     0  [ if not an image trigger ]
     Image S/N Ratio:    7.46

  Analysis Position:   [ source = BAT ]
    RA: 277.894805295646   Dec: 36.5106329498597  [deg; J2000]

  Refined Position:   [ source = BAT pre-slew burst ]
    RA: 277.903438174341   Dec: 36.5163054322944  [deg; J2000]
        { 18h 31m 36.8s , +36d 30' 58.7" }
         +/- 1.92534559797056 [arcmin] (estimated 90% radius based on SNR)
         +/- 0.922876322742614 [arcmin] (formal 1-sigma fit error)
    SNR: 11.9310148211606

  Angular difference between the analysis and refined position is 0.537723 arcmin

  Partial Coding Fraction: 0.1083984    [ including projection effects ]

  Duration
     T90: 166.740000009537 +/- 32.5933250583472
        Measured from: -26.944000005722
                   to: 139.796000003815     [s; relative to TRIGTIME]
     T50: 67.6760000288486 +/- 19.1432508107739
        Measured from: -4.40000000596046
                   to: 63.2760000228882     [s; relative to TRIGTIME]


  Fluence
     Peak Flux  (peak 1 second)
        Measured from: 43.8000000119209
                   to: 44.8000000119209     [s; relative to TRIGTIME]
     Total Fluence
        Measured from: -33.33599999547
                   to: 170.027999997139     [s; relative to TRIGTIME]

             Band 1     Band 2     Band 3     Band 4
              15-25      25-50     50-100    100-350     keV
 Total     1.973052   2.459153   2.238778   0.462694
           0.220480   0.205232   0.180215   0.160362 [error]
 Peak      0.067478   0.027181   0.034865   0.040936
           0.019997   0.018949   0.016481   0.014405 [error]

     [ fluence units of on-axis counts / fully illuminated detector ]

======================================================================


====== Table of the duration information =============================

        Value   tstart    tstop
T100  203.364  -33.336  170.028
T90   166.740  -26.944  139.796
T50    67.676   -4.400   63.276
Peak    1.000   43.800   44.800


====== Spectral Analysis Summary =====================================

Model      : spectral model: simple power-law (PL) and cutoff power-law (CPL)
Ph_index   : photon index: E^{Ph_index}
Ph_90err   : 90% error of the photon index
Epeak      : Epeak in keV
Epeak_90err: 90% error of Epeak
Norm       : normalization at 50 keV in both the PL model and CPL model
Nomr_90err : 90% error of the normalization
chi2       : Chi-Squared
dof        : degree of freedo

=== Time-averaged spectral analysis ===
(Best model with acceptable fit: PL)

Model Ph_index Ph_90err_low Ph_90err_hi  Epeak  Epeak_90err_low  Epeak_90err_hi  Norm       Nomr_90err_low    Norm_90err_hi    chi2    dof
PL      -1.560    -0.163      0.162       -           -               -         2.62e-03     -2.24e-04          2.23e-04      49.620   57
CPL     -1.559    -0.162      0.346     9999.350    -9999.350      -9999.350      2.63e-03     -2.63e-03          -1.13e-03      49.630   56


=== 1-s peak spectral analysis ===
(Best model with acceptable fit: N/A)

Model Ph_index Ph_90err_low Ph_90err_hi  Epeak  Epeak_90err_low  Epeak_90err_hi  Norm       Nomr_90err_low    Norm_90err_hi    chi2    dof
PL      -2.527     -2.450     5.035       -           -               -         7.14e-03     -7.14e-03          5.61e-03      64.310   57
CPL     -2.137     -0.838     1.932       65.699      N/A           N/A         7.54e-03        N/A               N/A         64.190   56


=== Fluence/Peak Flux Summary ===

              Model    Band1     Band2     Band3     Band4     Band5     Total
                       15-25     25-50    50-100    100-350    15-150    15-350    keV
Fluence         PL   7.20e-07  1.27e-06  1.73e-06  4.84e-06  5.01e-06  8.56e-06   erg/cm2
      90%_error_low -1.19e-07 -1.26e-07 -1.85e-07 -1.08e-06 -4.46e-07 -1.20e-06   erg/cm2
      90%_error_hi   1.26e-07  1.24e-07  1.82e-07  1.27e-06  4.48e-07  1.35e-06   erg/cm2
Peak flux       PL   8.09e-01  4.38e-01  1.49e-01  6.53e-02  1.43e+00  1.46e+00   ph/cm2/s
      90%_error_low -8.09e-01 -2.99e-01 -1.49e-01 -6.53e-02 -1.43e+00 -6.41e-01   ph/cm2/s
      90%_error_hi   6.51e-01  2.03e-01  2.18e-01  8.99e-01  6.48e-01  6.46e-01   ph/cm2/s

Fluence        CPL   7.38e-07  1.28e-06  1.71e-06  5.27e-06  5.04e-06  8.52e-06   erg/cm2
      90%_error_low    N/A    -1.26e-07    N/A    -2.24e-06 -4.76e-07 -1.76e-06   erg/cm2
      90%_error_hi     N/A     1.24e-07    N/A     5.53e-07  4.19e-07  1.30e-06   erg/cm2
Peak flux      CPL   8.30e-01  1.45e-01  1.28e-02  1.50e-03  9.88e-01  9.86e-01   ph/cm2/s
      90%_error_low -5.38e-01 -1.45e-01 -1.28e-02     N/A   -6.52e-01 -6.50e-01   ph/cm2/s
      90%_error_hi   5.38e-01  3.32e-01  1.10e-01     N/A    7.31e-01  7.39e-01   ph/cm2/s

======================================================================
Image
Pre-slew 15.0-350.0 keV image (Event data)
#   RAcent    DECcent   POSerr    Theta     Phi              Peak Cts       SNR   Name
  277.9034    36.5163   0.0161    55.8155  -165.2759         5.5479682     11.931 TRIG_00307604

Foreground time interval of the image:
-33.336  71.901 (delta_t = 105.237 [sec])
Background time interval of the image:
-323.000 -33.336 (delta_t = 289.664 [sec])
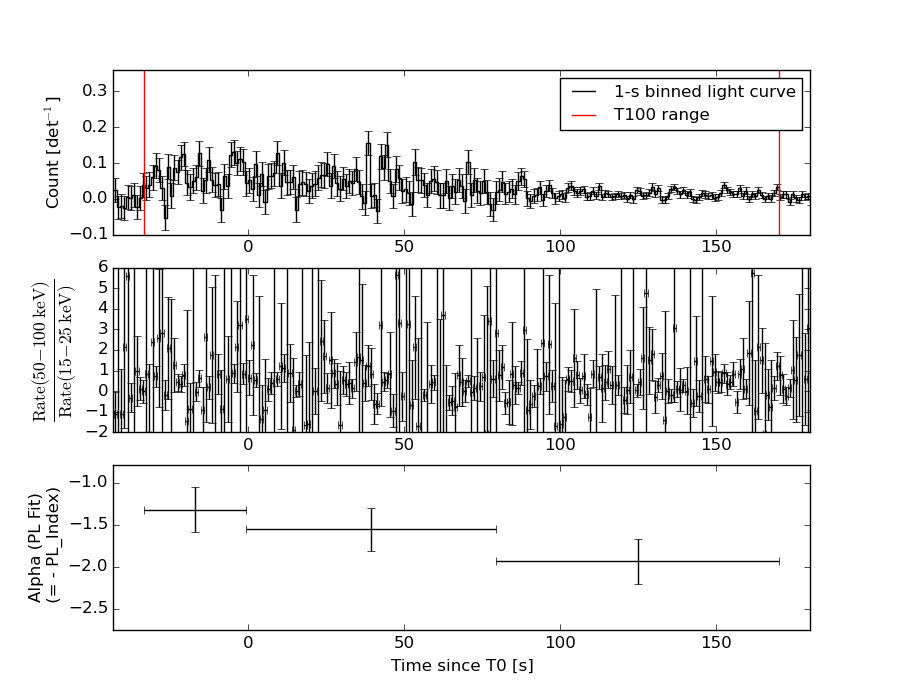
Light Curves
Note: The mask-weighted lightcurves have units of either count/det or counts/sec/det, where a det is 0.4 x 0.4 = 0.16 sq cm.
Full-time range; 1 s binning
Other quick-look light curves:
- 64 ms binning (zoomed)
- 16 ms binning (zoomed)
- 8 ms binning (zoomed)
- 2 ms binning (zoomed)
- SN=5 or 10 s binning (full-time range)
- Raw light curve
Spectra
- 64 ms binning (zoomed)
- 16 ms binning (zoomed)
- 8 ms binning (zoomed)
- 2 ms binning (zoomed)
- SN=5 or 10 s binning (full-time range)
- Raw light curve
Spectra
Notes:
- 1) The fitting includes the systematic errors.
- 2) When the burst includes telescope slew time periods, the fitting uses an average response file made from multiple 5-s response files through out the slew time plus single time preiod for the non-slew times, and weighted by the total counts in the corresponding time period using addrmf. An average response file is needed becuase a spectral fit using the pre-slew DRM will introduce some errors in both a spectral shape and a normalization if the PHA file contains a lot of the slew/post-slew time interval.
- 3) For fits to more complicated models (e.g. a power-law over a cutoff power-law), the BAT team has decided to require a chi-square improvement of more than 6 for each extra dof.
Time averaged spectrum fit using the average DRM
Power-law model
Time interval is from  -33.336 sec. to  170.028 sec.

Spectral model in power-law:
------------------------------------------------------------
Parameters  : value       lower 90%   higher 90%
Photon index: -1.55975     ( -0.162894   0.162121 )
Norm@50keV  : 2.61946E-03    ( -0.000223514   0.000223388 )
------------------------------------------------------------
#Fit statistic : Chi-Squared =          49.62 using 59 PHA bins.
# Reduced chi-squared =         0.8705 for     57 degrees of freedom
# Null hypothesis probability =   7.456018e-01

Photon flux (15-150 keV)    in 203.4 sec: 0.332560 ( -0.031625  0.031865 ) ph/cm2/s
Energy fluence (15-150 keV)             : 5.00958e-06 ( -4.46048e-07  4.47761e-07 ) ergs/cm2
Cutoff power-law model
Time interval is from  -33.336 sec. to  170.028 sec.
Spectral model in the cutoff power-law:
------------------------------------------------------------
Parameters  : value       lower 90%   higher 90%
Photon index: -2.71002     ( -0.162146   0.345504 )
Epeak [keV] : 232.430      ( -9999.36 -9999.36 )
Norm@50keV  : 6.80408E-04    ( -0.000680419   0.000820627 )
------------------------------------------------------------
#Fit statistic : Chi-Squared =          48.26 using 59 PHA bins.
# Reduced chi-squared =         0.8618 for     56 degrees of freedom
# Null hypothesis probability =   7.593445e-01

Photon flux (15-150 keV)    in 203.4 sec: 0.332565 ( -0.03167  0.031831 ) ph/cm2/s
Energy fluence (15-150 keV)             : 5.03769e-06 ( -4.75525e-07  4.18644e-07 ) ergs/cm2
1-s peak spectrum fit
Power-law model
Time interval is from   43.800 sec. to   44.800 sec.

Spectral model in power-law:
------------------------------------------------------------
Parameters  : value       lower 90%   higher 90%
Photon index: -2.52716     ( -2.4346   5.05047 )
Norm@50keV  : 7.14361E-03    ( -0.00704237   0.00570705 )
------------------------------------------------------------
#Fit statistic : Chi-Squared =          64.31 using 59 PHA bins.
# Reduced chi-squared =          1.128 for     57 degrees of freedom
# Null hypothesis probability =   2.358706e-01

Photon flux (15-150 keV)    in 1 sec: 1.43064 ( -1.43064  0.648 ) ph/cm2/s
Energy fluence (15-150 keV)             : 7.0531e-08 ( -3.85332e-08  4.74766e-08 ) ergs/cm2
Cutoff power-law model
Time interval is from   43.800 sec. to   44.800 sec.
Spectral model in the cutoff power-law:
------------------------------------------------------------
Parameters  : value       lower 90%   higher 90%
Photon index: -2.13686     ( -0.838277   1.93217 )
Epeak [keV] : 65.6990      (   )
Norm@50keV  : 7.54353E-03    (     )
------------------------------------------------------------
#Fit statistic : Chi-Squared =          64.19 using 59 PHA bins.
# Reduced chi-squared =          1.146 for     56 degrees of freedom
# Null hypothesis probability =   2.113628e-01

Photon flux (15-150 keV)    in 1 sec: 0.988082 ( -0.651627  0.730718 ) ph/cm2/s
Energy fluence (15-150 keV)             : 4.92674e-08 ( 0  0 ) ergs/cm2
Time-resolved spectra
Distribution
T90 vs. Hardness ratio plot
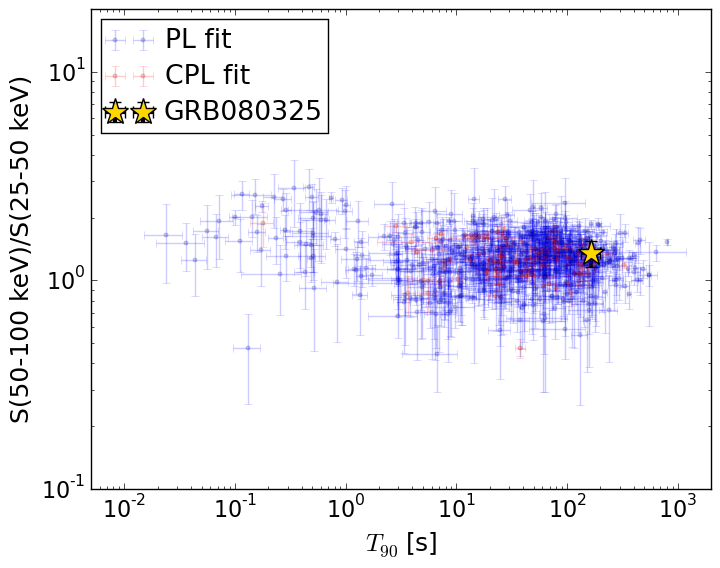
T90                                   = 166.74 sec.
Hardness ratio (energy fluence ratio) = 1.35687588
S(15-50 keV) vs. S(50-150 keV) plot
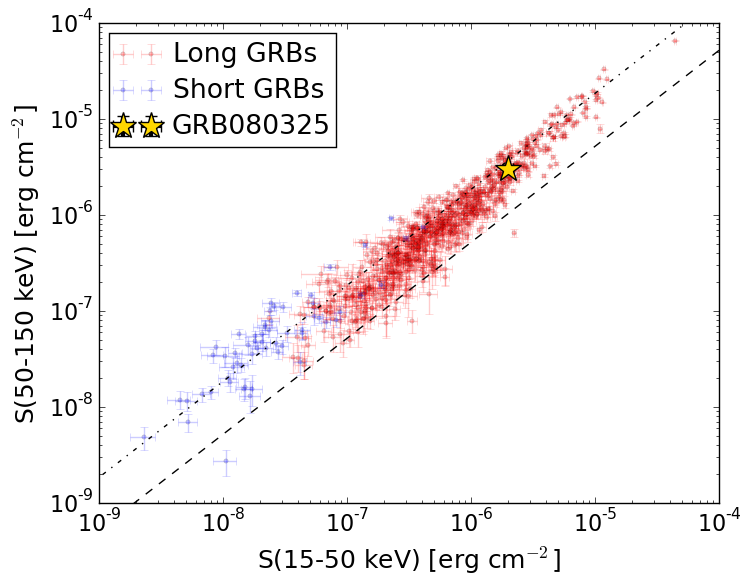
S(15-50 keV)  = 1.9944049e-06
S(50-150 keV) = 3.015198e-06
The dash-dotted line and the dashed line traces the fluences calculated from the Band function with Epeak = 15 and 150 keV, respectively. Both lines assume a canonical values of alpha = -1 and beta = -2.5.
Mask shadow pattern
IMX = -1.423964840634192E+00, IMY = 3.742103009276630E-01
Spacecraft aspect plot
Bright source in the pre-burst/pre-slew/post-slew images
Pre-burst image of 15-350 keV band
Time interval of the image:
-323.000000 -33.336000

# RAcent  DECcent POSerr Theta    Phi  PeakCts   SNR AngSep     Name
#  [deg]    [deg]    ['] [deg]  [deg]                   [']
244.9851 -15.6437    0.3  26.6  102.7  13.9691  41.6    0.4	Sco X-1
256.0047 -37.8386   12.7  23.7   43.8   0.2387   0.9    0.9	4U 1700-377
256.4226 -36.3957    3.4  22.4   45.6   0.8712   3.4    1.8	GX 349+2
263.0684 -24.5916    6.1  10.4   65.9   0.3975   1.9    9.8	GX 1+4
264.7788 -44.4615  606.1  26.2   22.3   0.0047   0.0    1.7	4U 1735-44
268.3510  -1.4067    3.2  18.2  175.8   0.7904   3.6    2.9	SW J1753.5-0127
270.2532 -25.1350    2.9   6.4   29.0   0.9307   4.0    3.7	GX 5-1
270.4783 -25.8180    7.8   7.0   25.5   0.3503   1.5   10.5	GRS 1758-258
274.1067 -14.1291    3.2   5.1 -154.0   0.8356   3.6    8.1	GX 17+2
275.8813 -30.3850    1.9  11.7   -4.5   1.4668   6.2    2.5	H1820-303
284.8421 -24.8241    4.6  12.7  -51.3   0.5810   2.5   12.0	HT1900.1-2455
288.7959  10.9322    7.3  34.0 -141.1   0.4574   1.6    0.8	GRS 1915+105
262.8337 -33.9914    0.0  17.3   37.9   0.3092   1.2   12.2	GX 354-0
250.5244   1.3033    2.4  29.8  140.4   1.4849   4.8 ------	UNKNOWN
267.2978 -26.6379    1.6   9.0   41.5   1.6296   7.1 ------	UNKNOWN
285.3758 -51.3951    2.8  33.9   -4.8   1.3330   4.2 ------	UNKNOWN
320.2097 -62.3339    2.4  54.2  -15.4   3.5990   4.8 ------	UNKNOWN
294.2971   1.8125    2.7  29.8 -122.5   1.2407   4.3 ------	UNKNOWN
326.8394 -39.4148    4.7  50.6  -44.6   3.5475   2.5 ------	UNKNOWN
Pre-slew background subtracted image of 15-350 keV band
Time interval of the image:
-33.336000 71.900600

# RAcent  DECcent POSerr Theta    Phi  PeakCts   SNR AngSep     Name
#  [deg]    [deg]    ['] [deg]  [deg]                   [']
244.8824 -15.7194  131.8  26.6  102.4   0.0148   0.1    7.3	Sco X-1
255.9858 -37.8440   46.6  23.7   43.8  -0.0331  -0.2    0.0	4U 1700-377
256.4367 -36.4244  102.7  22.4   45.6  -0.0147  -0.1    0.1	GX 349+2
263.1547 -24.5838    0.0  10.4   65.8  -0.2383  -2.1   12.5	GX 1+4
264.7629 -44.3324   18.1  26.1   22.4  -0.0894  -0.6    7.1	4U 1735-44
268.4966  -1.3491    3.8  18.2  176.3  -0.3358  -3.1    9.9	SW J1753.5-0127
270.4446 -25.0423   13.3   6.3   27.8   0.1033   0.9    9.0	GX 5-1
270.4502 -25.6291   11.4   6.9   26.1   0.1320   1.1   10.5	GRS 1758-258
273.9913 -13.9454   18.3   5.3 -155.7   0.0703   0.6    5.5	GX 17+2
276.0831 -30.2989   12.8  11.7   -5.4   0.1063   0.9    9.2	H1820-303
285.1796 -25.0366  738.3  13.1  -51.1   0.0017   0.0   10.5	HT1900.1-2455
288.8584  11.0120    5.7  34.1 -141.1   0.3037   2.0    5.3	GRS 1915+105
263.0010 -33.8181  287.5  17.0   37.8   0.0048   0.0    1.2	GX 354-0
280.2351  14.0264    1.9  33.9 -157.1   0.8281   6.1 ------	UNKNOWN
277.9034  36.5163    1.0  55.8 -165.3   5.5473  11.9 ------	UNKNOWN
283.7191  26.4876    2.5  46.8 -156.7   1.0349   4.6 ------	UNKNOWN
302.8515 -14.1157    2.5  29.4  -85.5   0.7552   4.5 ------	UNKNOWN
283.8394  38.8757    2.6  58.9 -160.2   3.2901   4.4 ------	UNKNOWN
Post-slew image of 15-350 keV band
Time interval of the image:
141.100600 511.800590

# RAcent  DECcent POSerr Theta    Phi  PeakCts   SNR AngSep     Name
#  [deg]    [deg]    ['] [deg]  [deg]                   [']
254.4624  35.3365    0.9  19.0   93.2   3.2457  12.7    0.4	Her X-1
268.3866  -1.4013    3.8  38.9   14.9   0.9820   3.1    3.3	SW J1753.5-0127
274.0458 -13.8874    5.2  50.5    4.5   1.2499   2.2    9.2	GX 17+2
288.8301  10.9451    1.6  27.4  -24.2   1.6878   7.2    1.9	GRS 1915+105
299.5895  35.1996    0.4  17.6  -92.5   6.5752  28.8    0.1	Cyg X-1
308.0748  40.9900    3.0  23.8 -110.4   1.0497   3.9    2.8	Cyg X-3
326.2673  38.2657   10.5  38.0 -108.0   0.7449   1.1    5.6	Cyg X-2
245.7964   1.4475    3.7  45.9   47.4   3.3885   3.1 ------	UNKNOWN
216.6609  69.2903    3.0  46.1  154.2   2.2934   3.9 ------	UNKNOWN
289.8213  68.1432    2.5  32.3 -172.0   1.0959   4.6 ------	UNKNOWN
 40.7373  83.5207    3.5  57.2 -173.8   4.2875   3.3 ------	UNKNOWN