Analysis Summary
Notes:
- 1) No attempt has been made to eliminate the non-significant decimal places.
- 2) This batgrbproduct analysis is done using the HEASARC data.
- 3) This batgrbproduct analysis is using the flight position for the mask-weighting calculation.
======================================================================
                  BAT GRB EVENT DATA PROCESSING REPORT
    Process Script Ver: batgrbproduct v2.46
    Process Start Time: Mon Jan 20 03:08:18 EST 2014
             Host Name: batevent1
   Current Working Dir: /local/data/batevent/batevent_reproc/trigger308041
======================================================================

  Trigger: 00308041      Segment: 000

  BAT Trigger Time: 228541279.552   [s; MET]
      Trigger Stop: 228541280.576   [s; MET]
               UTC: 2008-03-30T03:41:16.872120    [includes UTCF correction]
       Where From?: TDRSS position message

  BAT
    RA: 169.301665972192   Dec: 30.5703275537686  [deg; J2000]

     Catalogged Source?: NO
     Point Source?:      YES
     GRB Indicated?:     YES    [ by BAT flight software ]
     Image S/N Ratio:    7.58
     Image Trigger?:     NO
     Rate S/N Ratio:     10.9544511501033  [ if not an image trigger ]
     Image S/N Ratio:    7.58

  Analysis Position:   [ source = BAT ]
    RA: 169.301665972192   Dec: 30.5703275537686  [deg; J2000]

  Refined Position:   [ source = BAT pre-slew burst ]
    RA: 169.270635843616   Dec: 30.6104622445136  [deg; J2000]
        { 11h 17m 05.0s , +30d 36' 37.7" }
         +/- 1.83809059351469 [arcmin] (estimated 90% radius based on SNR)
         +/- 0.791458960053399 [arcmin] (formal 1-sigma fit error)
    SNR: 12.748273202466

  Angular difference between the analysis and refined position is 2.892661 arcmin

  Partial Coding Fraction: 0.53125    [ including projection effects ]

  Duration
     T90: 60.363999992609 +/- 36.3982559836483
        Measured from: -0.0799999833106995
                   to: 60.2840000092983     [s; relative to TRIGTIME]
     T50: 31.1000000238419 +/- 25.1133284827267
        Measured from: 1.34000000357628
                   to: 32.4400000274181     [s; relative to TRIGTIME]


  Fluence
     Peak Flux  (peak 1 second)
        Measured from: 0.440000027418137
                   to: 1.44000002741814     [s; relative to TRIGTIME]
     Total Fluence
        Measured from: -0.547999978065491
                   to: 62.1200000047684     [s; relative to TRIGTIME]

             Band 1     Band 2     Band 3     Band 4
              15-25      25-50     50-100    100-350     keV
 Total     0.350104   0.224142   0.069993   0.050452
           0.042680   0.043759   0.038567   0.034177 [error]
 Peak      0.054930   0.033829   0.016402   0.009096
           0.007106   0.007336   0.005930   0.005076 [error]

     [ fluence units of on-axis counts / fully illuminated detector ]

======================================================================


====== Table of the duration information =============================

        Value   tstart    tstop
T100   62.668   -0.548   62.120
T90    60.364   -0.080   60.284
T50    31.100    1.340   32.440
Peak    1.000    0.440    1.440


====== Spectral Analysis Summary =====================================

Model      : spectral model: simple power-law (PL) and cutoff power-law (CPL)
Ph_index   : photon index: E^{Ph_index}
Ph_90err   : 90% error of the photon index
Epeak      : Epeak in keV
Epeak_90err: 90% error of Epeak
Norm       : normalization at 50 keV in both the PL model and CPL model
Nomr_90err : 90% error of the normalization
chi2       : Chi-Squared
dof        : degree of freedo

=== Time-averaged spectral analysis ===
(Best model with acceptable fit: PL)

Model Ph_index Ph_90err_low Ph_90err_hi  Epeak  Epeak_90err_low  Epeak_90err_hi  Norm       Nomr_90err_low    Norm_90err_hi    chi2    dof
PL      -2.653    -0.557      0.448       -           -               -         4.48e-04     -1.72e-04          1.74e-04      51.470   57
CPL     -1.981    -0.017      1.127        0.999      -0.615        21.913      1.20e-03     -4.07e-04          8.00e-04      52.990   56


=== 1-s peak spectral analysis ===
(Best model with acceptable fit: PL)

Model Ph_index Ph_90err_low Ph_90err_hi  Epeak  Epeak_90err_low  Epeak_90err_hi  Norm       Nomr_90err_low    Norm_90err_hi    chi2    dof
PL      -2.549     -0.579     0.463       -           -               -         4.66e-03     -1.81e-03          1.76e-03      59.790   57
CPL     -1.986      1.986     1.986        1.080     278.868        -1.080      9.60e-03     -9.60e-03          -4.37e-03      61.610   56


=== Fluence/Peak Flux Summary ===

              Model    Band1     Band2     Band3     Band4     Band5     Total
                       15-25     25-50    50-100    100-350    15-150    15-350    keV
Fluence         PL   1.07e-07  9.87e-08  6.27e-08  6.12e-08  2.94e-07  3.30e-07   erg/cm2
      90%_error_low -2.28e-08 -2.50e-08 -2.99e-08 -4.15e-08 -7.16e-08 -9.52e-08   erg/cm2
      90%_error_hi   2.28e-08  2.30e-08  3.62e-08  8.27e-08  7.85e-08  1.28e-07   erg/cm2
Peak flux       PL   5.31e-01  2.90e-01  9.90e-02  4.40e-02  9.44e-01  9.64e-01   ph/cm2/s
      90%_error_low -1.30e-01 -7.11e-02 -4.70e-02 -2.95e-02 -1.80e-01 -1.87e-01   ph/cm2/s
      90%_error_hi   1.31e-01  6.48e-02  5.38e-02  5.47e-02  1.80e-01  1.88e-01   ph/cm2/s

Fluence        CPL   1.03e-07  6.83e-08  3.14e-08  2.51e-08  2.13e-07  2.27e-07   erg/cm2
      90%_error_low -2.38e-08 -3.57e-08 -2.43e-08 -2.28e-08 -8.36e-08 -9.67e-08   erg/cm2
      90%_error_hi   2.38e-08  4.61e-08  5.80e-08  1.17e-07  1.41e-07  2.16e-07   erg/cm2
Peak flux      CPL   4.63e-01  1.15e-01  6.34e-02  1.47e-02  9.18e-01  9.17e-01   ph/cm2/s
      90%_error_low -1.02e-01 1.29e-01     N/A       N/A   -1.73e-01     N/A     ph/cm2/s
      90%_error_hi   1.56e-01  2.59e-01     N/A       N/A    1.85e-01     N/A     ph/cm2/s

======================================================================
Image
Pre-slew 15.0-350.0 keV image (Event data)
#   RAcent    DECcent   POSerr    Theta     Phi              Peak Cts       SNR   Name
  169.2706    30.6105   0.0151    27.6815    53.9119         0.5591020     12.748 TRIG_00308041

Foreground time interval of the image:
 -0.548  11.349 (delta_t =  11.897 [sec])
Background time interval of the image:
-239.552  -0.548 (delta_t = 239.004 [sec])
Light Curves
Note: The mask-weighted lightcurves have units of either count/det or counts/sec/det, where a det is 0.4 x 0.4 = 0.16 sq cm.
Full-time range; 1 s binning
Other quick-look light curves:
- 64 ms binning (zoomed)
- 16 ms binning (zoomed)
- 8 ms binning (zoomed)
- 2 ms binning (zoomed)
- SN=5 or 10 s binning (full-time range)
- Raw light curve
Spectra
- 64 ms binning (zoomed)
- 16 ms binning (zoomed)
- 8 ms binning (zoomed)
- 2 ms binning (zoomed)
- SN=5 or 10 s binning (full-time range)
- Raw light curve
Spectra
Notes:
- 1) The fitting includes the systematic errors.
- 2) When the burst includes telescope slew time periods, the fitting uses an average response file made from multiple 5-s response files through out the slew time plus single time preiod for the non-slew times, and weighted by the total counts in the corresponding time period using addrmf. An average response file is needed becuase a spectral fit using the pre-slew DRM will introduce some errors in both a spectral shape and a normalization if the PHA file contains a lot of the slew/post-slew time interval.
- 3) For fits to more complicated models (e.g. a power-law over a cutoff power-law), the BAT team has decided to require a chi-square improvement of more than 6 for each extra dof.
Time averaged spectrum fit using the average DRM
Power-law model
Time interval is from   -0.548 sec. to   62.120 sec.

Spectral model in power-law:
------------------------------------------------------------
Parameters  : value       lower 90%   higher 90%
Photon index: -2.65319     ( -0.556789   0.448208 )
Norm@50keV  : 4.48251E-04    ( -0.000171823   0.000173541 )
------------------------------------------------------------
#Fit statistic : Chi-Squared =          51.47 using 59 PHA bins.
# Reduced chi-squared =         0.9030 for     57 degrees of freedom
# Null hypothesis probability =   6.816745e-01

Photon flux (15-150 keV)    in 62.67 sec: 9.70283E-02 ( -0.0171715  0.0172117 ) ph/cm2/s
Energy fluence (15-150 keV)             : 2.94205e-07 ( -7.1628e-08  7.85299e-08 ) ergs/cm2
Cutoff power-law model
Time interval is from   -0.548 sec. to   62.120 sec.
Spectral model in the cutoff power-law:
------------------------------------------------------------
Parameters  : value       lower 90%   higher 90%
Photon index: -1.98097     ( -0.0172773   1.12702 )
Epeak [keV] : 0.999022      ( -0.614761 21.9135 )
Norm@50keV  : 1.19525E-03    ( -0.000406158   0.000801018 )
------------------------------------------------------------
#Fit statistic : Chi-Squared =          52.99 using 59 PHA bins.
# Reduced chi-squared =         0.9462 for     56 degrees of freedom
# Null hypothesis probability =   5.895831e-01

Photon flux (15-150 keV)    in 62.67 sec: 8.08363E-02 ( -0.0232509  0.0287417 ) ph/cm2/s
Energy fluence (15-150 keV)             : 2.12824e-07 ( -8.35679e-08  1.40913e-07 ) ergs/cm2
1-s peak spectrum fit
Power-law model
Time interval is from    0.440 sec. to    1.440 sec.

Spectral model in power-law:
------------------------------------------------------------
Parameters  : value       lower 90%   higher 90%
Photon index: -2.54875     ( -0.578482   0.463209 )
Norm@50keV  : 4.66039E-03    ( -0.00181148   0.00175934 )
------------------------------------------------------------
#Fit statistic : Chi-Squared =          59.79 using 59 PHA bins.
# Reduced chi-squared =          1.049 for     57 degrees of freedom
# Null hypothesis probability =   3.745655e-01

Photon flux (15-150 keV)    in 1 sec: 0.943691 ( -0.179999  0.180029 ) ph/cm2/s
Energy fluence (15-150 keV)             : 4.72498e-08 ( -1.22448e-08  1.31854e-08 ) ergs/cm2
Cutoff power-law model
Time interval is from    0.440 sec. to    1.440 sec.
Spectral model in the cutoff power-law:
------------------------------------------------------------
Parameters  : value       lower 90%   higher 90%
Photon index: -3.25122     ( 1.98632   1.98632 )
Epeak [keV] : 367.101      ( -108.477 -388.425 )
Norm@50keV  : 2.06015E-03    ( -0.00183985   0.00339243 )
------------------------------------------------------------
#Fit statistic : Chi-Squared =          57.57 using 59 PHA bins.
# Reduced chi-squared =          1.028 for     56 degrees of freedom
# Null hypothesis probability =   4.168115e-01

Photon flux (15-150 keV)    in 1 sec: 0.918178 ( -0.173203  0.185242 ) ph/cm2/s
Energy fluence (15-150 keV)             : 0 ( 0  0 ) ergs/cm2
Time-resolved spectra
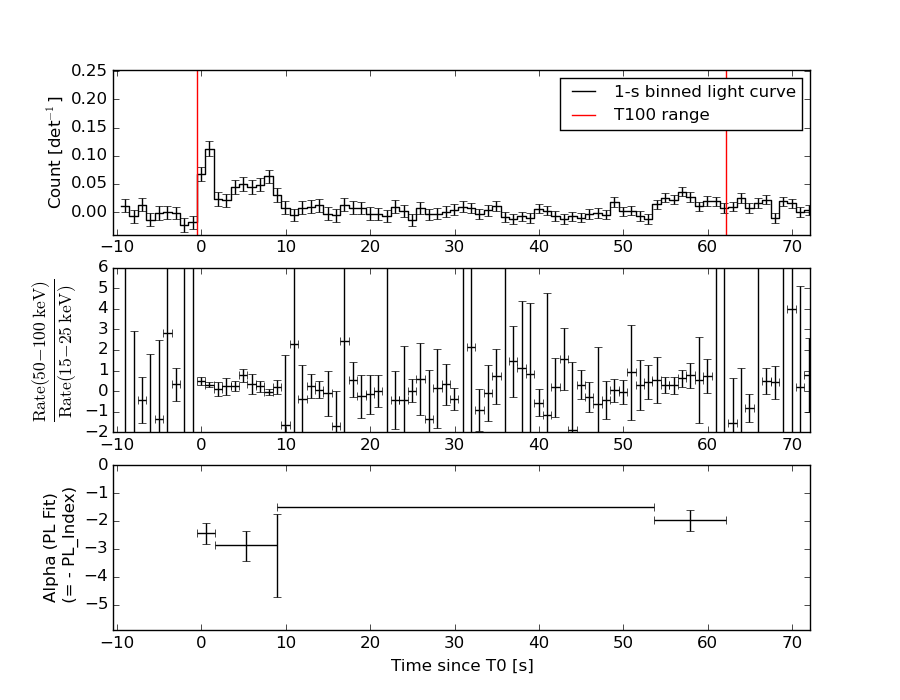
Distribution
T90 vs. Hardness ratio plot
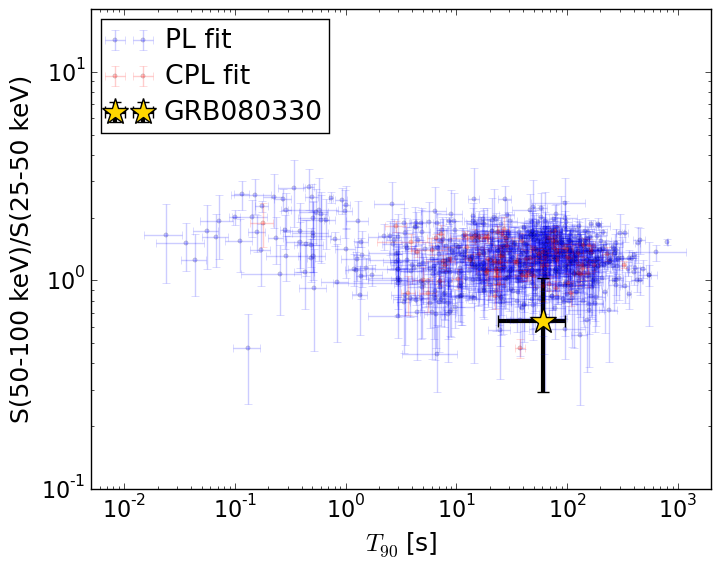
T90                                   = 60.364 sec.
Hardness ratio (energy fluence ratio) = 0.635887487227
S(15-50 keV) vs. S(50-150 keV) plot
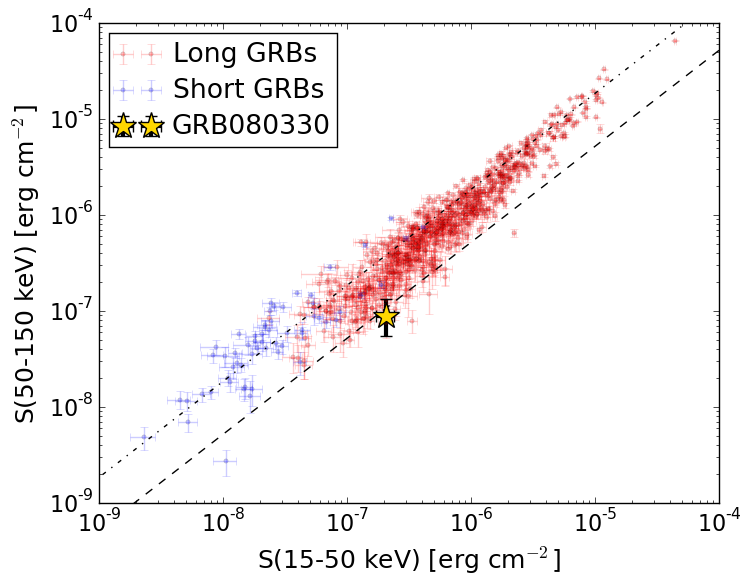
S(15-50 keV)  = 2.0597731e-07
S(50-150 keV) = 8.822002e-08
The dash-dotted line and the dashed line traces the fluences calculated from the Band function with Epeak = 15 and 150 keV, respectively. Both lines assume a canonical values of alpha = -1 and beta = -2.5.
Mask shadow pattern
IMX = 3.090042556740210E-01, IMY = -4.239350379919042E-01
Spacecraft aspect plot
Bright source in the pre-burst/pre-slew/post-slew images
Pre-burst image of 15-350 keV band
Time interval of the image:
-239.552000 -0.548000

# RAcent  DECcent POSerr Theta    Phi  PeakCts   SNR AngSep     Name
#  [deg]    [deg]    ['] [deg]  [deg]                   [']
194.0676  44.1595    2.6  44.2   23.9   1.5451   4.4 ------	UNKNOWN
166.0728  38.1850    2.1  23.7   37.7   0.9364   5.6 ------	UNKNOWN
147.6045  30.2855    2.5  10.5   78.5   0.6561   4.6 ------	UNKNOWN
190.2619  56.8312    2.4  41.7    5.3   1.1546   4.7 ------	UNKNOWN
134.8017  59.2915    2.4  24.2  -38.5   0.7905   4.9 ------	UNKNOWN
Pre-slew background subtracted image of 15-350 keV band
Time interval of the image:
-0.548000 11.348600

# RAcent  DECcent POSerr Theta    Phi  PeakCts   SNR AngSep     Name
#  [deg]    [deg]    ['] [deg]  [deg]                   [']
169.2706  30.6105    0.9  27.7   53.9   0.5592  12.7 ------	UNKNOWN
 94.0795  62.2995    2.1  37.8  -67.0   0.3564   5.5 ------	UNKNOWN
Post-slew image of 15-350 keV band
Time interval of the image:
59.548590 962.501400

# RAcent  DECcent POSerr Theta    Phi  PeakCts   SNR AngSep     Name
#  [deg]    [deg]    ['] [deg]  [deg]                   [']
161.1037  29.9478    2.8   7.1 -150.8   1.5548   4.1 ------	UNKNOWN
166.1185  38.2419    1.2   8.1  -75.7   3.8069   9.3 ------	UNKNOWN
199.8875  50.2033    2.8  30.1  -17.2   1.7016   4.1 ------	UNKNOWN
217.3439  64.6344    2.7  45.1  -30.9   3.8643   4.2 ------	UNKNOWN
134.9291  66.1614    4.2  41.2  -78.0   5.3577   2.8 ------	UNKNOWN