Analysis Summary
Notes:
- 1) No attempt has been made to eliminate the non-significant decimal places.
- 2) This batgrbproduct analysis is done using the HEASARC data.
- 3) This batgrbproduct analysis is using the flight position for the mask-weighting calculation.
==========================================================================
           BAT GROUND-DETECTED GRB DATA PROCESSING REPORT
    Process Script Ver: batgrbproduct v2.46
    Process Start Time: Mon Jun 22 17:47:15 EDT 2015
             Host Name: bat1
   Current Working Dir: /local/data/bat1/alien/Swift_3rdBATcatalog/event/ground_detect_bursts/scripts
======================================================================

  Trigger: 00308549      Segment: 000

  BAT Trigger Time: 229079937.6
               UTC: 2008-04-05T09:18:54.90   [includes UTCF correction]
       Where From?: Ground analysis (best_duration.txt)
  NOTE: BAT trigger time for ground-detected burst is the T100 start time.

  Refined Position:   [ source = BAT pre-slew image ]
    RA: 162.62554145   Dec: -4.25622439895  [deg; J2000]
        { 10h 50m 30.1s , -4d -15' -22.4" }
        +/- 2.51411725771 [arcmin] (estimated 90% radius based on SNR)
    SNR: 8.15071804977


  Angular difference between the analysis and refined position is Usage: arcmin

  Partial Coding Fraction: 0.296875    [ including projection effects ]

  Duration
     T90: 64. +/- 1.60000002384186
        Measured from: 3.2
                   to: 67.2     [s; relative to TRIGTIME]
     T50: 32.0000000298023 +/- 1.6
        Measured from: 16
                   to: 48     [s; relative to TRIGTIME]


====== Table of the duration information =============================

        Value   tstart    tstop
T100   72.000    0.000   72.000
T90    64.000    3.200   67.200
T50    32.000   16.000   48.000
Peak    1.000   25.900   26.900


====== Spectral Analysis Summary =====================================

Model      : spectral model: simple power-law (PL) and cutoff power-law (CPL)
Ph_index   : photon index: E^{Ph_index}
Ph_90err   : 90% error of the photon index
Epeak      : Epeak in keV
Epeak_90err: 90% error of Epeak
Norm       : normalization at 50 keV in both the PL model and CPL model
Nomr_90err : 90% error of the normalization
chi2       : Chi-Squared
dof        : degree of freedo

=== Time-averaged spectral analysis ===
(Best model with acceptable fit: PL)

Model Ph_index Ph_90err_low Ph_90err_hi  Epeak  Epeak_90err_low  Epeak_90err_hi  Norm       Nomr_90err_low    Norm_90err_hi    chi2    dof
PL      -1.254    -0.097      0.098       -           -               -         1.43e-02     -7.48e-04          7.48e-04      56.050   57
CPL     -1.251    -0.097      0.298     9999.150    -9999.150      -9999.150      1.44e-02     -7.51e-04          7.51e-04      56.060   56


=== 1-s peak spectral analysis ===
(Best model with acceptable fit: N/A)

Model Ph_index Ph_90err_low Ph_90err_hi  Epeak  Epeak_90err_low  Epeak_90err_hi  Norm       Nomr_90err_low    Norm_90err_hi    chi2    dof
PL      N/A         N/A       N/A          -           -               -           N/A           N/A               N/A         N/A        N/A
CPL     N/A         N/A       N/A          N/A         N/A           N/A           N/A           N/A               N/A         N/A        N/A


=== Fluence/Peak Flux Summary ===

              Model    Band1     Band2     Band3     Band4     Band5     Total
                       15-25     25-50    50-100    100-350    15-150    15-350    keV
Fluence         PL   1.37e-07  2.94e-07  4.92e-07  1.89e-06  1.35e-06  2.81e-06   erg/cm2
      90%_error_low -1.42e-08 -1.80e-08 -3.12e-08 -2.62e-07 -7.80e-08 -2.81e-07   erg/cm2
      90%_error_hi   1.47e-08  1.79e-08  3.10e-08  2.91e-07  7.83e-08  3.05e-07   erg/cm2
Peak flux       PL     N/A      N/A      N/A      N/A      N/A      N/A     ph/cm2/s
Image
15.0-350.0 keV image (Event data)
#RAcent DECcent POSerr Theta  Phi  Peak_Cts  SNR Name
162.626 -4.256 0.024 35.454 131.640 0.257 8.151 TRIG_00308549

Image time interval: 0.704 to 3.401 [sec]
Light Curves
Note: The mask-weighted lightcurves have units of either count/det or counts/sec/det, where a det is 0.4 x 0.4 = 0.16 sq cm.
Best duration plot
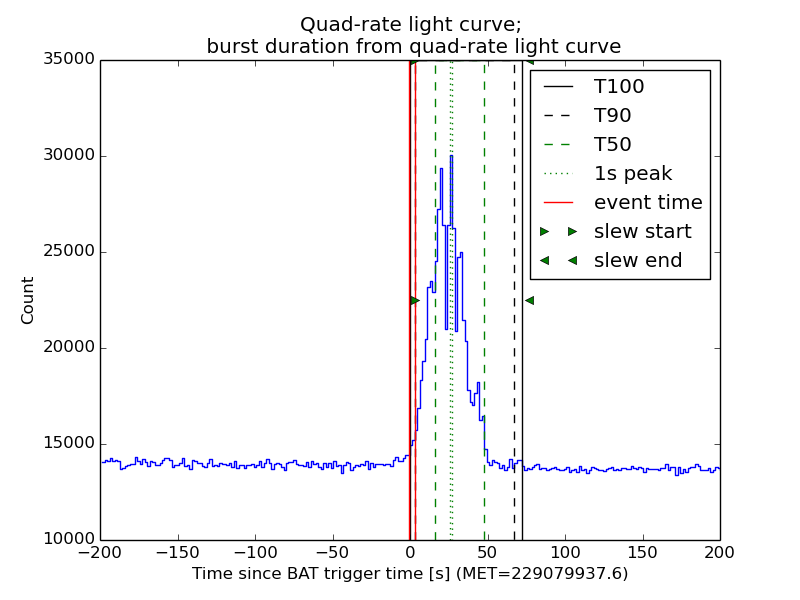
Full-time range; 1 s binning
Other quick-look light curves:
- 64 ms binning (zoomed)
- 16 ms binning (zoomed)
- 8 ms binning (zoomed)
- 2 ms binning (zoomed)
- SN=5 or 10 s binning (full-time range)
- Raw light curve
Spectra
- 64 ms binning (zoomed)
- 16 ms binning (zoomed)
- 8 ms binning (zoomed)
- 2 ms binning (zoomed)
- SN=5 or 10 s binning (full-time range)
- Raw light curve
Spectra
Notes:
- 1) The fitting includes the systematic errors.
- 2) When the burst includes telescope slew time periods, the fitting uses an average response file made from multiple 5-s response files through out the slew time plus single time preiod for the non-slew times, and weighted by the total counts in the corresponding time period using addrmf. An average response file is needed becuase a spectral fit using the pre-slew DRM will introduce some errors in both a spectral shape and a normalization if the PHA file contains a lot of the slew/post-slew time interval.
- 3) For fits to more complicated models (e.g. a power-law over a cutoff power-law), the BAT team has decided to require a chi-square improvement of more than 6 for each extra dof.
Time averaged spectrum fit using the average DRM
Power-law model
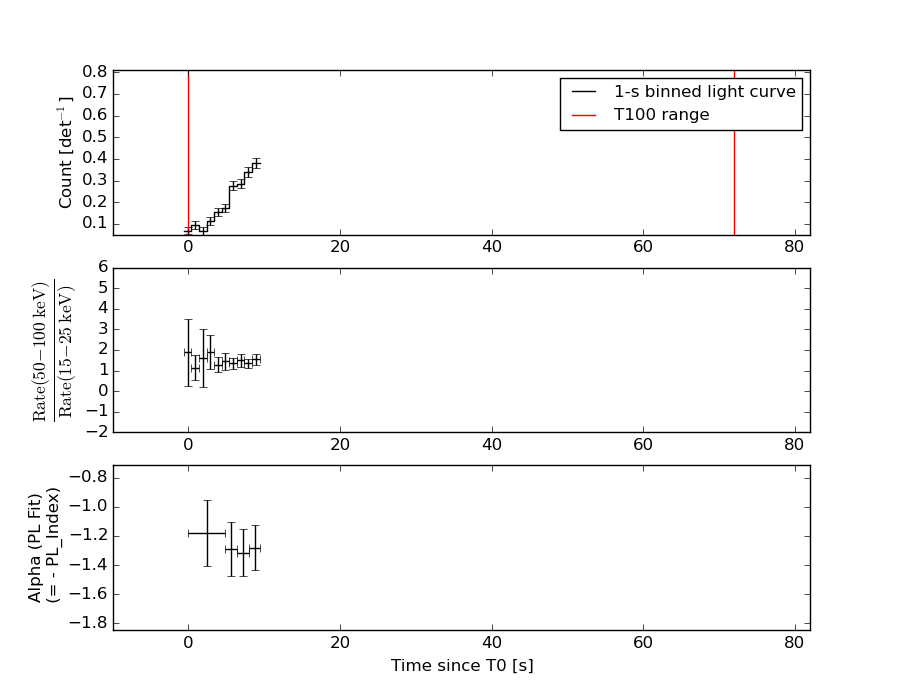
Time interval is from    0.000 sec. to    9.471 sec.

Spectral model in power-law:
------------------------------------------------------------
Parameters  : value       lower 90%   higher 90%
Photon index: -1.25357     ( -0.0970393   0.0976234 )
Norm@50keV  : 1.42985E-02    ( -0.000748022   0.000747993 )
------------------------------------------------------------
#Fit statistic : Chi-Squared =          56.05 using 59 PHA bins.
# Reduced chi-squared =         0.9833 for     57 degrees of freedom
# Null hypothesis probability =   5.107855e-01

Photon flux (15-150 keV)    in 9.471 sec: 1.69212 ( -0.09297  0.09324 ) ph/cm2/s
Energy fluence (15-150 keV)             : 1.35418e-06 ( -7.79617e-08  7.82885e-08 ) ergs/cm2
Cutoff power-law model

Time interval is from    0.000 sec. to    9.471 sec.
Spectral model in the cutoff power-law:
------------------------------------------------------------
Parameters  : value       lower 90%   higher 90%
Photon index: -1.25062     ( -0.0966737   0.298088 )
Epeak [keV] : 9999.15      ( -9999.28 -9999.28 )
Norm@50keV  : 1.43622E-02    ( -0.000751167   0.000751223 )
------------------------------------------------------------
#Fit statistic : Chi-Squared =          56.06 using 59 PHA bins.
# Reduced chi-squared =          1.001 for     56 degrees of freedom
# Null hypothesis probability =   4.724837e-01

Photon flux (15-150 keV)    in 9.471 sec: 1.69885 (    ) ph/cm2/s
Energy fluence (15-150 keV)             : 1.35924e-06 ( -1.07235e-07  7.39238e-08 ) ergs/cm2
1-s peak spectrum fit
1-s peak spectrum unavailable, likely because there are no event data in the 1-s peak range.
Time-resolved spectra
Distribution
T90 vs. Hardness ratio plot
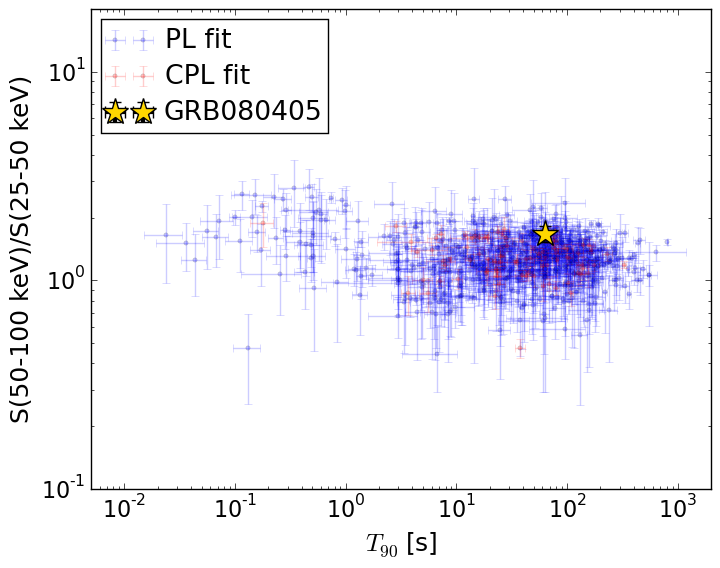
T90                                   = 64.0 sec.
Hardness ratio (energy fluence ratio) = 1.67764470208
S(15-50 keV) vs. S(50-150 keV) plot
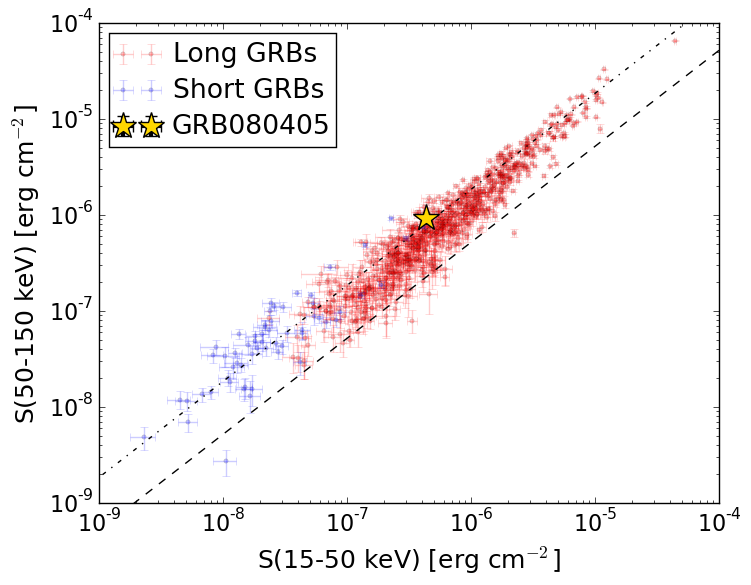
S(15-50 keV)  = 4.308557e-07
S(50-150 keV) = 9.23311e-07
The dash-dotted line and the dashed line traces the fluences calculated from the Band function with Epeak = 15 and 150 keV, respectively. Both lines assume a canonical values of alpha = -1 and beta = -2.5.
Mask shadow pattern
IMX = -0.473146683906, IMY = -0.532169833476
Spacecraft aspect plot
Bright source in the event data image
Event data image of 15-350 keV band
Time interval of the image:
0.704000 3.400640

# RAcent  DECcent POSerr Theta    Phi  PeakCts   SNR AngSep     Name
#  [deg]    [deg]    ['] [deg]  [deg]                   [']
198.6956   0.9725    1.9  40.7   71.3   0.3899   6.1 ------	UNKNOWN
162.6256  -4.2562    1.4  35.5  131.6   0.2573   8.2 ------	UNKNOWN
Webpage updated on:
Mon Jun 22 18:05:21 EDT 2015