Analysis Summary
Notes:
- 1) No attempt has been made to eliminate the non-significant decimal places.
- 2) This batgrbproduct analysis is done using the HEASARC data.
- 3) This batgrbproduct analysis is using the flight position for the mask-weighting calculation.
======================================================================
                  BAT GRB EVENT DATA PROCESSING REPORT
    Process Script Ver: batgrbproduct v2.46
    Process Start Time: Mon Jan 20 03:03:15 EST 2014
             Host Name: batevent1
   Current Working Dir: /local/data/batevent/batevent_reproc/trigger308812
======================================================================

  Trigger: 00308812      Segment: 000

  BAT Trigger Time: 229396980.288   [s; MET]
      Trigger Stop: 229396980.8   [s; MET]
               UTC: 2008-04-09T01:22:57.584260    [includes UTCF correction]
       Where From?: TDRSS position message

  BAT
    RA: 84.3330381966349   Dec: 5.08532726901622  [deg; J2000]

     Catalogged Source?: NO
     Point Source?:      YES
     GRB Indicated?:     YES    [ by BAT flight software ]
     Image S/N Ratio:    14.13
     Image Trigger?:     NO
     Rate S/N Ratio:     19.8494332412792  [ if not an image trigger ]
     Image S/N Ratio:    14.13

  Analysis Position:   [ source = BAT ]
    RA: 84.3330381966349   Dec: 5.08532726901622  [deg; J2000]

  Refined Position:   [ source = BAT pre-slew burst ]
    RA: 84.3026982829364   Dec: 5.07703010304101  [deg; J2000]
        { 05h 37m 12.6s , +05d 04' 37.3" }
         +/- 1.66763342005151 [arcmin] (estimated 90% radius based on SNR)
         +/- 0.650944039324461 [arcmin] (formal 1-sigma fit error)
    SNR: 14.6498042893627

  Angular difference between the analysis and refined position is 1.880340 arcmin

  Partial Coding Fraction: 0.4609375    [ including projection effects ]

  Duration
     T90: 22.6560000181198 +/- 7.53424395861518
        Measured from: -12.7639999985695
                   to: 9.89200001955032     [s; relative to TRIGTIME]
     T50: 2.88400000333786 +/- 5.70394108221307
        Measured from: 0.200000017881393
                   to: 3.08400002121925     [s; relative to TRIGTIME]


  Fluence
     Peak Flux  (peak 1 second)
        Measured from: 0
                   to: 1     [s; relative to TRIGTIME]
     Total Fluence
        Measured from: -13.0999999940395
                   to: 10.4120000004768     [s; relative to TRIGTIME]

             Band 1     Band 2     Band 3     Band 4
              15-25      25-50     50-100    100-350     keV
 Total     0.387665   0.450530   0.222860  -0.015097
           0.037433   0.039123   0.033646   0.029371 [error]
 Peak      0.094767   0.168262   0.131085   0.022228
           0.009536   0.010452   0.008980   0.006704 [error]

     [ fluence units of on-axis counts / fully illuminated detector ]

======================================================================


====== Table of the duration information =============================

        Value   tstart    tstop
T100   23.512  -13.100   10.412
T90    22.656  -12.764    9.892
T50     2.884    0.200    3.084
Peak    1.000    0.000    1.000


====== Spectral Analysis Summary =====================================

Model      : spectral model: simple power-law (PL) and cutoff power-law (CPL)
Ph_index   : photon index: E^{Ph_index}
Ph_90err   : 90% error of the photon index
Epeak      : Epeak in keV
Epeak_90err: 90% error of Epeak
Norm       : normalization at 50 keV in both the PL model and CPL model
Nomr_90err : 90% error of the normalization
chi2       : Chi-Squared
dof        : degree of freedo

=== Time-averaged spectral analysis ===
(Best model with acceptable fit: PL)

Model Ph_index Ph_90err_low Ph_90err_hi  Epeak  Epeak_90err_low  Epeak_90err_hi  Norm       Nomr_90err_low    Norm_90err_hi    chi2    dof
PL      -2.037    -0.190      0.180       -           -               -         2.87e-03     -3.70e-04          3.63e-04      60.120   57
CPL     -0.691    -0.900      1.120       40.335      -9.088         9.597      1.72e-02     -1.72e-02          5.98e-02      53.010   56


=== 1-s peak spectral analysis ===
(Best model with acceptable fit: CPL)

Model Ph_index Ph_90err_low Ph_90err_hi  Epeak  Epeak_90err_low  Epeak_90err_hi  Norm       Nomr_90err_low    Norm_90err_hi    chi2    dof
PL      -1.523     -0.112     0.112       -           -               -         2.94e-02     -2.11e-03          2.10e-03      75.610   57
CPL     -0.548     -0.492     0.550       75.186     -11.919        27.182      9.13e-02     -3.90e-02          7.87e-02      63.030   56


=== Fluence/Peak Flux Summary ===

              Model    Band1     Band2     Band3     Band4     Band5     Total
                       15-25     25-50    50-100    100-350    15-150    15-350    keV
Fluence         PL   1.43e-07  1.90e-07  1.85e-07  3.22e-07  6.24e-07  8.40e-07   erg/cm2
      90%_error_low -2.01e-08 -1.96e-08 -3.17e-08 -9.65e-08 -7.45e-08 -1.37e-07   erg/cm2
      90%_error_hi   2.06e-08  1.96e-08  3.23e-08  1.20e-07  7.57e-08  1.54e-07   erg/cm2
Peak flux       PL   1.24e+00  1.23e+00  8.55e-01  9.40e-01  3.70e+00  4.26e+00   ph/cm2/s
      90%_error_low -1.45e-01 -9.43e-02 -7.32e-02 -1.50e-01 -2.70e-01 -3.02e-01   ph/cm2/s
      90%_error_hi   1.49e-01  9.38e-02  7.28e-02  1.65e-01  2.71e-01  3.02e-01   ph/cm2/s

Fluence        CPL   1.27e-07  2.21e-07  1.73e-07  5.19e-08  5.61e-07  5.73e-07   erg/cm2
      90%_error_low -2.36e-08 -2.80e-08 -4.13e-08 -3.67e-08 -7.58e-08 -8.46e-08   erg/cm2
      90%_error_hi   2.36e-08  2.89e-08  3.92e-08  1.07e-07  8.20e-08  1.28e-07   erg/cm2
Peak flux      CPL   1.04e+00  1.35e+00  9.35e-01  3.85e-01  3.59e+00  3.71e+00   ph/cm2/s
      90%_error_low -1.70e-01 -1.15e-01 -8.73e-02 -1.35e-01 -2.76e-01 -3.10e-01   ph/cm2/s
      90%_error_hi   1.75e-01  1.18e-01  8.87e-02  2.04e-01  2.76e-01  3.28e-01   ph/cm2/s

======================================================================
Image
Pre-slew 15.0-350.0 keV image (Event data)

#   RAcent    DECcent   POSerr    Theta     Phi              Peak Cts       SNR   Name
   84.3027     5.0770   0.0130    39.9299  -146.2523         1.1534768     14.650 TRIG_00308812

Foreground time interval of the image:
-13.100  10.412 (delta_t =  23.512 [sec])
Background time interval of the image:
-239.288 -13.100 (delta_t = 226.188 [sec])
Light Curves
Note: The mask-weighted lightcurves have units of either count/det or counts/sec/det, where a det is 0.4 x 0.4 = 0.16 sq cm.
Full-time range; 1 s binning
Other quick-look light curves:
- 64 ms binning (zoomed)
- 16 ms binning (zoomed)
- 8 ms binning (zoomed)
- 2 ms binning (zoomed)
- SN=5 or 10 s binning (full-time range)
- Raw light curve
Spectra
- 64 ms binning (zoomed)
- 16 ms binning (zoomed)
- 8 ms binning (zoomed)
- 2 ms binning (zoomed)
- SN=5 or 10 s binning (full-time range)
- Raw light curve
Spectra
Notes:
- 1) The fitting includes the systematic errors.
- 2) When the burst includes telescope slew time periods, the fitting uses an average response file made from multiple 5-s response files through out the slew time plus single time preiod for the non-slew times, and weighted by the total counts in the corresponding time period using addrmf. An average response file is needed becuase a spectral fit using the pre-slew DRM will introduce some errors in both a spectral shape and a normalization if the PHA file contains a lot of the slew/post-slew time interval.
- 3) For fits to more complicated models (e.g. a power-law over a cutoff power-law), the BAT team has decided to require a chi-square improvement of more than 6 for each extra dof.
Time averaged spectrum fit using the average DRM
Power-law model
Time interval is from  -13.100 sec. to   10.412 sec.

Spectral model in power-law:
------------------------------------------------------------
Parameters  : value       lower 90%   higher 90%
Photon index: -2.03736     ( -0.190457   0.179952 )
Norm@50keV  : 2.86912E-03    ( -0.00037006   0.000363061 )
------------------------------------------------------------
#Fit statistic : Chi-Squared =          60.12 using 59 PHA bins.
# Reduced chi-squared =          1.055 for     57 degrees of freedom
# Null hypothesis probability =   3.634997e-01

Photon flux (15-150 keV)    in 23.51 sec: 0.437964 ( -0.045135  0.045154 ) ph/cm2/s
Energy fluence (15-150 keV)             : 6.23582e-07 ( -7.44928e-08  7.5717e-08 ) ergs/cm2
Cutoff power-law model
Time interval is from  -13.100 sec. to   10.412 sec.
Spectral model in the cutoff power-law:
------------------------------------------------------------
Parameters  : value       lower 90%   higher 90%
Photon index: -0.691085     ( -0.89967   1.11993 )
Epeak [keV] : 40.3347      ( -9.08852 9.5967 )
Norm@50keV  : 1.71537E-02    ( -0.0171537   0.0597595 )
------------------------------------------------------------
#Fit statistic : Chi-Squared =          53.01 using 59 PHA bins.
# Reduced chi-squared =         0.9466 for     56 degrees of freedom
# Null hypothesis probability =   5.886812e-01

Photon flux (15-150 keV)    in 23.51 sec: 0.419472 ( -0.046442  0.046634 ) ph/cm2/s
Energy fluence (15-150 keV)             : 5.61466e-07 ( -7.57607e-08  8.20254e-08 ) ergs/cm2
1-s peak spectrum fit
Power-law model
Time interval is from    0.000 sec. to    1.000 sec.

Spectral model in power-law:
------------------------------------------------------------
Parameters  : value       lower 90%   higher 90%
Photon index: -1.52335     ( -0.112419   0.111949 )
Norm@50keV  : 2.94100E-02    ( -0.00210621   0.00210298 )
------------------------------------------------------------
#Fit statistic : Chi-Squared =          75.61 using 59 PHA bins.
# Reduced chi-squared =          1.326 for     57 degrees of freedom
# Null hypothesis probability =   5.012357e-02

Photon flux (15-150 keV)    in 1 sec: 3.69516 ( -0.27042  0.27084 ) ph/cm2/s
Energy fluence (15-150 keV)             : 2.78003e-07 ( -2.11409e-08  2.12304e-08 ) ergs/cm2
Cutoff power-law model
Time interval is from    0.000 sec. to    1.000 sec.
Spectral model in the cutoff power-law:
------------------------------------------------------------
Parameters  : value       lower 90%   higher 90%
Photon index: -0.547763     ( -0.49217   0.550341 )
Epeak [keV] : 75.1860      ( -11.9185 27.1816 )
Norm@50keV  : 9.13342E-02    ( -0.0390098   0.0787053 )
------------------------------------------------------------
#Fit statistic : Chi-Squared =          63.03 using 59 PHA bins.
# Reduced chi-squared =          1.126 for     56 degrees of freedom
# Null hypothesis probability =   2.416626e-01

Photon flux (15-150 keV)    in 1 sec: 3.58876 ( -0.27575  0.27609 ) ph/cm2/s
Energy fluence (15-150 keV)             : 2.64746e-07 ( -2.23084e-08  2.24246e-08 ) ergs/cm2
Time-resolved spectra
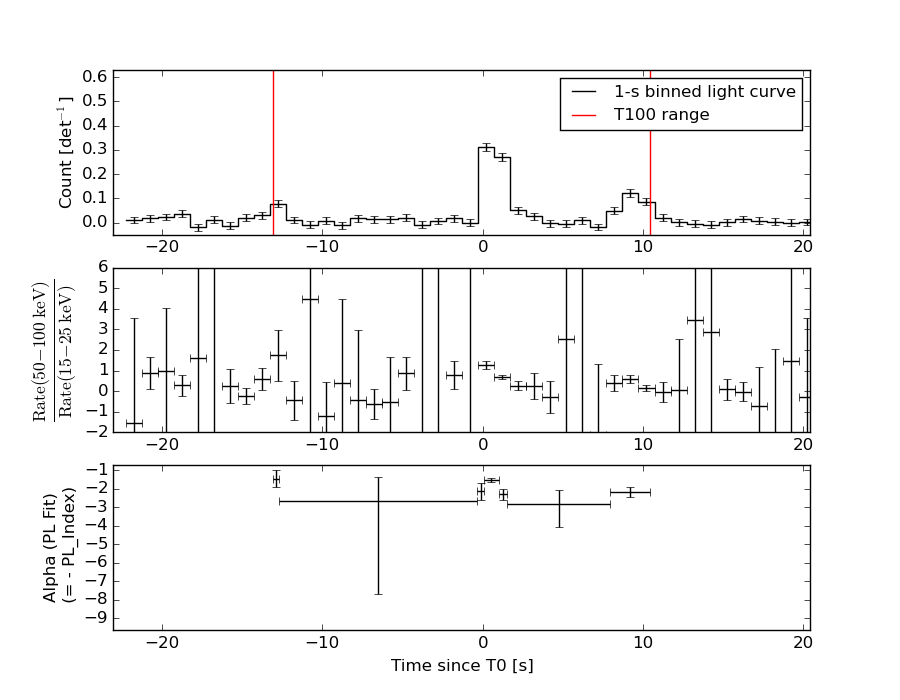
Distribution
T90 vs. Hardness ratio plot
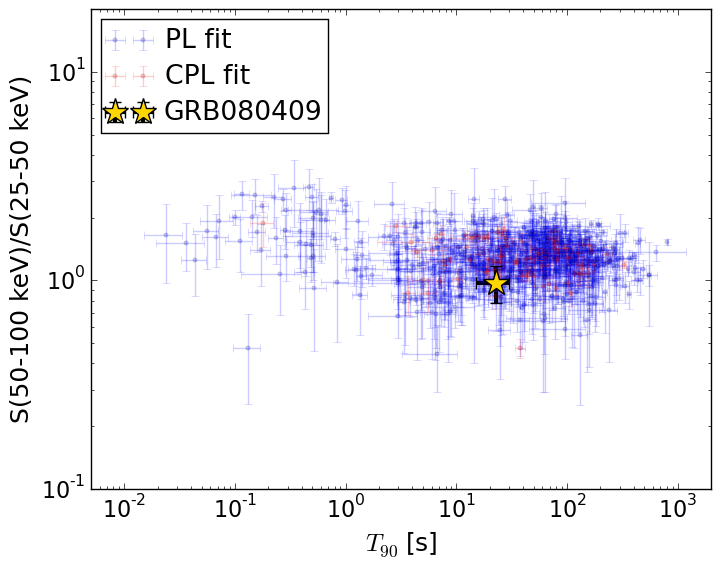
T90                                   = 22.656 sec.
Hardness ratio (energy fluence ratio) = 0.974518324869
S(15-50 keV) vs. S(50-150 keV) plot
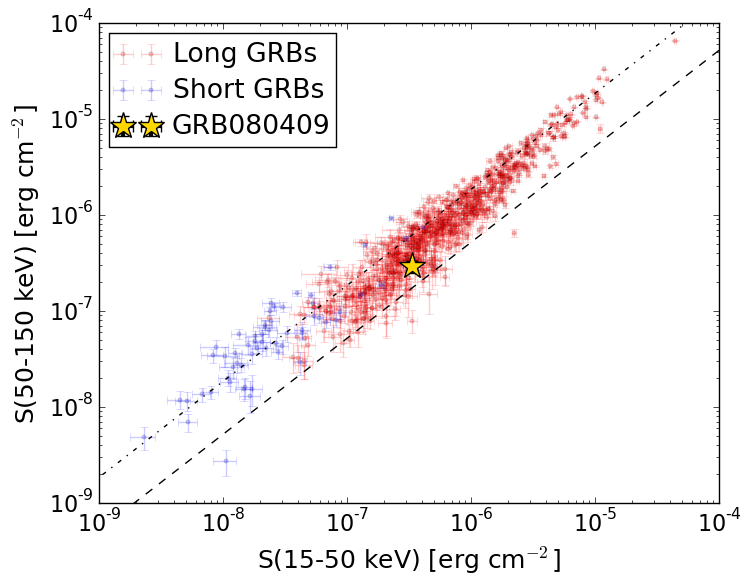
S(15-50 keV)  = 3.327406e-07
S(50-150 keV) = 2.908516e-07
The dash-dotted line and the dashed line traces the fluences calculated from the Band function with Epeak = 15 and 150 keV, respectively. Both lines assume a canonical values of alpha = -1 and beta = -2.5.
Mask shadow pattern
IMX = -6.959719045074152E-01, IMY = 4.649925097246069E-01
Spacecraft aspect plot
Bright source in the pre-burst/pre-slew/post-slew images
Pre-burst image of 15-350 keV band
Time interval of the image:
-239.288000 -13.100000

# RAcent  DECcent POSerr Theta    Phi  PeakCts   SNR AngSep     Name
#  [deg]    [deg]    ['] [deg]  [deg]                   [']
 83.6232  22.0216    0.3  29.6 -122.3   9.4786  41.6    0.7	Crab
140.2736   5.5685    3.4  36.5  115.8   1.4543   3.4 ------	UNKNOWN
135.6889  28.4668    2.5  18.6   81.5   0.9050   4.5 ------	UNKNOWN
159.2576  58.8950    2.2  39.0   17.3   1.3655   5.2 ------	UNKNOWN
193.9568  70.9371    2.7  55.3    5.1   3.6499   4.3 ------	UNKNOWN
116.2015  17.9791    2.5  15.4  156.6   0.7482   4.7 ------	UNKNOWN
119.6984  44.0498    2.3  11.4    0.6   0.7981   5.0 ------	UNKNOWN
103.4813  18.8620    2.1  17.6 -160.5   0.7878   5.5 ------	UNKNOWN
 94.7205 -14.6681    2.9  51.6 -173.0   1.6316   4.0 ------	UNKNOWN
115.9866  69.4412    2.4  36.1  -17.1   1.0402   4.8 ------	UNKNOWN
Pre-slew background subtracted image of 15-350 keV band
Time interval of the image:
-13.100000 10.412000

# RAcent  DECcent POSerr Theta    Phi  PeakCts   SNR AngSep     Name
#  [deg]    [deg]    ['] [deg]  [deg]                   [']
 83.4769  22.0474    7.7  29.7 -122.2  -0.0984  -1.5    8.9	Crab
124.7276 -11.7761    2.6  46.1  148.3   0.5397   4.4 ------	UNKNOWN
 84.3027   5.0770    0.8  39.9 -146.3   1.1536  14.7 ------	UNKNOWN
Post-slew image of 15-350 keV band
Time interval of the image:
68.012600 962.769100

# RAcent  DECcent POSerr Theta    Phi  PeakCts   SNR AngSep     Name
#  [deg]    [deg]    ['] [deg]  [deg]                   [']
 83.6349  22.0173    0.2  16.9   -8.2  38.4853  74.0    0.2	Crab
 93.2660 -47.4911    3.0  53.2  166.6   9.7513   3.9 ------	UNKNOWN
 97.1681  14.5979    2.2  15.8   46.2   3.0820   5.4 ------	UNKNOWN
 64.6670  -8.2541    2.7  23.7 -130.0   2.7135   4.3 ------	UNKNOWN
 62.1945  29.7833    2.2  32.4  -43.6   3.8434   5.3 ------	UNKNOWN
 44.4833  41.1056    3.9  50.6  -44.6   9.7128   3.0 ------	UNKNOWN