Analysis Summary
Notes:
- 1) No attempt has been made to eliminate the non-significant decimal places.
- 2) This batgrbproduct analysis is done using the HEASARC data.
- 3) This batgrbproduct analysis is using the flight position for the mask-weighting calculation.
======================================================================
                  BAT GRB EVENT DATA PROCESSING REPORT
    Process Script Ver: batgrbproduct v2.46
    Process Start Time: Mon Jan 20 02:46:00 EST 2014
             Host Name: batevent1
   Current Working Dir: /local/data/batevent/batevent_reproc/trigger309096
======================================================================

  Trigger: 00309096      Segment: 000

  BAT Trigger Time: 229748062.016   [s; MET]
      Trigger Stop: 229748062.528   [s; MET]
               UTC: 2008-04-13T02:54:19.302440    [includes UTCF correction]
       Where From?: TDRSS position message

  BAT
    RA: 287.289929388104   Dec: -27.679225960068  [deg; J2000]

     Catalogged Source?: NO
     Point Source?:      YES
     GRB Indicated?:     YES    [ by BAT flight software ]
     Image S/N Ratio:    9.06
     Image Trigger?:     NO
     Rate S/N Ratio:     15.6524758424985  [ if not an image trigger ]
     Image S/N Ratio:    9.06

  Analysis Position:   [ source = BAT ]
    RA: 287.289929388104   Dec: -27.679225960068  [deg; J2000]

  Refined Position:   [ source = BAT pre-slew burst ]
    RA: 287.299178959777   Dec: -27.67775699745  [deg; J2000]
        { 19h 09m 11.8s , -27d 40' 39.9" }
         +/- 0.64947967629121 [arcmin] (estimated 90% radius based on SNR)
         +/- 0.170347385175325 [arcmin] (formal 1-sigma fit error)
    SNR: 56.3484348898179

  Angular difference between the analysis and refined position is 0.499308 arcmin

  Partial Coding Fraction: 0.8125    [ including projection effects ]

  Duration
     T90: 46.3600000143051 +/- 0.481215117373871
        Measured from: 1.11599999666214
                   to: 47.4760000109673     [s; relative to TRIGTIME]
     T50: 15.4759999811649 +/- 0.798979370890493
        Measured from: 2.84400001168251
                   to: 18.3199999928474     [s; relative to TRIGTIME]


  Fluence
     Peak Flux  (peak 1 second)
        Measured from: 1.64399999380112
                   to: 2.64399999380112     [s; relative to TRIGTIME]
     Total Fluence
        Measured from: -0.0800000131130219
                   to: 50.33599999547     [s; relative to TRIGTIME]

             Band 1     Band 2     Band 3     Band 4
              15-25      25-50     50-100    100-350     keV
 Total     1.538148   2.201969   1.573177   0.387463
           0.046508   0.044330   0.039610   0.037403 [error]
 Peak      0.134871   0.251607   0.242727   0.069710
           0.008356   0.009030   0.008725   0.006521 [error]

     [ fluence units of on-axis counts / fully illuminated detector ]

======================================================================


====== Table of the duration information =============================

        Value   tstart    tstop
T100   50.416   -0.080   50.336
T90    46.360    1.116   47.476
T50    15.476    2.844   18.320
Peak    1.000    1.644    2.644


====== Spectral Analysis Summary =====================================

Model      : spectral model: simple power-law (PL) and cutoff power-law (CPL)
Ph_index   : photon index: E^{Ph_index}
Ph_90err   : 90% error of the photon index
Epeak      : Epeak in keV
Epeak_90err: 90% error of Epeak
Norm       : normalization at 50 keV in both the PL model and CPL model
Nomr_90err : 90% error of the normalization
chi2       : Chi-Squared
dof        : degree of freedo

=== Time-averaged spectral analysis ===
(Best model with acceptable fit: N/A)

Model Ph_index Ph_90err_low Ph_90err_hi  Epeak  Epeak_90err_low  Epeak_90err_hi  Norm       Nomr_90err_low    Norm_90err_hi    chi2    dof
PL      -1.530    -0.052      0.052       -           -               -         7.40e-03     -1.96e-04          1.96e-04      75.380   57
CPL     -1.426    -0.150      0.211      291.092    -291.092      -291.092      8.28e-03     -1.03e-03          2.08e-03      74.630   56


=== 1-s peak spectral analysis ===
(Best model with acceptable fit: PL)

Model Ph_index Ph_90err_low Ph_90err_hi  Epeak  Epeak_90err_low  Epeak_90err_hi  Norm       Nomr_90err_low    Norm_90err_hi    chi2    dof
PL      -1.130     -0.069     0.070       -           -               -         4.74e-02     -1.87e-03          1.87e-03      52.670   57
CPL     -0.744     -0.274     0.292      182.090     -54.917       276.598      7.11e-02     -1.73e-02          2.45e-02      46.720   56


=== Fluence/Peak Flux Summary ===

              Model    Band1     Band2     Band3     Band4     Band5     Total
                       15-25     25-50    50-100    100-350    15-150    15-350    keV
Fluence         PL   4.90e-07  8.84e-07  1.22e-06  3.53e-06  3.52e-06  6.13e-06   erg/cm2
      90%_error_low -2.60e-08 -2.67e-08 -4.18e-08 -2.72e-07 -9.97e-08 -2.95e-07   erg/cm2
      90%_error_hi   2.65e-08  2.66e-08  4.17e-08  2.88e-07  1.00e-07  3.08e-07   erg/cm2
Peak flux       PL   1.37e+00  1.72e+00  1.57e+00  2.50e+00  5.52e+00  7.17e+00   ph/cm2/s
      90%_error_low -1.08e-01 -8.30e-02 -6.97e-02 -2.32e-01 -2.25e-01 -3.00e-01   ph/cm2/s
      90%_error_hi   1.11e-01  8.25e-02  6.94e-02  2.47e-01  2.25e-01  3.03e-01   ph/cm2/s

Fluence        CPL   4.78e-07  8.90e-07  1.23e-06  3.02e-06  3.49e-06  5.62e-06   erg/cm2
      90%_error_low -3.35e-08 -2.89e-08 -4.43e-08 -7.71e-07 -1.18e-07 -7.79e-07   erg/cm2
      90%_error_hi   3.19e-08  2.91e-08  4.46e-08  5.77e-07  1.17e-07  6.16e-07   erg/cm2
Peak flux      CPL   1.24e+00  1.76e+00  1.64e+00  1.70e+00  5.42e+00  6.34e+00   ph/cm2/s
      90%_error_low -1.35e-01 -8.94e-02 -8.42e-02 -3.90e-01 -2.35e-01 -4.64e-01   ph/cm2/s
      90%_error_hi   1.39e-01  9.00e-02  8.51e-02  5.35e-01  2.35e-01  5.79e-01   ph/cm2/s

======================================================================
Image
Pre-slew 15.0-350.0 keV image (Event data)
#   RAcent    DECcent   POSerr    Theta     Phi              Peak Cts       SNR   Name
  287.2992   -27.6778   0.0034    16.7003   -90.6024         2.8883762     56.348 TRIG_00309096

Foreground time interval of the image:
 -0.080  10.685 (delta_t =  10.765 [sec])
Background time interval of the image:
-239.016  -0.080 (delta_t = 238.936 [sec])
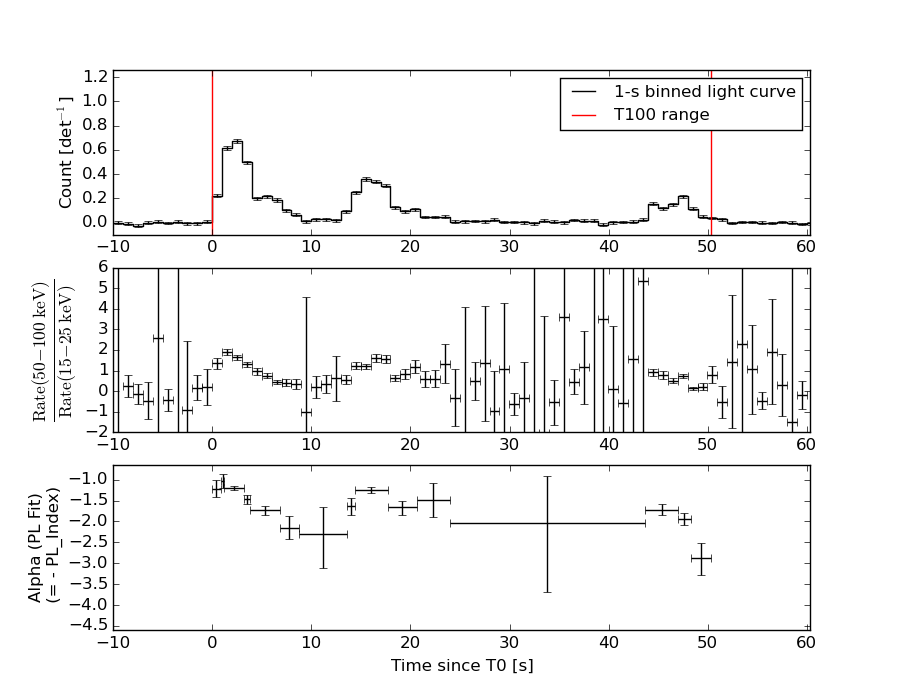
Light Curves
Note: The mask-weighted lightcurves have units of either count/det or counts/sec/det, where a det is 0.4 x 0.4 = 0.16 sq cm.
Full-time range; 1 s binning
Other quick-look light curves:
- 64 ms binning (zoomed)
- 16 ms binning (zoomed)
- 8 ms binning (zoomed)
- 2 ms binning (zoomed)
- SN=5 or 10 s binning (full-time range)
- Raw light curve
Spectra
- 64 ms binning (zoomed)
- 16 ms binning (zoomed)
- 8 ms binning (zoomed)
- 2 ms binning (zoomed)
- SN=5 or 10 s binning (full-time range)
- Raw light curve
Spectra
Notes:
- 1) The fitting includes the systematic errors.
- 2) When the burst includes telescope slew time periods, the fitting uses an average response file made from multiple 5-s response files through out the slew time plus single time preiod for the non-slew times, and weighted by the total counts in the corresponding time period using addrmf. An average response file is needed becuase a spectral fit using the pre-slew DRM will introduce some errors in both a spectral shape and a normalization if the PHA file contains a lot of the slew/post-slew time interval.
- 3) For fits to more complicated models (e.g. a power-law over a cutoff power-law), the BAT team has decided to require a chi-square improvement of more than 6 for each extra dof.
Time averaged spectrum fit using the average DRM
Power-law model
Time interval is from   -0.080 sec. to   50.336 sec.

Spectral model in power-law:
------------------------------------------------------------
Parameters  : value       lower 90%   higher 90%
Photon index: -1.52958     ( -0.0523954   0.0523745 )
Norm@50keV  : 7.39868E-03    ( -0.000196032   0.000195954 )
------------------------------------------------------------
#Fit statistic : Chi-Squared =          75.38 using 59 PHA bins.
# Reduced chi-squared =          1.322 for     57 degrees of freedom
# Null hypothesis probability =   5.198109e-02

Photon flux (15-150 keV)    in 50.42 sec: 0.931214 ( -0.027027  0.027115 ) ph/cm2/s
Energy fluence (15-150 keV)             : 3.52284e-06 ( -9.97146e-08  1.0003e-07 ) ergs/cm2
Cutoff power-law model

Time interval is from   -0.080 sec. to   50.336 sec.
Spectral model in the cutoff power-law:
------------------------------------------------------------
Parameters  : value       lower 90%   higher 90%
Photon index: -1.42563     ( -0.149594   0.211438 )
Epeak [keV] : 291.092      ( -291.23 -291.23 )
Norm@50keV  : 8.28496E-03    ( -0.00103163   0.00208143 )
------------------------------------------------------------
#Fit statistic : Chi-Squared =          74.63 using 59 PHA bins.
# Reduced chi-squared =          1.333 for     56 degrees of freedom
# Null hypothesis probability =   4.873905e-02

Photon flux (15-150 keV)    in 50.42 sec: 0.923466 ( -0.030733  0.029927 ) ph/cm2/s
Energy fluence (15-150 keV)             : 3.49046e-06 ( -1.18031e-07  1.17342e-07 ) ergs/cm2
1-s peak spectrum fit
Power-law model
Time interval is from    1.644 sec. to    2.644 sec.

Spectral model in power-law:
------------------------------------------------------------
Parameters  : value       lower 90%   higher 90%
Photon index: -1.13034     ( -0.0694003   0.0698127 )
Norm@50keV  : 4.74207E-02    ( -0.00186898   0.00186845 )
------------------------------------------------------------
#Fit statistic : Chi-Squared =          52.67 using 59 PHA bins.
# Reduced chi-squared =         0.9241 for     57 degrees of freedom
# Null hypothesis probability =   6.380408e-01

Photon flux (15-150 keV)    in 1 sec: 5.51779 ( -0.22484  0.22511 ) ph/cm2/s
Energy fluence (15-150 keV)             : 4.91157e-07 ( -2.12088e-08  2.12558e-08 ) ergs/cm2
Cutoff power-law model
Time interval is from    1.644 sec. to    2.644 sec.
Spectral model in the cutoff power-law:
------------------------------------------------------------
Parameters  : value       lower 90%   higher 90%
Photon index: -0.743651     ( -0.274113   0.292455 )
Epeak [keV] : 182.090      ( -54.9172 276.598 )
Norm@50keV  : 7.10963E-02    ( -0.0173063   0.0244968 )
------------------------------------------------------------
#Fit statistic : Chi-Squared =          46.72 using 59 PHA bins.
# Reduced chi-squared =         0.8342 for     56 degrees of freedom
# Null hypothesis probability =   8.070488e-01

Photon flux (15-150 keV)    in 1 sec: 5.41719 ( -0.23525  0.23536 ) ph/cm2/s
Energy fluence (15-150 keV)             : 4.80485e-07 ( -2.28703e-08  2.2749e-08 ) ergs/cm2
Time-resolved spectra
Distribution
T90 vs. Hardness ratio plot
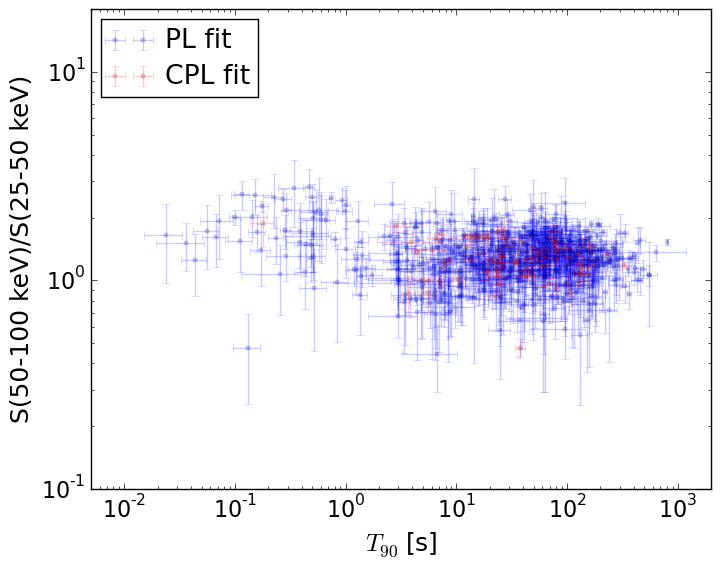
T90                                   = N/A sec.
Hardness ratio (energy fluence ratio) = N/A
S(15-50 keV) vs. S(50-150 keV) plot
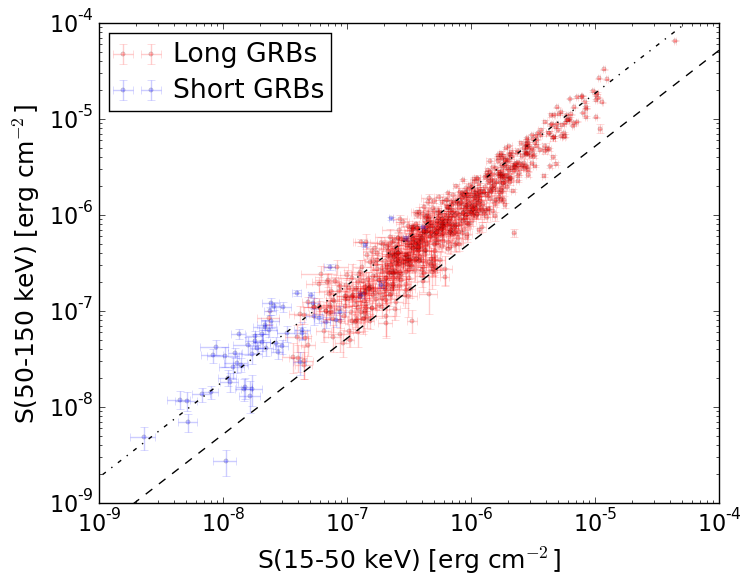
S(15-50 keV)  = N/A
S(50-150 keV) = N/A
The dash-dotted line and the dashed line traces the fluences calculated from the Band function with Epeak = 15 and 150 keV, respectively. Both lines assume a canonical values of alpha = -1 and beta = -2.5.
Mask shadow pattern
IMX = -3.154197460994845E-03, IMY = 3.000031334939362E-01
Spacecraft aspect plot
Bright source in the pre-burst/pre-slew/post-slew images
Pre-burst image of 15-350 keV band
Time interval of the image:
-239.016000 -0.080000

# RAcent  DECcent POSerr Theta    Phi  PeakCts   SNR AngSep     Name
#  [deg]    [deg]    ['] [deg]  [deg]                   [']
244.9793 -15.6510    0.2  24.4  101.7  29.0852  73.8    0.6	Sco X-1
255.9920 -37.8634    0.8  15.7   30.1   3.8463  14.1    1.2	4U 1700-377
256.4768 -36.4483    2.2  14.4   33.2   1.4106   5.1    2.5	GX 349+2
263.0161 -24.8901    8.0   5.2   95.3  -0.4252  -1.4    8.7	GX 1+4
264.8956 -44.6255    0.0  18.5   -1.1   0.4298   1.5   12.4	4U 1735-44
268.4241  -1.4979    4.7  24.8  170.1   0.7234   2.5    4.3	SW J1753.5-0127
270.2547 -25.0364    2.7   2.0 -140.0   1.2664   4.3    3.0	GX 5-1
270.3625 -25.7779   10.6   1.7 -118.3   0.3226   1.1    3.9	GRS 1758-258
274.0066 -13.9546    3.0  13.4 -166.2   1.0893   3.8    4.9	GX 17+2
275.9642 -30.3283    4.7   7.6  -66.1   0.7091   2.5    3.1	H1820-303
284.9650 -25.0426   68.3  14.8 -100.9  -0.0540  -0.2    8.3	HT1900.1-2455
288.8035  10.9399   21.5  42.1 -159.1   0.2858   0.5    0.5	GRS 1915+105
262.8933 -33.7581    6.4   8.9   22.8   0.5218   1.8    6.6	GX 354-0
258.7705 -32.5657    2.4  10.6   42.1   1.3380   4.9 ------	UNKNOWN
266.7974 -27.3312    1.4   1.9   48.2   2.4231   8.2 ------	UNKNOWN
292.2447 -56.4132    2.4  34.5  -32.5   1.7288   4.9 ------	UNKNOWN
312.9417 -19.4465    4.5  41.2  -99.5   4.5716   2.6 ------	UNKNOWN
Pre-slew background subtracted image of 15-350 keV band
Time interval of the image:
-0.080000 10.684600

# RAcent  DECcent POSerr Theta    Phi  PeakCts   SNR AngSep     Name
#  [deg]    [deg]    ['] [deg]  [deg]                   [']
244.9785 -15.6938    2.0  24.4  101.6  -0.3733  -5.9    3.2	Sco X-1
256.1557 -37.9089    4.0  15.6   29.7   0.1333   2.9    8.9	4U 1700-377
256.2850 -36.3083    7.6  14.5   34.0   0.0717   1.5   10.0	GX 349+2
262.8603 -24.6593   23.5   5.4   97.2   0.0218   0.5    9.6	GX 1+4
264.8390 -44.6173    7.3  18.5   -1.0  -0.0730  -1.6   10.8	4U 1735-44
268.3140  -1.2931    7.1  25.0  169.9   0.0858   1.6   10.1	SW J1753.5-0127
270.4292 -25.2129    5.0   2.0 -133.2  -0.1070  -2.3   11.2	GX 5-1
270.2268 -25.8843    4.8   1.5 -116.1  -0.1105  -2.4    9.4	GRS 1758-258
273.9221 -14.1763    9.1  13.1 -166.1  -0.0547  -1.3    9.7	GX 17+2
276.0314 -30.4209  108.9   7.7  -65.7  -0.0047  -0.1    6.4	H1820-303
285.1985 -24.9982    4.0  15.0 -100.9   0.1366   2.9   10.0	HT1900.1-2455
288.9177  11.0478    7.5  42.3 -159.0  -0.1182  -1.5    9.3	GRS 1915+105
262.8282 -33.7504    4.0   8.9   23.1  -0.1249  -2.9    9.5	GX 354-0
261.3894  23.4008    2.1  50.2  161.9   0.8482   5.4 ------	UNKNOWN
287.2992 -27.6778    0.2  16.7  -90.6   2.8883  56.3 ------	UNKNOWN
319.5195 -43.7127    3.3  44.4  -62.8   0.6981   3.5 ------	UNKNOWN
Post-slew image of 15-350 keV band
Time interval of the image:
50.084590 352.184600

# RAcent  DECcent POSerr Theta    Phi  PeakCts   SNR AngSep     Name
#  [deg]    [deg]    ['] [deg]  [deg]                   [']
255.9987 -37.8360    0.6  28.0   67.0   6.2099  18.2    0.8	4U 1700-377
256.5895 -36.5529   32.6  27.3   69.5  -0.1140  -0.4   10.8	GX 349+2
262.8827 -24.7630    6.0  22.0   98.3  -0.5990  -1.9    7.0	GX 1+4
264.7910 -44.6011    8.2  24.7   47.0   0.4060   1.4    9.3	4U 1735-44
268.4091  -1.4416    5.7  31.9  148.5   0.7968   2.0    2.6	SW J1753.5-0127
270.2838 -25.0762    2.2  15.4  102.1   1.3467   5.3    0.2	GX 5-1
270.2300 -25.7009    5.0  15.3   99.8   0.6211   2.4    4.7	GRS 1758-258
274.1075 -14.0762    2.0  18.3  141.6   1.4200   5.6    6.4	GX 17+2
275.8915 -30.3202    3.1  10.3   78.7   0.8808   3.8    3.3	H1820-303
285.0207 -24.8505    4.4   3.5  150.3   0.6019   2.6    4.3	HT1900.1-2455
288.8397  10.9619    9.9  38.7 -171.3   0.4138   1.2    2.6	GRS 1915+105
262.9023 -33.8327    8.9  21.8   73.8   0.3674   1.3    4.3	GX 354-0
257.1472  14.3043    2.6  51.2  147.6   5.9903   4.5 ------	UNKNOWN
266.8168 -27.3714    1.2  18.1   92.5   2.5919   9.6 ------	UNKNOWN
277.3268 -23.7997    2.1   9.8  117.5   1.3313   5.5 ------	UNKNOWN
348.2448 -46.7216    3.7  50.7  -44.5   5.2914   3.1 ------	UNKNOWN
333.1977 -24.1351    3.8  41.2  -77.9   3.8289   3.1 ------	UNKNOWN
320.9516   4.9619    2.8  46.1 -123.7   5.8598   4.1 ------	UNKNOWN