Analysis Summary
Notes:
- 1) No attempt has been made to eliminate the non-significant decimal places.
- 2) This batgrbproduct analysis is done using the HEASARC data.
- 3) This batgrbproduct analysis is using the flight position for the mask-weighting calculation.
======================================================================
                  BAT GRB EVENT DATA PROCESSING REPORT
    Process Script Ver: batgrbproduct v2.46
    Process Start Time: Thu Apr 24 23:19:02 EDT 2014
             Host Name: batevent1
   Current Working Dir: /local/data/batevent/batevent_reproc/trigger309111
======================================================================

  Trigger: 00309111      Segment: 000

  BAT Trigger Time: 229769475.264   [s; MET]
      Trigger Stop: 229769476.288   [s; MET]
               UTC: 2008-04-13T08:51:12.549840    [includes UTCF correction]
       Where From?: TDRSS position message

  BAT
    RA: 326.134366952306   Dec: -19.9693461700508  [deg; J2000]

     Catalogged Source?: NO
     Point Source?:      YES
     GRB Indicated?:     YES    [ by BAT flight software ]
     Image S/N Ratio:    23
     Image Trigger?:     NO
     Rate S/N Ratio:     128.596267441944  [ if not an image trigger ]
     Image S/N Ratio:    23

  Analysis Position:   [ source = BAT ]
    RA: 326.134366952306   Dec: -19.9693461700508  [deg; J2000]

  Refined Position:   [ source = BAT pre-slew burst ]
    RA: 326.137720791794   Dec: -19.9812353957063  [deg; J2000]
        { 21h 44m 33.1s , -19d 58' 52.4" }
         +/- 0.82967867411914 [arcmin] (estimated 90% radius based on SNR)
         +/- 0.274502355152754 [arcmin] (formal 1-sigma fit error)
    SNR: 39.7156194871877

  Angular difference between the analysis and refined position is 0.737998 arcmin

  Partial Coding Fraction: 0.2011719    [ including projection effects ]

  Duration
     T90: 8 +/- 2
        Measured from: -1.26399999856949
                   to: 6.73600000143051     [s; relative to TRIGTIME]
     T50: 2 +/- 1
        Measured from: -0.263999998569489
                   to: 1.73600000143051     [s; relative to TRIGTIME]


  Fluence
     Peak Flux  (peak 1 second)
        Measured from: -0.263999998569489
                   to: 0.736000001430511     [s; relative to TRIGTIME]
     Total Fluence
        Measured from: -1.26399999856949
                   to: 10.7360000014305     [s; relative to TRIGTIME]

             Band 1     Band 2     Band 3     Band 4
              15-25      25-50     50-100    100-350     keV
 Total     1.586212   2.146432   1.482266   0.320190
           0.050333   0.054845   0.047417   0.034494 [error]
 Peak      0.498519   0.843271   0.670540   0.162555
           0.021740   0.027141   0.024799   0.015514 [error]

     [ fluence units of on-axis counts / fully illuminated detector ]

======================================================================


====== Table of the duration information =============================

        Value   tstart    tstop
T100   12.000   -1.264   10.736
T90     8.000   -1.264    6.736
T50     2.000   -0.264    1.736
Peak    1.000   -0.264    0.736


====== Spectral Analysis Summary =====================================

Model      : spectral model: simple power-law (PL) and cutoff power-law (CPL)
Ph_index   : photon index: E^{Ph_index}
Ph_90err   : 90% error of the photon index
Epeak      : Epeak in keV
Epeak_90err: 90% error of Epeak
Norm       : normalization at 50 keV in both the PL model and CPL model
Nomr_90err : 90% error of the normalization
chi2       : Chi-Squared
dof        : degree of freedo

=== Time-averaged spectral analysis ===
(Best model with acceptable fit: PL)

Model Ph_index Ph_90err_low Ph_90err_hi  Epeak  Epeak_90err_low  Epeak_90err_hi  Norm       Nomr_90err_low    Norm_90err_hi    chi2    dof
PL      -1.742    -0.058      0.058       -           -               -         3.03e-02     -9.95e-04          9.93e-04      60.650   57
CPL     -1.230    -0.241      0.255       77.650     -10.814        24.401      5.37e-02     -1.24e-02          1.73e-02      46.760   56


=== 1-s peak spectral analysis ===
(Best model with acceptable fit: CPL)

Model Ph_index Ph_90err_low Ph_90err_hi  Epeak  Epeak_90err_low  Epeak_90err_hi  Norm       Nomr_90err_low    Norm_90err_hi    chi2    dof
PL      -1.454     -0.063     0.063       -           -               -         1.50e-01     -5.63e-03          5.63e-03      56.080   57
CPL     -0.944     -0.262     0.278      111.345     -21.844        59.334      2.63e-01     -6.43e-02          9.15e-02      44.410   56


=== Fluence/Peak Flux Summary ===

              Model    Band1     Band2     Band3     Band4     Band5     Total
                       15-25     25-50    50-100    100-350    15-150    15-350    keV
Fluence         PL   5.83e-07  9.24e-07  1.11e-06  2.57e-06  3.36e-06  5.19e-06   erg/cm2
      90%_error_low -3.31e-08 -3.18e-08 -4.69e-08 -2.29e-07 -1.13e-07 -2.64e-07   erg/cm2
      90%_error_hi   3.38e-08  3.17e-08  4.68e-08  2.42e-07  1.13e-07  2.74e-07   erg/cm2
Peak flux       PL   5.91e+00  6.11e+00  4.46e+00  5.23e+00  1.85e+01  2.17e+01   ph/cm2/s
      90%_error_low -3.97e-01 -2.58e-01 -1.98e-01 -4.59e-01 -7.29e-01 -8.15e-01   ph/cm2/s
      90%_error_hi   4.06e-01  2.57e-01  1.97e-01  4.84e-01  7.30e-01  8.16e-01   ph/cm2/s

Fluence        CPL    N/A      N/A      N/A      N/A      N/A      N/A      erg/cm2
      90%_error_low -3.31e-08 -3.18e-08 -4.69e-08 -2.29e-07 -1.13e-07 -2.64e-07   erg/cm2
      90%_error_hi   3.38e-08  3.17e-08  4.68e-08  2.42e-07  1.13e-07  2.74e-07   erg/cm2
Peak flux      CPL   5.29e+00  6.36e+00  4.72e+00  3.23e+00  1.81e+01  1.96e+01   ph/cm2/s
      90%_error_low -4.88e-01 -2.93e-01 -2.40e-01 -6.80e-01 -7.50e-01 -1.04e+00   ph/cm2/s
      90%_error_hi   4.98e-01  2.97e-01  2.43e-01  8.87e-01  7.52e-01  1.15e+00   ph/cm2/s

======================================================================
Image
Pre-slew 15.0-350.0 keV image (Event data)
#   RAcent    DECcent   POSerr    Theta     Phi              Peak Cts       SNR   Name
  326.1377   -19.9812   0.0049    36.2023   -87.3746         5.8497357     39.716 TRIG_00309111

Foreground time interval of the image:
 -1.264  10.736 (delta_t =  12.000 [sec])
Background time interval of the image:
-239.264  -1.264 (delta_t = 238.000 [sec])
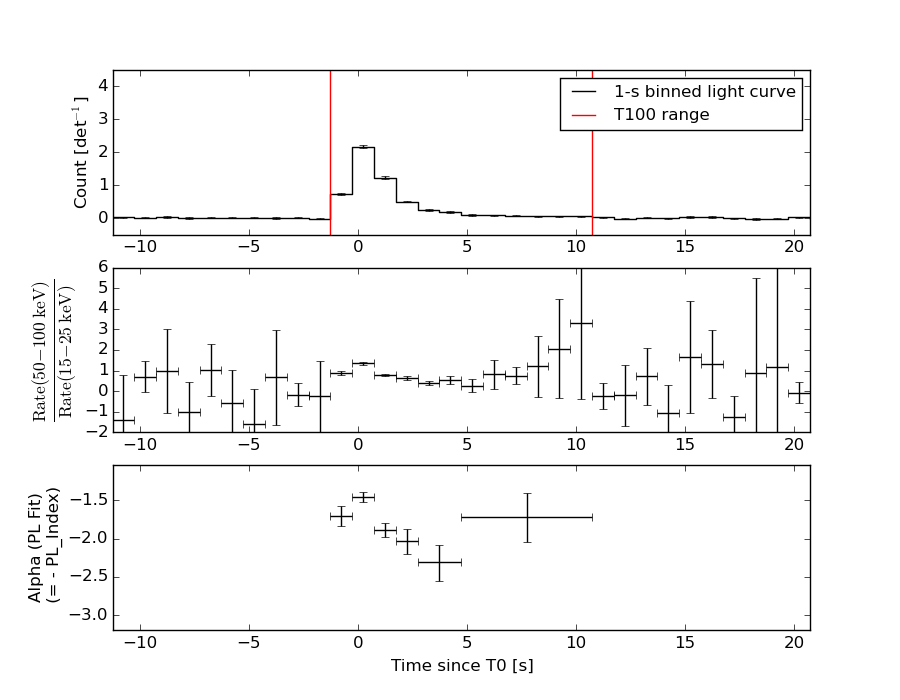
Light Curves
Note: The mask-weighted lightcurves have units of either count/det or counts/sec/det, where a det is 0.4 x 0.4 = 0.16 sq cm.
Full-time range; 1 s binning
Other quick-look light curves:
- 64 ms binning (zoomed)
- 16 ms binning (zoomed)
- 8 ms binning (zoomed)
- 2 ms binning (zoomed)
- SN=5 or 10 s binning (full-time range)
- Raw light curve
Spectra
- 64 ms binning (zoomed)
- 16 ms binning (zoomed)
- 8 ms binning (zoomed)
- 2 ms binning (zoomed)
- SN=5 or 10 s binning (full-time range)
- Raw light curve
Spectra
Notes:
- 1) The fitting includes the systematic errors.
- 2) When the burst includes telescope slew time periods, the fitting uses an average response file made from multiple 5-s response files through out the slew time plus single time preiod for the non-slew times, and weighted by the total counts in the corresponding time period using addrmf. An average response file is needed becuase a spectral fit using the pre-slew DRM will introduce some errors in both a spectral shape and a normalization if the PHA file contains a lot of the slew/post-slew time interval.
- 3) For fits to more complicated models (e.g. a power-law over a cutoff power-law), the BAT team has decided to require a chi-square improvement of more than 6 for each extra dof.
Time averaged spectrum fit using the average DRM
Power-law model
Time interval is from   -1.264 sec. to   10.736 sec.

Spectral model in power-law:
------------------------------------------------------------
Parameters  : value       lower 90%   higher 90%
Photon index: -1.74235     ( -0.0582662   0.0578771 )
Norm@50keV  : 3.02944E-02    ( -0.000994771   0.000993314 )
------------------------------------------------------------
#Fit statistic : Chi-Squared =          60.65 using 59 PHA bins.
# Reduced chi-squared =          1.064 for     57 degrees of freedom
# Null hypothesis probability =   3.457020e-01

Photon flux (15-150 keV)    in 12 sec: 4.08503 ( -0.14275  0.14315 ) ph/cm2/s
Energy fluence (15-150 keV)             : 3.35646e-06 ( -1.13129e-07  1.13394e-07 ) ergs/cm2
Cutoff power-law model
Time interval is from   -1.264 sec. to   10.736 sec.
Spectral model in the cutoff power-law:
------------------------------------------------------------
Parameters  : value       lower 90%   higher 90%
Photon index: -1.23048     ( -0.241381   0.255163 )
Epeak [keV] : 77.6499      ( -10.8136 24.4012 )
Norm@50keV  : 5.37366E-02    ( -0.0124414   0.0173335 )
------------------------------------------------------------
#Fit statistic : Chi-Squared =          46.76 using 59 PHA bins.
# Reduced chi-squared =         0.8351 for     56 degrees of freedom
# Null hypothesis probability =   8.056769e-01

Photon flux (15-150 keV)    in 12 sec: 3.95089 ( -0.15392  0.15451 ) ph/cm2/s
Energy fluence (15-150 keV)             : 0 ( 0  0 ) ergs/cm2
1-s peak spectrum fit
Power-law model
Time interval is from   -0.264 sec. to    0.736 sec.

Spectral model in power-law:
------------------------------------------------------------
Parameters  : value       lower 90%   higher 90%
Photon index: -1.45409     ( -0.062711   0.062544 )
Norm@50keV  : 0.149995    ( -0.0056302   0.00562872 )
------------------------------------------------------------
#Fit statistic : Chi-Squared =          56.08 using 59 PHA bins.
# Reduced chi-squared =         0.9838 for     57 degrees of freedom
# Null hypothesis probability =   5.096617e-01

Photon flux (15-150 keV)    in 1 sec: 18.5040 ( -0.7286  0.7296 ) ph/cm2/s
Energy fluence (15-150 keV)             : 1.43443e-06 ( -5.75059e-08  5.76428e-08 ) ergs/cm2
Cutoff power-law model
Time interval is from   -0.264 sec. to    0.736 sec.
Spectral model in the cutoff power-law:
------------------------------------------------------------
Parameters  : value       lower 90%   higher 90%
Photon index: -0.94413     ( -0.261524   0.27794 )
Epeak [keV] : 111.345      ( -21.8444 59.333 )
Norm@50keV  : 0.262906    ( -0.0643039   0.0914711 )
------------------------------------------------------------
#Fit statistic : Chi-Squared =          44.41 using 59 PHA bins.
# Reduced chi-squared =         0.7931 for     56 degrees of freedom
# Null hypothesis probability =   8.679898e-01

Photon flux (15-150 keV)    in 1 sec: 18.1267 ( -0.7505  0.7516 ) ph/cm2/s
Energy fluence (15-150 keV)             : 1.40275e-06 ( -6.08505e-08  6.06397e-08 ) ergs/cm2
Time-resolved spectra
Distribution
T90 vs. Hardness ratio plot
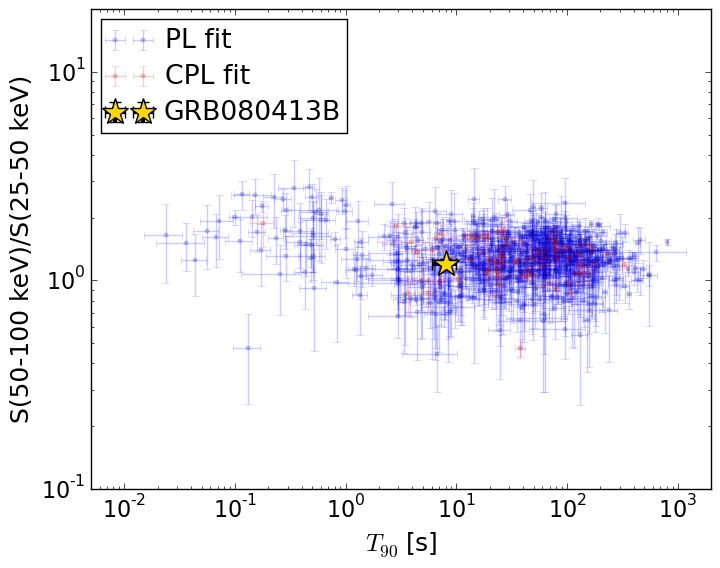
T90                                   = 8.0 sec.
Hardness ratio (energy fluence ratio) = 1.19558363922
S(15-50 keV) vs. S(50-150 keV) plot
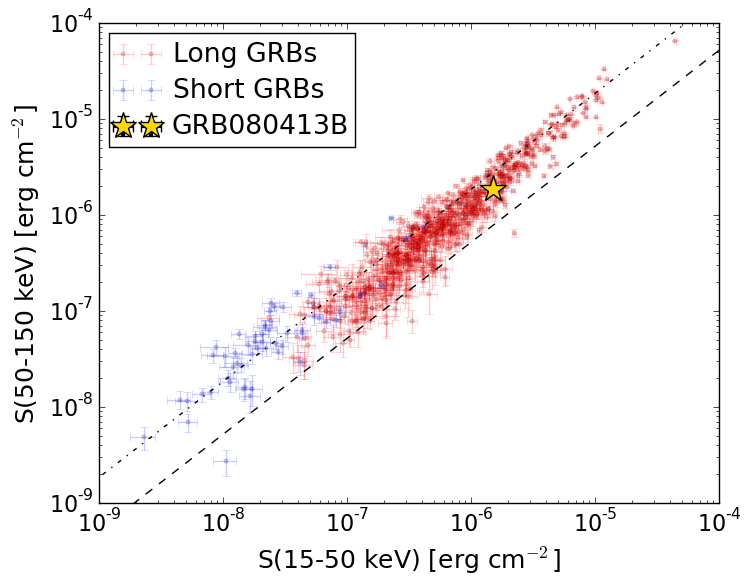
S(15-50 keV)  = 1.507348e-06
S(50-150 keV) = 1.8491303e-06
The dash-dotted line and the dashed line traces the fluences calculated from the Band function with Epeak = 15 and 150 keV, respectively. Both lines assume a canonical values of alpha = -1 and beta = -2.5.
Mask shadow pattern
IMX = 3.352746678764664E-02, IMY = 7.311830148425137E-01
Spacecraft aspect plot
Bright source in the pre-burst/pre-slew/post-slew images
Pre-burst image of 15-350 keV band
Time interval of the image:
-239.264000 -1.264000

# RAcent  DECcent POSerr Theta    Phi  PeakCts   SNR AngSep     Name
#  [deg]    [deg]    ['] [deg]  [deg]                   [']
256.0707 -37.8202    3.0  28.0   67.0   1.0963   3.9    4.2	4U 1700-377
256.4110 -36.5572   16.7  27.5   69.6   0.1905   0.7    8.1	GX 349+2
262.8753 -24.6195   13.1  22.1   98.6  -0.1963  -0.9   10.5	GX 1+4
264.6343 -44.5812   13.0  24.8   47.2   0.1898   0.9    9.1	4U 1735-44
268.3866  -1.4521   96.8  31.9  148.4   0.0356   0.1    1.1	SW J1753.5-0127
270.2052 -25.1391    3.6  15.5  101.8   0.6421   3.3    5.6	GX 5-1
270.1680 -25.7087    3.8  15.4   99.6   0.6789   3.5    7.6	GRS 1758-258
274.0714 -14.0951    2.1  18.3  141.4   1.1172   5.6    5.2	GX 17+2
275.9409 -30.3590    2.9  10.3   78.4   0.7014   4.0    1.0	H1820-303
285.0505 -24.8819    7.2   3.4  150.0   0.2886   1.6    2.4	HT1900.1-2455
288.7303  10.9281   24.9  38.6 -171.5   0.1252   0.5    4.1	GRS 1915+105
262.8888 -33.8865    2.8  21.8   73.7   0.8928   4.1    5.9	GX 354-0
245.3322 -16.6748    2.1  40.2  103.1   4.1587   5.6 ------	UNKNOWN
266.7949 -27.3594    1.0  18.2   92.5   2.3747  11.5 ------	UNKNOWN
277.3015 -23.7981    2.2   9.8  117.3   0.9191   5.3 ------	UNKNOWN
289.3230 -34.9450    3.2   7.5   -6.6   0.6534   3.6 ------	UNKNOWN
285.2097   0.7171    2.8  28.5 -178.1   0.8319   4.1 ------	UNKNOWN
285.2400   7.4263    2.7  35.2 -177.3   0.9780   4.3 ------	UNKNOWN
314.0114 -17.8759    4.4  26.4  -99.8   0.7314   2.7 ------	UNKNOWN
305.8002  18.3594    3.7  49.4 -150.4   1.6621   3.1 ------	UNKNOWN
Pre-slew background subtracted image of 15-350 keV band
Time interval of the image:
-1.264000 10.736000

# RAcent  DECcent POSerr Theta    Phi  PeakCts   SNR AngSep     Name
#  [deg]    [deg]    ['] [deg]  [deg]                   [']
256.1670 -37.8791    8.4  27.9   66.8  -0.0757  -1.4    8.8	4U 1700-377
256.2620 -36.3547    6.4  27.6   70.0   0.1006   1.8    9.3	GX 349+2
262.9156 -24.6001    9.0  22.1   98.7   0.0655   1.3   10.1	GX 1+4
264.7739 -44.4433  276.3  24.6   47.3  -0.0020  -0.0    1.4	4U 1735-44
268.4954  -1.5856    0.0  31.7  148.4   0.0759   1.3   11.0	SW J1753.5-0127
270.1467 -24.9804    5.5  15.6  102.3   0.0895   2.1    9.5	GX 5-1
270.3080 -25.7883    7.8  15.3   99.4   0.0643   1.5    2.7	GRS 1758-258
274.1558 -14.1762    0.0  18.2  141.4  -0.0585  -1.3   12.1	GX 17+2
275.7513 -30.3724    6.5  10.4   78.5   0.0772   1.8    9.0	H1820-303
284.9368 -25.0793   71.9   3.3  146.6  -0.0075  -0.2   10.9	HT1900.1-2455
288.8770  11.1017    5.6  38.8 -171.3   0.1341   2.1   10.4	GRS 1915+105
263.1756 -33.7775    6.9  21.6   73.8   0.0801   1.7    9.9	GX 354-0
263.9918  -1.6597    2.3  34.3  141.6   0.2778   4.9 ------	UNKNOWN
291.5600 -79.6949    2.2  52.1    5.3   0.6455   5.3 ------	UNKNOWN
280.9647   1.9966    2.8  30.3  173.6   0.2064   4.2 ------	UNKNOWN
349.9949 -76.2738    4.0  56.8   -8.3   0.5476   2.9 ------	UNKNOWN
326.1377 -19.9812    0.3  36.2  -87.4   5.8495  39.7 ------	UNKNOWN
Post-slew image of 15-350 keV band
Time interval of the image:
115.636600 962.858700

# RAcent  DECcent POSerr Theta    Phi  PeakCts   SNR AngSep     Name
#  [deg]    [deg]    ['] [deg]  [deg]                   [']
285.1504 -25.0116    4.8  38.0   97.4   5.2975   2.4    8.3	HT1900.1-2455
288.8384  10.9627    5.1  48.0  149.6  -6.2690  -2.3    2.6	GRS 1915+105
326.1763  38.3543    6.8  58.3 -157.2   9.0739   1.7    2.0	Cyg X-2
285.3955 -41.6945    2.8  40.6   71.2  11.2977   4.2 ------	UNKNOWN
319.5066 -52.9888    3.9  33.4   30.0   2.5495   2.9 ------	UNKNOWN
342.5763   4.9687    3.0  29.7 -122.6   3.2562   3.8 ------	UNKNOWN
348.1593  -4.5351    5.5  26.4 -100.1   1.8290   2.1 ------	UNKNOWN
353.7782  -4.1908    2.4  31.2  -94.0   5.1509   4.9  449.8	UNKNOWN
357.1323  -8.5063    2.7  32.1  -83.7   4.8008   4.2  538.4	UNKNOWN
352.6198  16.4467    2.7  44.8 -119.8  12.7147   4.2 ------	UNKNOWN