Analysis Summary
Notes:
- 1) No attempt has been made to eliminate the non-significant decimal places.
- 2) This batgrbproduct analysis is done using the HEASARC data.
- 3) This batgrbproduct analysis is using the flight position for the mask-weighting calculation.
======================================================================
                  BAT GRB EVENT DATA PROCESSING REPORT
    Process Script Ver: batgrbproduct v2.46
    Process Start Time: Mon Jan 20 02:38:09 EST 2014
             Host Name: batevent1
   Current Working Dir: /local/data/batevent/batevent_reproc/trigger310219
======================================================================

  Trigger: 00310219      Segment: 000

  BAT Trigger Time: 230909005.696   [s; MET]
      Trigger Stop: 230909005.76   [s; MET]
               UTC: 2008-04-26T13:23:22.949980    [includes UTCF correction]
       Where From?: (*SHORT BURST*) TDRSS scaled map message

  BAT
    RA: 26.5741933788889   Dec: 69.4917855038209  [deg; J2000]

     Catalogged Source?: NO
     Point Source?:      YES
     GRB Indicated?:     YES    [ by BAT flight software ]
     Image S/N Ratio:    8.32
     Image Trigger?:     NO
     Rate S/N Ratio:     25.2586618806302  [ if not an image trigger ]
     Image S/N Ratio:    8.32

  Analysis Position:   [ source = BAT ]
    RA: 26.5741933788889   Dec: 69.4917855038209  [deg; J2000]

  Refined Position:   [ source = BAT pre-slew burst ]
    RA: 26.5117622145044   Dec: 69.4686575708358  [deg; J2000]
        { 01h 46m 02.8s , +69d 28' 07.2" }
         +/- 1.09380126954739 [arcmin] (estimated 90% radius based on SNR)
         +/- 0.344493511880156 [arcmin] (formal 1-sigma fit error)
    SNR: 26.7603667576436

  Angular difference between the analysis and refined position is 1.910425 arcmin

  Partial Coding Fraction: 0.4335938    [ including projection effects ]

  Duration
     T90: 1.7320000231266 +/- 0.383603980024552
        Measured from: -0.0240000188350677
                   to: 1.70800000429153     [s; relative to TRIGTIME]
     T50: 0.612000018358231 +/- 0.123223349376793
        Measured from: 0.143999993801117
                   to: 0.756000012159348     [s; relative to TRIGTIME]


  Fluence
     Peak Flux  (peak 1 second)
        Measured from: -0.112000018358231
                   to: 0.887999981641769     [s; relative to TRIGTIME]
     Total Fluence
        Measured from: -0.148000001907349
                   to: 2.08799999952316     [s; relative to TRIGTIME]

             Band 1     Band 2     Band 3     Band 4
              15-25      25-50     50-100    100-350     keV
 Total     0.238866   0.258778   0.150707   0.011165
           0.013788   0.014487   0.011851   0.008832 [error]
 Peak      0.176036   0.215705   0.121210   0.004363
           0.010360   0.011422   0.009099   0.006175 [error]

     [ fluence units of on-axis counts / fully illuminated detector ]

======================================================================


====== Table of the duration information =============================

        Value   tstart    tstop
T100    2.236   -0.148    2.088
T90     1.732   -0.024    1.708
T50     0.612    0.144    0.756
Peak    1.000   -0.112    0.888


====== Spectral Analysis Summary =====================================

Model      : spectral model: simple power-law (PL) and cutoff power-law (CPL)
Ph_index   : photon index: E^{Ph_index}
Ph_90err   : 90% error of the photon index
Epeak      : Epeak in keV
Epeak_90err: 90% error of Epeak
Norm       : normalization at 50 keV in both the PL model and CPL model
Nomr_90err : 90% error of the normalization
chi2       : Chi-Squared
dof        : degree of freedo

=== Time-averaged spectral analysis ===
(Best model with acceptable fit: PL)

Model Ph_index Ph_90err_low Ph_90err_hi  Epeak  Epeak_90err_low  Epeak_90err_hi  Norm       Nomr_90err_low    Norm_90err_hi    chi2    dof
PL      -1.915    -0.120      0.117       -           -               -         1.82e-02     -1.33e-03          1.31e-03      49.870   57
CPL     -1.747    -0.396      0.455       69.796     -50.958       -69.796      2.24e-02        N/A               N/A         49.410   56


=== 1-s peak spectral analysis ===
(Best model with acceptable fit: N/A)

Model Ph_index Ph_90err_low Ph_90err_hi  Epeak  Epeak_90err_low  Epeak_90err_hi  Norm       Nomr_90err_low    Norm_90err_hi    chi2    dof
PL      -1.911     -0.110     0.107       -           -               -         3.17e-02     -2.25e-03          2.23e-03      83.600   57
CPL     -1.138     -0.455     0.508       50.547      -7.736        13.613      8.40e-02     -3.61e-02          7.44e-02      74.600   56


=== Fluence/Peak Flux Summary ===

              Model    Band1     Band2     Band3     Band4     Band5     Total
                       15-25     25-50    50-100    100-350    15-150    15-350    keV
Fluence         PL   7.68e-08  1.10e-07  1.16e-07  2.29e-07  3.75e-07  5.32e-07   erg/cm2
      90%_error_low -7.54e-09 -6.96e-09 -1.15e-08 -4.34e-08 -2.67e-08 -5.53e-08   erg/cm2
      90%_error_hi   7.73e-09  6.96e-09  1.16e-08  4.97e-08  2.69e-08  5.98e-08   erg/cm2
Peak flux       PL   1.94e+00  1.53e+00  8.16e-01  6.31e-01  4.58e+00  4.92e+00   ph/cm2/s
      90%_error_low -1.82e-01 -9.63e-02 -7.45e-02 -1.05e-01 -2.91e-01 -3.06e-01   ph/cm2/s
      90%_error_hi   1.86e-01  9.62e-02  7.45e-02  1.16e-01  2.91e-01  3.06e-01   ph/cm2/s

Fluence        CPL   7.52e-08  1.12e-07  1.17e-07  1.73e-07  3.69e-07  4.77e-07   erg/cm2
      90%_error_low -8.63e-09 -8.14e-09 -1.19e-08 -8.47e-08 -2.96e-08 -9.06e-08   erg/cm2
      90%_error_hi   8.70e-09  8.81e-09  1.20e-08  6.87e-08  2.96e-08  7.88e-08   erg/cm2
Peak flux      CPL   1.75e+00  1.67e+00  8.41e-01  2.69e-01  4.45e+00  4.53e+00   ph/cm2/s
      90%_error_low -2.11e-01 -1.24e-01 -8.41e-02 -1.07e-01 -2.99e-01 -3.22e-01   ph/cm2/s
      90%_error_hi   2.13e-01  1.27e-01  8.42e-02  1.69e-01  2.99e-01  3.34e-01   ph/cm2/s

======================================================================
Image
Pre-slew 15.0-350.0 keV image (Event data)
#   RAcent    DECcent   POSerr    Theta     Phi              Peak Cts       SNR   Name
   26.5118    69.4687   0.0072    29.6888   -98.7296         0.7115681     26.760 TRIG_00310219

Foreground time interval of the image:
 -0.148   2.088 (delta_t =   2.236 [sec])
Background time interval of the image:
-511.295 -489.616 (delta_t =  21.679 [sec])
-239.696  -0.148 (delta_t = 239.548 [sec])
Light Curves
Note: The mask-weighted lightcurves have units of either count/det or counts/sec/det, where a det is 0.4 x 0.4 = 0.16 sq cm.
Full-time range; 1 s binning
Other quick-look light curves:
- 64 ms binning (zoomed)
- 16 ms binning (zoomed)
- 8 ms binning (zoomed)
- 2 ms binning (zoomed)
- SN=5 or 10 s binning (full-time range)
- Raw light curve
Spectra
- 64 ms binning (zoomed)
- 16 ms binning (zoomed)
- 8 ms binning (zoomed)
- 2 ms binning (zoomed)
- SN=5 or 10 s binning (full-time range)
- Raw light curve
Spectra
Notes:
- 1) The fitting includes the systematic errors.
- 2) When the burst includes telescope slew time periods, the fitting uses an average response file made from multiple 5-s response files through out the slew time plus single time preiod for the non-slew times, and weighted by the total counts in the corresponding time period using addrmf. An average response file is needed becuase a spectral fit using the pre-slew DRM will introduce some errors in both a spectral shape and a normalization if the PHA file contains a lot of the slew/post-slew time interval.
- 3) For fits to more complicated models (e.g. a power-law over a cutoff power-law), the BAT team has decided to require a chi-square improvement of more than 6 for each extra dof.
Time averaged spectrum fit using the average DRM
Power-law model
Time interval is from   -0.148 sec. to    2.088 sec.

Spectral model in power-law:
------------------------------------------------------------
Parameters  : value       lower 90%   higher 90%
Photon index: -1.91452     ( -0.120216   0.117233 )
Norm@50keV  : 1.82122E-02    ( -0.00132707   0.00131045 )
------------------------------------------------------------
#Fit statistic : Chi-Squared =          49.87 using 59 PHA bins.
# Reduced chi-squared =         0.8749 for     57 degrees of freedom
# Null hypothesis probability =   7.372562e-01

Photon flux (15-150 keV)    in 2.236 sec: 2.63006 ( -0.17104  0.17126 ) ph/cm2/s
Energy fluence (15-150 keV)             : 3.74517e-07 ( -2.66668e-08  2.68691e-08 ) ergs/cm2
Cutoff power-law model
Time interval is from   -0.148 sec. to    2.088 sec.
Spectral model in the cutoff power-law:
------------------------------------------------------------
Parameters  : value       lower 90%   higher 90%
Photon index: -1.74737     ( -0.396459   0.455013 )
Epeak [keV] : 69.7961      ( -50.958 -69.7961 )
Norm@50keV  : 2.24113E-02    (     )
------------------------------------------------------------
#Fit statistic : Chi-Squared =          49.41 using 59 PHA bins.
# Reduced chi-squared =         0.8823 for     56 degrees of freedom
# Null hypothesis probability =   7.208191e-01

Photon flux (15-150 keV)    in 2.236 sec: 2.60954 ( -0.17838  0.17841 ) ph/cm2/s
Energy fluence (15-150 keV)             : 3.69369e-07 ( -2.95785e-08  2.96297e-08 ) ergs/cm2
1-s peak spectrum fit
Power-law model
Time interval is from   -0.112 sec. to    0.888 sec.

Spectral model in power-law:
------------------------------------------------------------
Parameters  : value       lower 90%   higher 90%
Photon index: -1.91051     ( -0.109734   0.106964 )
Norm@50keV  : 3.17351E-02    ( -0.00225328   0.00223101 )
------------------------------------------------------------
#Fit statistic : Chi-Squared =          83.60 using 59 PHA bins.
# Reduced chi-squared =          1.467 for     57 degrees of freedom
# Null hypothesis probability =   1.240227e-02

Photon flux (15-150 keV)    in 1 sec: 4.57506 ( -0.29073  0.29098 ) ph/cm2/s
Energy fluence (15-150 keV)             : 2.91843e-07 ( -2.03366e-08  2.04771e-08 ) ergs/cm2
Cutoff power-law model
Time interval is from   -0.112 sec. to    0.888 sec.
Spectral model in the cutoff power-law:
------------------------------------------------------------
Parameters  : value       lower 90%   higher 90%
Photon index: -1.13769     ( -0.455234   0.508296 )
Epeak [keV] : 50.5474      ( -7.73588 13.613 )
Norm@50keV  : 8.39868E-02    ( -0.0360594   0.0744064 )
------------------------------------------------------------
#Fit statistic : Chi-Squared =          74.60 using 59 PHA bins.
# Reduced chi-squared =          1.332 for     56 degrees of freedom
# Null hypothesis probability =   4.890885e-02

Photon flux (15-150 keV)    in 1 sec: 4.45353 ( -0.29884  0.29903 ) ph/cm2/s
Energy fluence (15-150 keV)             : 0 ( 0  0 ) ergs/cm2
Time-resolved spectra
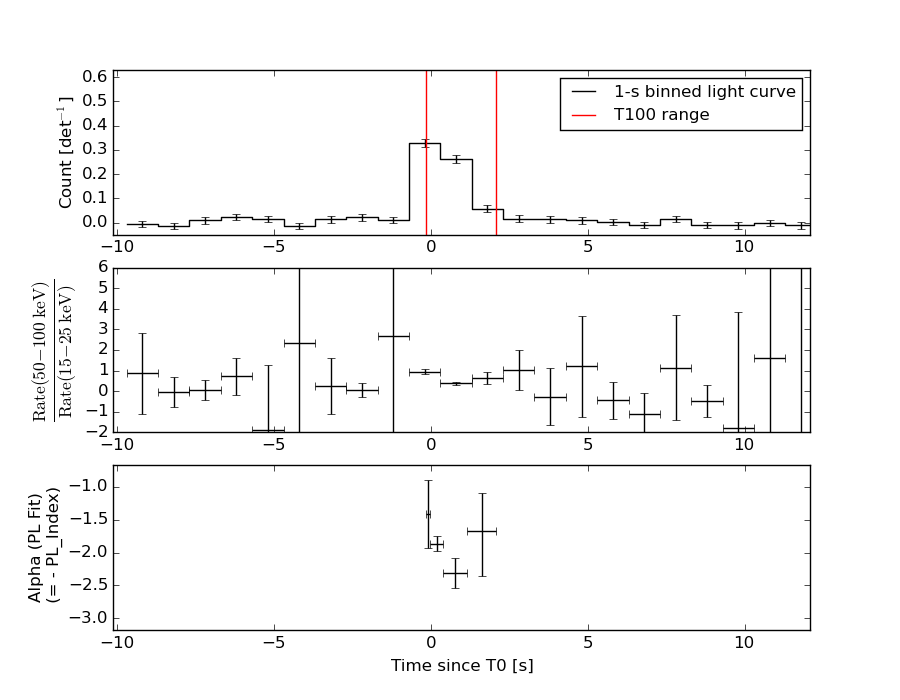
Distribution
T90 vs. Hardness ratio plot
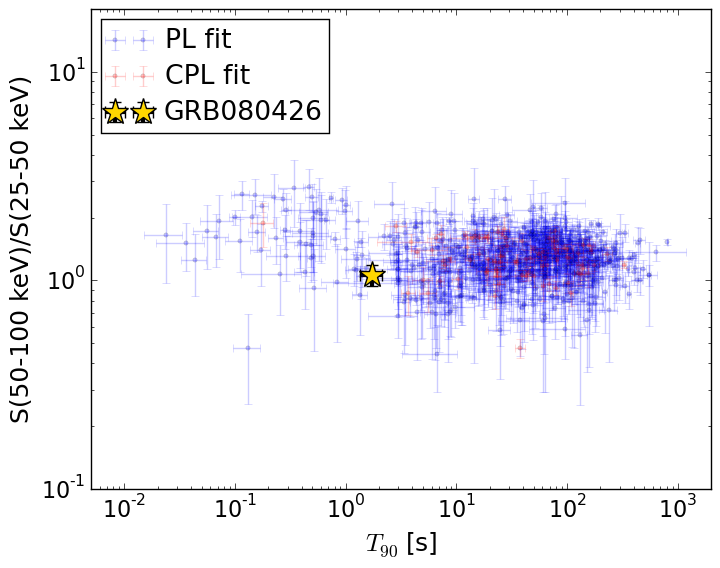
T90                                   = 1.732 sec.
Hardness ratio (energy fluence ratio) = 1.06108511964
S(15-50 keV) vs. S(50-150 keV) plot
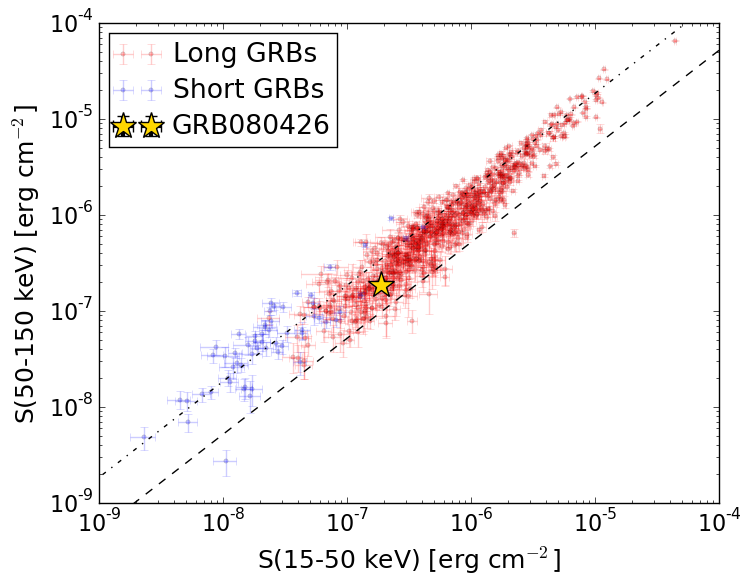
S(15-50 keV)  = 1.8662569e-07
S(50-150 keV) = 1.8789102e-07
The dash-dotted line and the dashed line traces the fluences calculated from the Band function with Epeak = 15 and 150 keV, respectively. Both lines assume a canonical values of alpha = -1 and beta = -2.5.
Mask shadow pattern
IMX = -8.652968683331717E-02, IMY = 5.635253212181688E-01
Spacecraft aspect plot
Bright source in the pre-burst/pre-slew/post-slew images
Pre-burst image of 15-350 keV band
Time interval of the image:
-511.295400 -489.616200
-239.696000 -0.148000

# RAcent  DECcent POSerr Theta    Phi  PeakCts   SNR AngSep     Name
#  [deg]    [deg]    ['] [deg]  [deg]                   [']
254.4197  35.3355    3.4  40.5   66.3   2.4066   3.4    1.9	Her X-1
299.5989  35.2059    0.5  41.1    9.0   7.3578  24.1    0.5	Cyg X-1
308.2994  40.8282    0.0  37.0   -3.5  -0.2711  -1.2   11.4	Cyg X-3
326.2742  38.4665   13.8  43.1  -23.2   0.2429   0.8    9.9	Cyg X-2
269.0112  31.0455    2.3  43.7   47.5   3.0846   5.1 ------	UNKNOWN
149.4602  44.2955    2.7  55.8  175.3   3.6296   4.3 ------	UNKNOWN
302.3640  35.6573    3.1  41.1    5.5   1.0034   3.8 ------	UNKNOWN
 45.4018  69.6176    2.6  32.5 -110.3   1.2106   4.4 ------	UNKNOWN
Pre-slew background subtracted image of 15-350 keV band
Time interval of the image:
-0.148000 2.088000

# RAcent  DECcent POSerr Theta    Phi  PeakCts   SNR AngSep     Name
#  [deg]    [deg]    ['] [deg]  [deg]                   [']
254.4935  35.1853    9.0  40.6   66.2  -0.0668  -1.3    9.6	Her X-1
299.6018  35.0488    5.8  41.3    9.0  -0.0532  -2.0    9.2	Cyg X-1
307.9693  40.8647    6.5  36.9   -3.1   0.0394   1.8    8.3	Cyg X-3
326.1705  38.3231  149.3  43.2  -23.1  -0.0022  -0.1    0.1	Cyg X-2
244.3497  79.8299    1.9   8.4 -178.0   0.0870   6.1 ------	UNKNOWN
 26.5117  69.4687    0.4  29.7  -98.7   0.7116  26.8 ------	UNKNOWN
Post-slew image of 15-350 keV band
Time interval of the image:
206.404590 962.365600

# RAcent  DECcent POSerr Theta    Phi  PeakCts   SNR AngSep     Name
#  [deg]    [deg]    ['] [deg]  [deg]                   [']
308.0334  40.9714    4.3  48.2   16.2   2.6308   2.7    3.7	Cyg X-3
326.2266  38.2899   16.0  44.2   -2.8   0.5206   0.7    3.2	Cyg X-2
156.9851  59.3347    2.5  46.4  131.8   7.5778   4.6 ------	UNKNOWN
 73.4607  72.4915    2.7  15.1  156.6   1.4041   4.2 ------	UNKNOWN
113.1271  34.3081    4.7  57.0  179.0   7.3721   2.9 ------	UNKNOWN
112.8517  34.2641    5.7  56.9  179.2   7.0564   2.8 ------	UNKNOWN
  7.3002  51.6128    2.6  20.0  -44.0   1.7434   4.5 ------	UNKNOWN
341.9810  20.0293    3.8  56.3  -28.2   6.5089   3.0 ------	UNKNOWN
 71.5428  25.6683    4.2  51.0 -135.7   7.8885   2.8 ------	UNKNOWN