Analysis Summary
Notes:
- 1) No attempt has been made to eliminate the non-significant decimal places.
- 2) This batgrbproduct analysis is done using the HEASARC data.
- 3) This batgrbproduct analysis is using the flight position for the mask-weighting calculation.
======================================================================
BAT GRB EVENT DATA PROCESSING REPORT
Process Script Ver: batgrbproduct v2.46
Process Start Time: Mon Jan 20 02:32:30 EST 2014
Host Name: batevent1
Current Working Dir: /local/data/batevent/batevent_reproc/trigger310613
======================================================================
Trigger: 00310613 Segment: 000
BAT Trigger Time: 231277984.832 [s; MET]
Trigger Stop: 231277985.344 [s; MET]
UTC: 2008-04-30T19:53:02.075640 [includes UTCF correction]
Where From?: TDRSS position message
BAT
RA: 165.322321743452 Dec: 51.6894257321077 [deg; J2000]
Catalogged Source?: NO
Point Source?: YES
GRB Indicated?: YES [ by BAT flight software ]
Image S/N Ratio: 10.83
Image Trigger?: NO
Rate S/N Ratio: 19.3390796058137 [ if not an image trigger ]
Image S/N Ratio: 10.83
Analysis Position: [ source = BAT ]
RA: 165.322321743452 Dec: 51.6894257321077 [deg; J2000]
Refined Position: [ source = BAT pre-slew burst ]
RA: 165.328643441155 Dec: 51.6815222003603 [deg; J2000]
{ 11h 01m 18.9s , +51d 40' 53.5" }
+/- 0.694349954333688 [arcmin] (estimated 90% radius based on SNR)
+/- 0.2616031070918 [arcmin] (formal 1-sigma fit error)
SNR: 51.2194529072589
Angular difference between the analysis and refined position is 0.529317 arcmin
Partial Coding Fraction: 1.015625 [ including projection effects ]
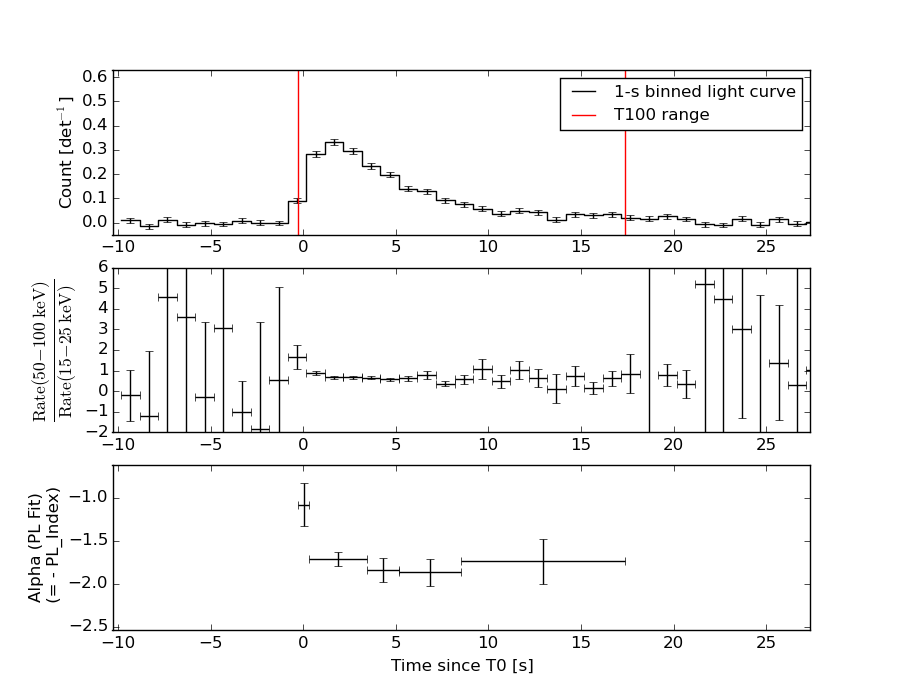
Duration
T90: 13.8720000088215 +/- 1.89973156912445
Measured from: 0.376000016927719
to: 14.2480000257492 [s; relative to TRIGTIME]
T50: 4.87999999523163 +/- 0.350907413302386
Measured from: 1.75600001215935
to: 6.63600000739098 [s; relative to TRIGTIME]
Fluence
Peak Flux (peak 1 second)
Measured from: 1.70400002598763
to: 2.70400002598763 [s; relative to TRIGTIME]
Total Fluence
Measured from: -0.299999982118607
to: 17.3640000224113 [s; relative to TRIGTIME]
Band 1 Band 2 Band 3 Band 4
15-25 25-50 50-100 100-350 keV
Total 0.733599 0.808894 0.498701 0.112318
0.022375 0.023641 0.021848 0.021681 [error]
Peak 0.115149 0.123691 0.080592 0.019099
0.006226 0.006588 0.006057 0.005466 [error]
[ fluence units of on-axis counts / fully illuminated detector ]
======================================================================
====== Table of the duration information =============================
Value tstart tstop
T100 17.664 -0.300 17.364
T90 13.872 0.376 14.248
T50 4.880 1.756 6.636
Peak 1.000 1.704 2.704
====== Spectral Analysis Summary =====================================
Model : spectral model: simple power-law (PL) and cutoff power-law (CPL)
Ph_index : photon index: E^{Ph_index}
Ph_90err : 90% error of the photon index
Epeak : Epeak in keV
Epeak_90err: 90% error of Epeak
Norm : normalization at 50 keV in both the PL model and CPL model
Nomr_90err : 90% error of the normalization
chi2 : Chi-Squared
dof : degree of freedo
=== Time-averaged spectral analysis ===
(Best model with acceptable fit: PL)
Model Ph_index Ph_90err_low Ph_90err_hi Epeak Epeak_90err_low Epeak_90err_hi Norm Nomr_90err_low Norm_90err_hi chi2 dof
PL -1.734 -0.080 0.079 - - - 7.17e-03 -2.91e-04 2.90e-04 57.560 57
CPL -1.726 1.726 0.162 9854.160 N/A N/A 7.23e-03 N/A N/A 57.660 56
=== 1-s peak spectral analysis ===
(Best model with acceptable fit: PL)
Model Ph_index Ph_90err_low Ph_90err_hi Epeak Epeak_90err_low Epeak_90err_hi Norm Nomr_90err_low Norm_90err_hi chi2 dof
PL -1.751 -0.121 0.118 - - - 1.97e-02 -1.38e-03 1.37e-03 61.110 57
CPL -1.645 -0.401 0.489 151.587 N/A N/A 2.25e-02 N/A N/A 60.960 56
=== Fluence/Peak Flux Summary ===
Model Band1 Band2 Band3 Band4 Band5 Total
15-25 25-50 50-100 100-350 15-150 15-350 keV
Fluence PL 2.01e-07 3.21e-07 3.86e-07 9.07e-07 1.17e-06 1.82e-06 erg/cm2
90%_error_low -1.38e-08 -1.25e-08 -2.23e-08 -1.12e-07 -4.99e-08 -1.28e-07 erg/cm2
90%_error_hi 1.42e-08 1.24e-08 2.24e-08 1.23e-07 5.02e-08 1.37e-07 erg/cm2
Peak flux PL 1.03e+00 8.95e-01 5.32e-01 4.75e-01 2.66e+00 2.93e+00 ph/cm2/s
90%_error_low -1.02e-01 -5.48e-02 -5.02e-02 -8.50e-02 -1.62e-01 -1.80e-01 ph/cm2/s
90%_error_hi 1.05e-01 5.47e-02 5.03e-02 9.63e-02 1.63e-01 1.81e-01 ph/cm2/s
Fluence CPL 2.01e-07 3.19e-07 3.86e-07 9.05e-07 1.19e-06 1.83e-06 erg/cm2
90%_error_low -1.39e-08 N/A N/A N/A -6.21e-08 -2.78e-07 erg/cm2
90%_error_hi 1.42e-08 N/A N/A N/A 3.25e-08 4.76e-08 erg/cm2
Peak flux CPL 1.02e+00 9.05e-01 5.33e-01 4.07e-01 2.65e+00 2.86e+00 ph/cm2/s
90%_error_low -1.20e-01 -6.22e-02 -5.09e-02 -1.93e-01 -1.77e-01 -2.79e-01 ph/cm2/s
90%_error_hi 1.09e-01 6.85e-02 5.15e-02 1.32e-01 1.74e-01 2.47e-01 ph/cm2/s
======================================================================
Image
Pre-slew 15.0-350.0 keV image (Event data)
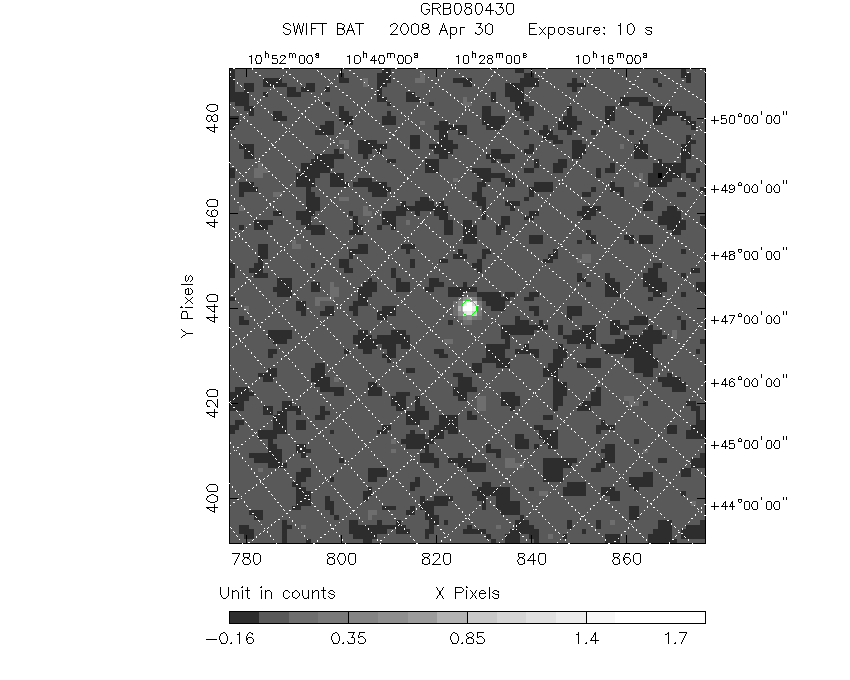
#   RAcent    DECcent   POSerr    Theta     Phi              Peak Cts       SNR   Name
  165.3286    51.6815   0.0038     7.6922    34.6929         1.9437808     51.219 TRIG_00310613

Foreground time interval of the image:
 -0.300  10.069 (delta_t =  10.369 [sec])
Background time interval of the image:
-194.331  -0.300 (delta_t = 194.031 [sec])
Light Curves
Note: The mask-weighted lightcurves have units of either count/det or counts/sec/det, where a det is 0.4 x 0.4 = 0.16 sq cm.
Full-time range; 1 s binning
Other quick-look light curves:
- 64 ms binning (zoomed)
- 16 ms binning (zoomed)
- 8 ms binning (zoomed)
- 2 ms binning (zoomed)
- SN=5 or 10 s binning (full-time range)
- Raw light curve
Spectra
- 64 ms binning (zoomed)
- 16 ms binning (zoomed)
- 8 ms binning (zoomed)
- 2 ms binning (zoomed)
- SN=5 or 10 s binning (full-time range)
- Raw light curve
Spectra
Notes:
- 1) The fitting includes the systematic errors.
- 2) When the burst includes telescope slew time periods, the fitting uses an average response file made from multiple 5-s response files through out the slew time plus single time preiod for the non-slew times, and weighted by the total counts in the corresponding time period using addrmf. An average response file is needed becuase a spectral fit using the pre-slew DRM will introduce some errors in both a spectral shape and a normalization if the PHA file contains a lot of the slew/post-slew time interval.
- 3) For fits to more complicated models (e.g. a power-law over a cutoff power-law), the BAT team has decided to require a chi-square improvement of more than 6 for each extra dof.
Time averaged spectrum fit using the average DRM
Power-law model
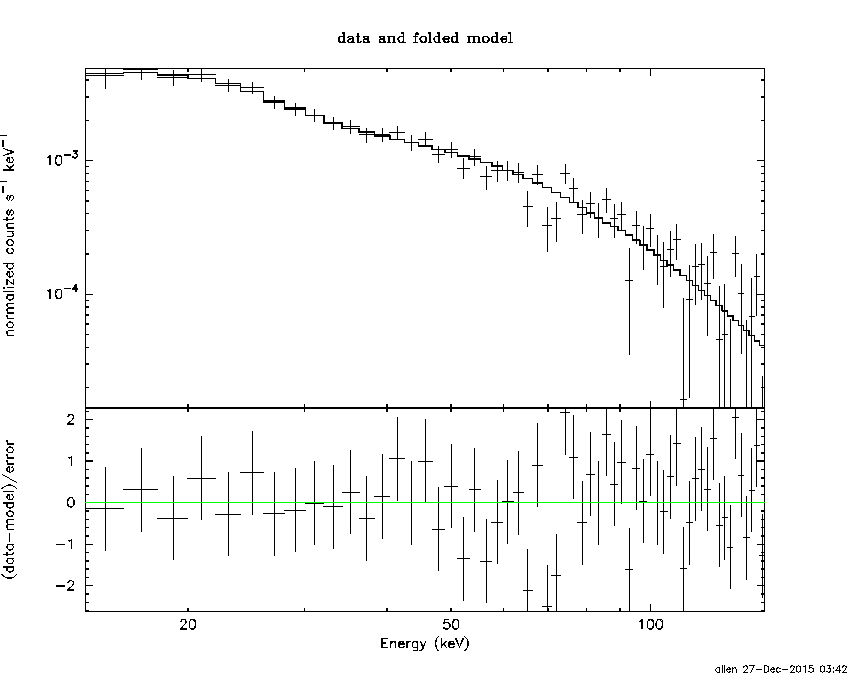
Time interval is from   -0.300 sec. to   17.364 sec.

Spectral model in power-law:
------------------------------------------------------------
Parameters  : value       lower 90%   higher 90%
Photon index: -1.73364     ( -0.0798218   0.0790812 )
Norm@50keV  : 7.17119E-03    ( -0.000291497   0.000289762 )
------------------------------------------------------------
#Fit statistic : Chi-Squared =          57.56 using 59 PHA bins.
# Reduced chi-squared =          1.010 for     57 degrees of freedom
# Null hypothesis probability =   4.543034e-01

Photon flux (15-150 keV)    in 17.66 sec: 0.963927 ( -0.037907  0.038063 ) ph/cm2/s
Energy fluence (15-150 keV)             : 1.16993e-06 ( -4.98741e-08  5.02385e-08 ) ergs/cm2
Cutoff power-law model
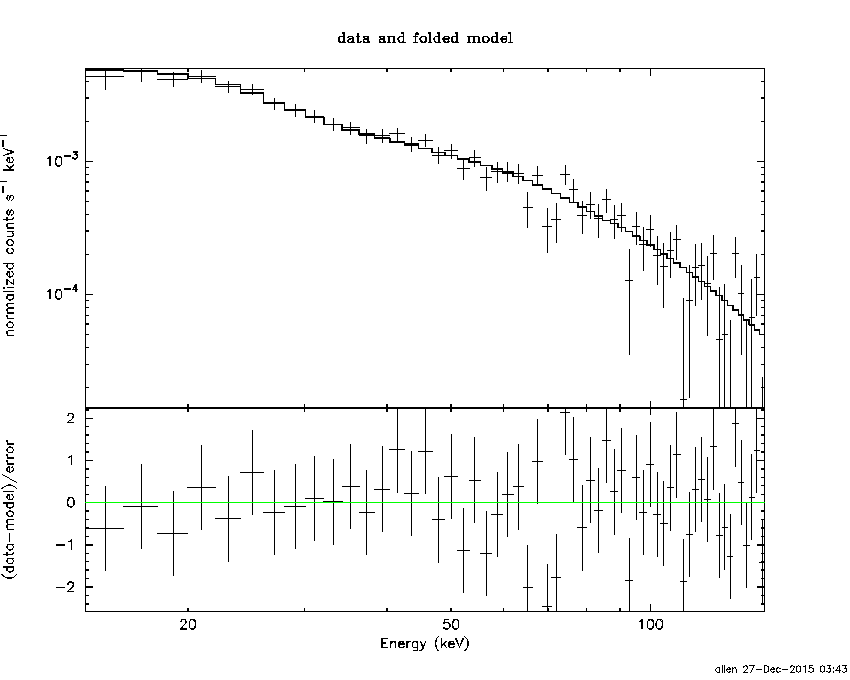
Time interval is from   -0.300 sec. to   17.364 sec.
Spectral model in the cutoff power-law:
------------------------------------------------------------
Parameters  : value       lower 90%   higher 90%
Photon index: -2.01447     ( 2.01447   0.450894 )
Epeak [keV] : 6.12505      (   )
Norm@50keV  : 5.23452E-03    (     )
------------------------------------------------------------
#Fit statistic : Chi-Squared =          55.67 using 59 PHA bins.
# Reduced chi-squared =         0.9941 for     56 degrees of freedom
# Null hypothesis probability =   4.872450e-01

Photon flux (15-150 keV)    in 17.66 sec: 0.976909 ( -0.050978  0.024961 ) ph/cm2/s
Energy fluence (15-150 keV)             : 1.18744e-06 ( -6.21311e-08  3.2481e-08 ) ergs/cm2
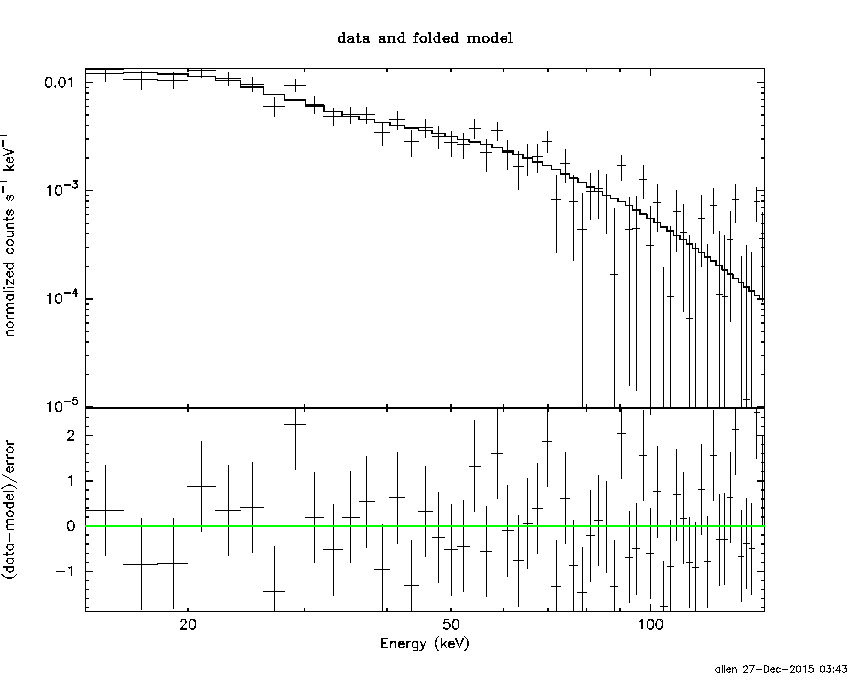
1-s peak spectrum fit
Power-law model

Time interval is from    1.704 sec. to    2.704 sec.

Spectral model in power-law:
------------------------------------------------------------
Parameters  : value       lower 90%   higher 90%
Photon index: -1.75064     ( -0.120563   0.118049 )
Norm@50keV  : 1.96948E-02    ( -0.0013827   0.00136539 )
------------------------------------------------------------
#Fit statistic : Chi-Squared =          61.11 using 59 PHA bins.
# Reduced chi-squared =          1.072 for     57 degrees of freedom
# Null hypothesis probability =   3.305504e-01

Photon flux (15-150 keV)    in 1 sec: 2.66382 ( -0.16243  0.16258 ) ph/cm2/s
Energy fluence (15-150 keV)             : 1.81752e-07 ( -1.32326e-08  1.34211e-08 ) ergs/cm2
Cutoff power-law model
Time interval is from    1.704 sec. to    2.704 sec.
Spectral model in the cutoff power-law:
------------------------------------------------------------
Parameters  : value       lower 90%   higher 90%
Photon index: -1.64516     ( -0.400297   0.489217 )
Epeak [keV] : 151.587      (   )
Norm@50keV  : 2.24794E-02    (     )
------------------------------------------------------------
#Fit statistic : Chi-Squared =          60.96 using 59 PHA bins.
# Reduced chi-squared =          1.089 for     56 degrees of freedom
# Null hypothesis probability =   3.022786e-01

Photon flux (15-150 keV)    in 1 sec: 2.64757 ( -0.17673  0.17354 ) ph/cm2/s
Energy fluence (15-150 keV)             : 0 ( 0  0 ) ergs/cm2
Time-resolved spectra
Distribution
T90 vs. Hardness ratio plot
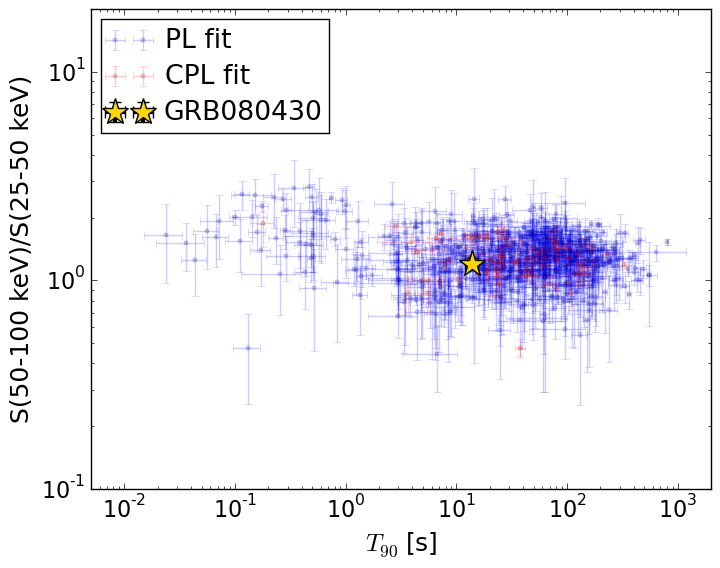
T90                                   = 13.872 sec.
Hardness ratio (energy fluence ratio) = 1.20281788581
S(15-50 keV) vs. S(50-150 keV) plot
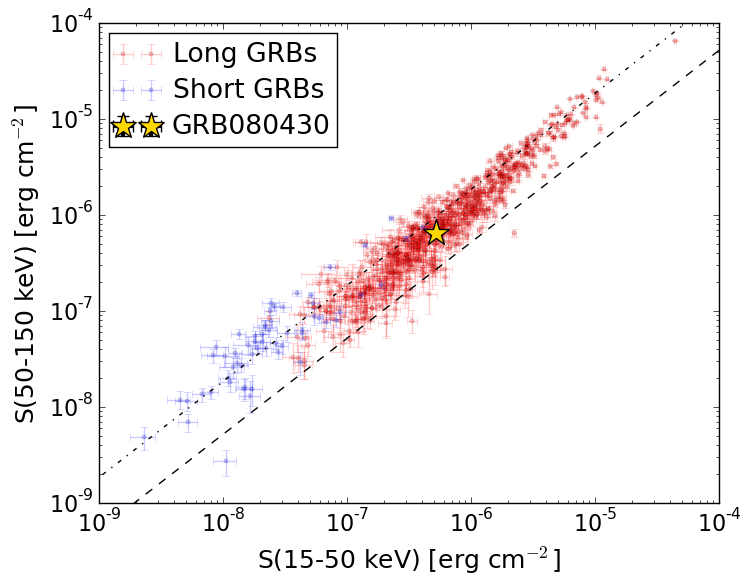
S(15-50 keV)  = 5.225057e-07
S(50-150 keV) = 6.474155e-07
The dash-dotted line and the dashed line traces the fluences calculated from the Band function with Epeak = 15 and 150 keV, respectively. Both lines assume a canonical values of alpha = -1 and beta = -2.5.
Mask shadow pattern
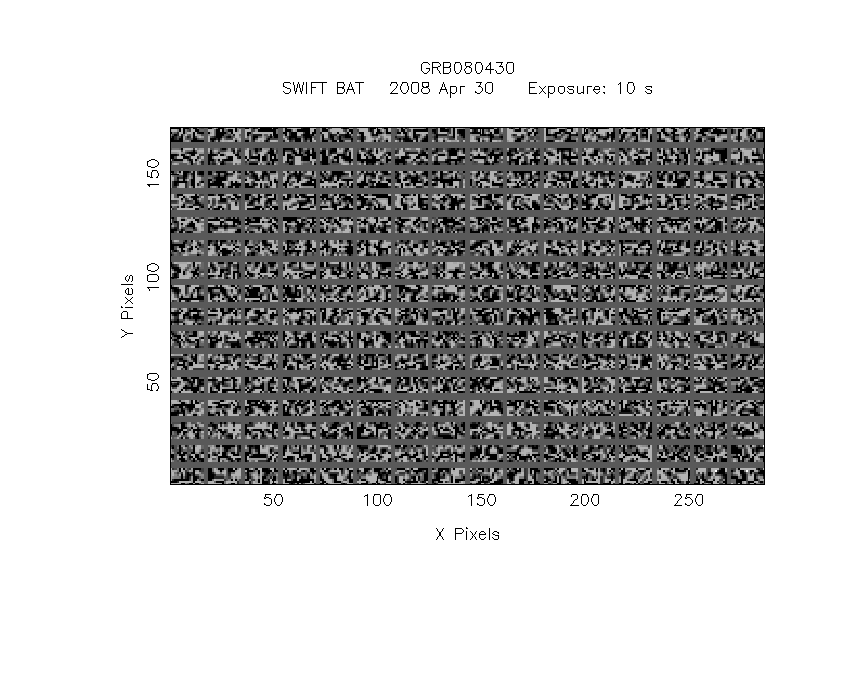
IMX = 1.110536330879647E-01, IMY = -7.687688889994855E-02
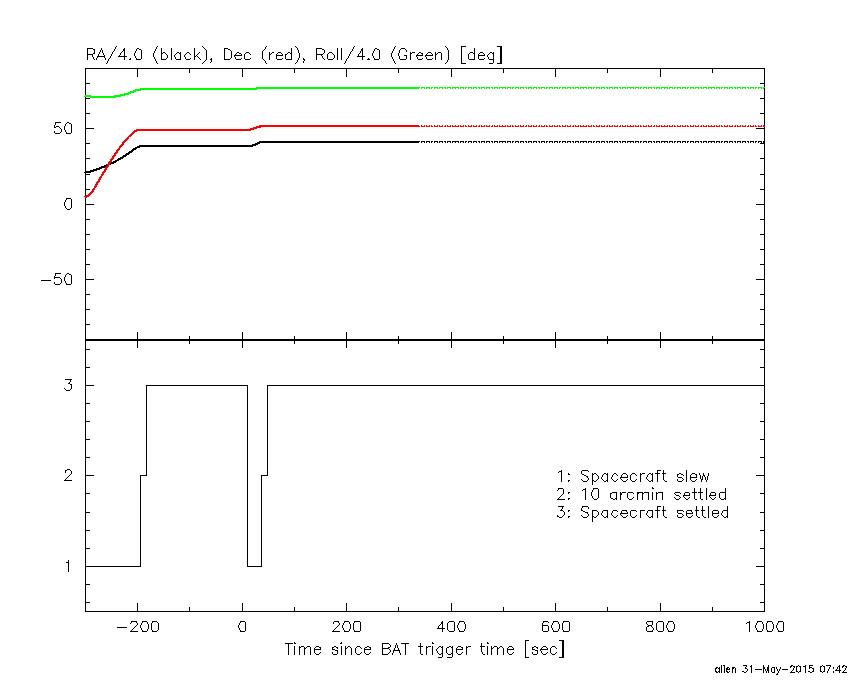
Spacecraft aspect plot
Bright source in the pre-burst/pre-slew/post-slew images
Pre-burst image of 15-350 keV band
Time interval of the image:
-194.331400 -0.300000

# RAcent  DECcent POSerr Theta    Phi  PeakCts   SNR AngSep     Name
#  [deg]    [deg]    ['] [deg]  [deg]                   [']
192.7980  24.0656    2.8  39.6   81.3   2.8873   4.2 ------	UNKNOWN
192.8996  24.4278    3.0  39.4   80.8   2.9385   4.4 ------	UNKNOWN
126.2109  -2.3063    3.4  56.9  179.3   3.3521   3.4 ------	UNKNOWN
247.3321  79.9897    2.0  42.2  -19.2   1.4684   5.8 ------	UNKNOWN
312.0798  80.7695    2.6  49.2  -29.7   1.8053   4.5 ------	UNKNOWN
 79.3441  61.7435    3.4  41.2  -77.9   2.5158   3.4 ------	UNKNOWN
Pre-slew background subtracted image of 15-350 keV band
Time interval of the image:
-0.300000 10.068600

# RAcent  DECcent POSerr Theta    Phi  PeakCts   SNR AngSep     Name
#  [deg]    [deg]    ['] [deg]  [deg]                   [']
165.3286  51.6815    0.2   7.7   34.7   1.9438  51.2 ------	UNKNOWN
Post-slew image of 15-350 keV band
Time interval of the image:
37.468600 962.170500

# RAcent  DECcent POSerr Theta    Phi  PeakCts   SNR AngSep     Name
#  [deg]    [deg]    ['] [deg]  [deg]                   [']
134.6232   0.9533    5.1  56.9  179.1   6.8024   2.3 ------	UNKNOWN
286.6951  61.6084    3.0  57.5   -9.6  10.1525   3.9 ------	UNKNOWN
 84.3418  64.9733    4.2  41.2  -77.8   6.5885   2.8 ------	UNKNOWN
106.4976  25.7306    3.9  51.0 -135.6   9.2966   2.9 ------	UNKNOWN