Analysis Summary
Notes:
- 1) No attempt has been made to eliminate the non-significant decimal places.
- 2) This batgrbproduct analysis is done using the HEASARC data.
- 3) This batgrbproduct analysis is using the flight position for the mask-weighting calculation.
======================================================================
BAT GRB EVENT DATA PROCESSING REPORT
Process Script Ver: batgrbproduct v2.46
Process Start Time: Sat May 9 19:17:58 EDT 2015
Host Name: bat1
Current Working Dir: /local/data/bat1/alien/Swift_3rdBATcatalog/event/batevent_reproc/trigger311658
======================================================================
Trigger: 00311658 Segment: 000
BAT Trigger Time: 232524076.608 [s; MET]
Trigger Stop: 232524078.656 [s; MET]
UTC: 2008-05-15T06:01:13.816640 [includes UTCF correction]
Where From?: TDRSS position message
BAT
RA: 3.15011728837097 Dec: 32.5992622180551 [deg; J2000]
Catalogged Source?: NO
Point Source?: YES
GRB Indicated?: YES [ by BAT flight software ]
Image S/N Ratio: 7.05
Image Trigger?: NO
Rate S/N Ratio: 8.42614977317636 [ if not an image trigger ]
Image S/N Ratio: 7.05
Analysis Position: [ source = BAT ]
RA: 3.15011728837097 Dec: 32.5992622180551 [deg; J2000]
Refined Position: [ source = BAT pre-slew burst ]
RA: 3.15220425090615 Dec: 32.5706458056816 [deg; J2000]
{ 00h 12m 36.5s , +32d 34' 14.3" }
+/- 1.74700591442696 [arcmin] (estimated 90% radius based on SNR)
+/- 0.822886380843991 [arcmin] (formal 1-sigma fit error)
SNR: 13.7082986731747
Angular difference between the analysis and refined position is 1.720223 arcmin
Partial Coding Fraction: 0.08496094 [ including projection effects ]
Duration
T90: 20.8639999628067 +/- 5.16681102919937
Measured from: -6
to: 14.8639999628067 [s; relative to TRIGTIME]
T50: 7.59999996423721 +/- 3.04542675300362
Measured from: -0.816000014543533
to: 6.78399994969368 [s; relative to TRIGTIME]
Fluence
Peak Flux (peak 1 second)
Measured from: 0.868000000715256
to: 1.86800000071526 [s; relative to TRIGTIME]
Total Fluence
Measured from: -10.6400000154972
to: 17.0879999995232 [s; relative to TRIGTIME]
Band 1 Band 2 Band 3 Band 4
15-25 25-50 50-100 100-350 keV
Total 1.643608 2.111479 0.611359 0.037248
0.117818 0.126125 0.116763 0.115770 [error]
Peak 0.128916 0.160569 0.069305 0.015324
0.025113 0.026514 0.024652 0.021441 [error]
[ fluence units of on-axis counts / fully illuminated detector ]
======================================================================
====== Table of the duration information =============================
Value tstart tstop
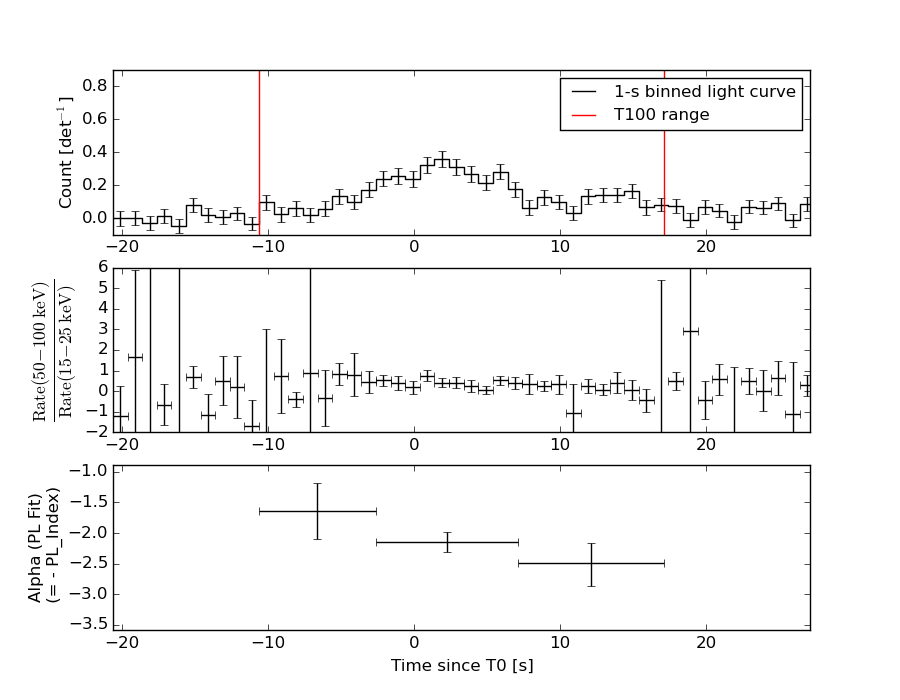
T100 27.728 -10.640 17.088
T90 20.864 -6.000 14.864
T50 7.600 -0.816 6.784
Peak 1.000 0.868 1.868
====== Spectral Analysis Summary =====================================
Model : spectral model: simple power-law (PL) and cutoff power-law (CPL)
Ph_index : photon index: E^{Ph_index}
Ph_90err : 90% error of the photon index
Epeak : Epeak in keV
Epeak_90err: 90% error of Epeak
Norm : normalization at 50 keV in both the PL model and CPL model
Nomr_90err : 90% error of the normalization
chi2 : Chi-Squared
dof : degree of freedo
=== Time-averaged spectral analysis ===
(Best model with acceptable fit: PL)
Model Ph_index Ph_90err_low Ph_90err_hi Epeak Epeak_90err_low Epeak_90err_hi Norm Nomr_90err_low Norm_90err_hi chi2 dof
PL -2.191 -0.159 0.151 - - - 9.91e-03 -1.09e-03 1.07e-03 62.960 57
CPL -0.394 -0.955 1.188 33.465 -6.170 4.634 1.24e-01 -1.24e-01 5.55e-01 50.280 56
=== 1-s peak spectral analysis ===
(Best model with acceptable fit: PL)
Model Ph_index Ph_90err_low Ph_90err_hi Epeak Epeak_90err_low Epeak_90err_hi Norm Nomr_90err_low Norm_90err_hi chi2 dof
PL -2.024 -0.410 0.360 - - - 2.25e-02 -6.11e-03 5.81e-03 44.390 57
CPL -1.821 -0.301 2.416 35.661 N/A N/A 2.98e-02 N/A N/A 44.330 56
=== Fluence/Peak Flux Summary ===
Model Band1 Band2 Band3 Band4 Band5 Total
15-25 25-50 50-100 100-350 15-150 15-350 keV
Fluence PL 6.74e-07 8.16e-07 7.15e-07 1.07e-06 2.58e-06 3.28e-06 erg/cm2
90%_error_low -7.17e-08 -6.67e-08 -1.05e-07 -2.79e-07 -2.44e-07 -4.18e-07 erg/cm2
90%_error_hi 7.30e-08 6.66e-08 1.09e-07 3.39e-07 2.49e-07 4.62e-07 erg/cm2
Peak flux PL 1.54e+00 1.14e+00 5.59e-01 3.91e-01 3.42e+00 3.62e+00 ph/cm2/s
90%_error_low -4.13e-01 -2.29e-01 -1.92e-01 -2.07e-01 -6.79e-01 -7.32e-01 ph/cm2/s
90%_error_hi 4.32e-01 2.28e-01 1.97e-01 3.08e-01 6.79e-01 7.36e-01 ph/cm2/s
Fluence CPL N/A N/A N/A N/A N/A N/A erg/cm2
90%_error_low -7.17e-08 -6.67e-08 -1.05e-07 -2.79e-07 -2.44e-07 -4.18e-07 erg/cm2
90%_error_hi 7.30e-08 6.66e-08 1.09e-07 3.39e-07 2.49e-07 4.62e-07 erg/cm2
Peak flux CPL N/A N/A N/A N/A N/A N/A ph/cm2/s
90%_error_low -4.13e-01 -2.29e-01 -1.92e-01 -2.07e-01 -6.79e-01 -7.32e-01 ph/cm2/s
90%_error_hi 4.32e-01 2.28e-01 1.97e-01 3.08e-01 6.79e-01 7.36e-01 ph/cm2/s
======================================================================
Image
Pre-slew 15.0-350.0 keV image (Event data)
#   RAcent    DECcent   POSerr    Theta     Phi              Peak Cts       SNR   Name
    3.1522    32.5706   0.0140    41.6303   -69.8356         4.6458368     13.708 TRIG_00311658

Foreground time interval of the image:
-10.640  17.088 (delta_t =  27.728 [sec])
Background time interval of the image:
-60.608 -10.640 (delta_t =  49.968 [sec])
Light Curves
Note: The mask-weighted lightcurves have units of either count/det or counts/sec/det, where a det is 0.4 x 0.4 = 0.16 sq cm.
Full-time range; 1 s binning
Other quick-look light curves:
- 64 ms binning (zoomed)
- 16 ms binning (zoomed)
- 8 ms binning (zoomed)
- 2 ms binning (zoomed)
- SN=5 or 10 s binning (full-time range)
- Raw light curve
Spectra
- 64 ms binning (zoomed)
- 16 ms binning (zoomed)
- 8 ms binning (zoomed)
- 2 ms binning (zoomed)
- SN=5 or 10 s binning (full-time range)
- Raw light curve
Spectra
Notes:
- 1) The fitting includes the systematic errors.
- 2) When the burst includes telescope slew time periods, the fitting uses an average response file made from multiple 5-s response files through out the slew time plus single time preiod for the non-slew times, and weighted by the total counts in the corresponding time period using addrmf. An average response file is needed becuase a spectral fit using the pre-slew DRM will introduce some errors in both a spectral shape and a normalization if the PHA file contains a lot of the slew/post-slew time interval.
- 3) For fits to more complicated models (e.g. a power-law over a cutoff power-law), the BAT team has decided to require a chi-square improvement of more than 6 for each extra dof.
Time averaged spectrum fit using the average DRM
Power-law model
Time interval is from  -10.640 sec. to   17.088 sec.

Spectral model in power-law:
------------------------------------------------------------
Parameters  : value       lower 90%   higher 90%
Photon index: -2.1909     ( -0.158906   0.151425 )
Norm@50keV  : 9.90969E-03    ( -0.00108751   0.00107329 )
------------------------------------------------------------
#Fit statistic : Chi-Squared =          62.96 using 59 PHA bins.
# Reduced chi-squared =          1.104 for     57 degrees of freedom
# Null hypothesis probability =   2.737814e-01

Photon flux (15-150 keV)    in 27.73 sec: 1.63293 ( -0.12972  0.12975 ) ph/cm2/s
Energy fluence (15-150 keV)             : 2.58089e-06 ( -2.44316e-07  2.49326e-07 ) ergs/cm2
Cutoff power-law model
Time interval is from  -10.640 sec. to   17.088 sec.
Spectral model in the cutoff power-law:
------------------------------------------------------------
Parameters  : value       lower 90%   higher 90%
Photon index: -0.394127     ( -0.955561   1.18758 )
Epeak [keV] : 33.4651      ( -6.17062 4.63385 )
Norm@50keV  : 0.123525    ( -0.123568   0.554638 )
------------------------------------------------------------
#Fit statistic : Chi-Squared =          50.28 using 59 PHA bins.
# Reduced chi-squared =         0.8979 for     56 degrees of freedom
# Null hypothesis probability =   6.901307e-01

Photon flux (15-150 keV)    in 27.73 sec: 1.53113 ( -0.13655  0.13751 ) ph/cm2/s
Energy fluence (15-150 keV)             : 0 ( 0  0 ) ergs/cm2
1-s peak spectrum fit
Power-law model
Time interval is from    0.868 sec. to    1.868 sec.

Spectral model in power-law:
------------------------------------------------------------
Parameters  : value       lower 90%   higher 90%
Photon index: -2.02448     ( -0.409815   0.359672 )
Norm@50keV  : 2.25215E-02    ( -0.00611301   0.00581383 )
------------------------------------------------------------
#Fit statistic : Chi-Squared =          44.39 using 59 PHA bins.
# Reduced chi-squared =         0.7787 for     57 degrees of freedom
# Null hypothesis probability =   8.884304e-01

Photon flux (15-150 keV)    in 1 sec: 3.41709 ( -0.67917  0.67917 ) ph/cm2/s
Energy fluence (15-150 keV)             : 2.08022e-07 ( -5.06708e-08  5.25994e-08 ) ergs/cm2
Cutoff power-law model
Time interval is from    0.868 sec. to    1.868 sec.
Spectral model in the cutoff power-law:
------------------------------------------------------------
Parameters  : value       lower 90%   higher 90%
Photon index: -1.82096     ( -0.303179   2.41434 )
Epeak [keV] : 35.6613      (   )
Norm@50keV  : 2.97900E-02    (     )
------------------------------------------------------------
#Fit statistic : Chi-Squared =          44.33 using 59 PHA bins.
# Reduced chi-squared =         0.7916 for     56 degrees of freedom
# Null hypothesis probability =   8.699873e-01

Photon flux (15-150 keV)    in 1 sec:  (    ) ph/cm2/s
Energy fluence (15-150 keV)             : 0 ( 0  0 ) ergs/cm2
Time-resolved spectra
Distribution
T90 vs. Hardness ratio plot
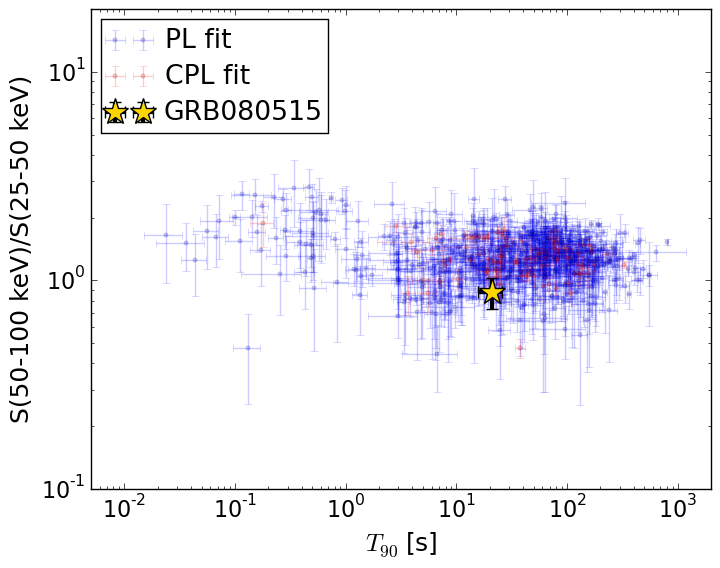
T90                                   = 20.864 sec.
Hardness ratio (energy fluence ratio) = 0.876092377212
S(15-50 keV) vs. S(50-150 keV) plot
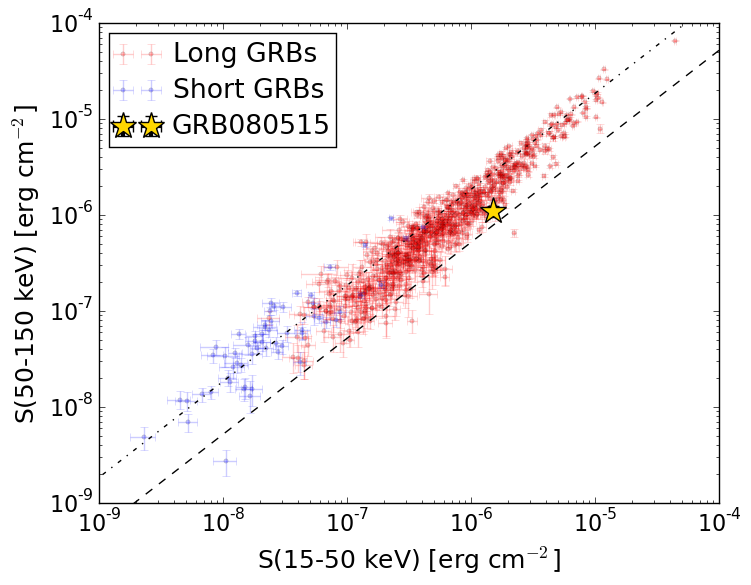
S(15-50 keV)  = 1.4900036e-06
S(50-150 keV) = 1.0909384e-06
The dash-dotted line and the dashed line traces the fluences calculated from the Band function with Epeak = 15 and 150 keV, respectively. Both lines assume a canonical values of alpha = -1 and beta = -2.5.
Mask shadow pattern
IMX = 3.063780646226157E-01, IMY = 8.343104835587968E-01
Spacecraft aspect plot
Bright source in the pre-burst/pre-slew/post-slew images
Pre-burst image of 15-350 keV band
Time interval of the image:
-60.608000 -10.640000

# RAcent  DECcent POSerr Theta    Phi  PeakCts   SNR AngSep     Name
#  [deg]    [deg]    ['] [deg]  [deg]                   [']
288.8315  10.9131    3.7  39.1   57.6   0.7803   3.1    2.8	GRS 1915+105
299.5614  35.1686    0.8  13.2   67.2   1.2512  14.4    2.4	Cyg X-1
308.2873  41.0209    4.2   4.5   50.0   0.2371   2.7    9.0	Cyg X-3
326.1695  38.4728    5.9  12.9  -43.6   0.1747   2.0    9.1	Cyg X-2
266.2364  34.5228    2.9  35.6  110.2   0.7914   4.0 ------	UNKNOWN
 55.1677  72.5245    2.5  51.5 -136.8   2.2202   4.6 ------	UNKNOWN
Pre-slew background subtracted image of 15-350 keV band
Time interval of the image:
-10.640000 17.088000

# RAcent  DECcent POSerr Theta    Phi  PeakCts   SNR AngSep     Name
#  [deg]    [deg]    ['] [deg]  [deg]                   [']
288.8168  10.9391  808.5  39.1   57.6  -0.0029  -0.0    1.2	GRS 1915+105
299.5894  35.2639    3.0  13.1   67.4   0.3146   3.9    3.7	Cyg X-1
308.2918  41.0131    6.7   4.5   49.9  -0.1313  -1.7    9.0	Cyg X-3
326.0529  38.1501    8.9  13.1  -42.2   0.1024   1.3   11.7	Cyg X-2
  3.1522  32.5706    0.9  41.6  -69.8   4.6475  13.4 ------	UNKNOWN
Post-slew image of 15-350 keV band
Time interval of the image:
408.692600 962.479700

# RAcent  DECcent POSerr Theta    Phi  PeakCts   SNR AngSep     Name
#  [deg]    [deg]    ['] [deg]  [deg]                   [']
135.5172 -40.5552    1.3  54.3    1.2  10.5726   8.9    0.5	Vela X-1
170.4433 -60.6023    6.6  44.0   37.9   1.6259   1.8    4.0	Cen X-3
186.5133 -62.7529    5.9  44.2   49.2   2.6096   2.0    4.1	GX 301-2
181.6077 -65.4801    2.5  41.0   47.2   3.7067   4.6 ------	UNKNOWN
354.1833 -42.5534    2.5  35.8 -171.5   1.8333   4.7 ------	UNKNOWN
 43.3470 -58.3822    3.1  13.1  -98.3   1.2377   3.7 ------	UNKNOWN
 70.6287 -58.2760    2.8  18.6  -48.1   1.2598   4.1 ------	UNKNOWN
116.5239 -42.7869    2.7  46.3  -14.4   2.5637   4.3 ------	UNKNOWN
 17.5131 -21.6902    6.8  51.0 -135.5   2.9995   1.7 ------	UNKNOWN