Analysis Summary
Notes:
- 1) No attempt has been made to eliminate the non-significant decimal places.
- 2) This batgrbproduct analysis is done using the HEASARC data.
- 3) This batgrbproduct analysis is using the flight position for the mask-weighting calculation.
======================================================================
BAT GRB EVENT DATA PROCESSING REPORT
Process Script Ver: batgrbproduct v2.46
Process Start Time: Mon Jan 20 02:04:31 EST 2014
Host Name: batevent1
Current Working Dir: /local/data/batevent/batevent_reproc/trigger311762
======================================================================
Trigger: 00311762 Segment: 000
BAT Trigger Time: 232589829.824 [s; MET]
Trigger Stop: 232589830.336 [s; MET]
UTC: 2008-05-16T00:17:07.030760 [includes UTCF correction]
Where From?: TDRSS position message
BAT
RA: 120.629533847551 Dec: -26.1760175623149 [deg; J2000]
Catalogged Source?: NO
Point Source?: YES
GRB Indicated?: YES [ by BAT flight software ]
Image S/N Ratio: 8.61
Image Trigger?: NO
Rate S/N Ratio: 15.0665191733194 [ if not an image trigger ]
Image S/N Ratio: 8.61
Analysis Position: [ source = BAT ]
RA: 120.629533847551 Dec: -26.1760175623149 [deg; J2000]
Refined Position: [ source = BAT pre-slew burst ]
RA: 120.661366398219 Dec: -26.1488751984184 [deg; J2000]
{ 08h 02m 38.7s , -26d 08' 56.0" }
+/- 2.17010907859261 [arcmin] (estimated 90% radius based on SNR)
+/- 1.21551020393041 [arcmin] (formal 1-sigma fit error)
SNR: 10.0561196413796
Angular difference between the analysis and refined position is 2.364505 arcmin
Partial Coding Fraction: 0.3828125 [ including projection effects ]
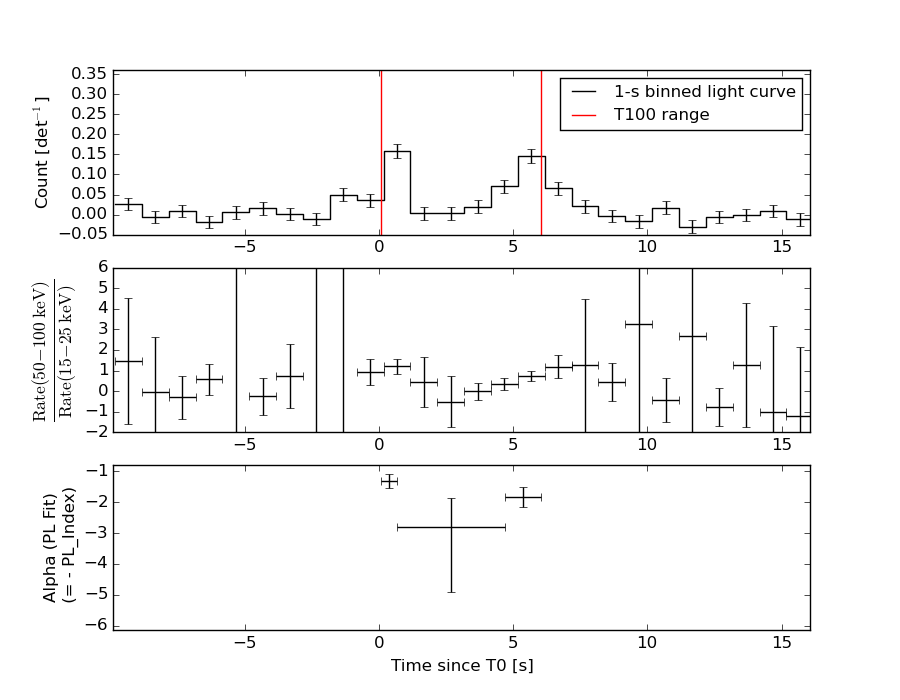
Duration
T90: 5.76400002837181 +/- 0.223212908197741
Measured from: 0.15599998831749
to: 5.9200000166893 [s; relative to TRIGTIME]
T50: 5.0160000026226 +/- 0.415716250511535
Measured from: 0.444000005722046
to: 5.46000000834465 [s; relative to TRIGTIME]
Fluence
Peak Flux (peak 1 second)
Measured from: 0.0519999861717224
to: 1.05199998617172 [s; relative to TRIGTIME]
Total Fluence
Measured from: 0.0839999914169312
to: 6.05599999427795 [s; relative to TRIGTIME]
Band 1 Band 2 Band 3 Band 4
15-25 25-50 50-100 100-350 keV
Total 0.142337 0.167476 0.096463 0.016133
0.021073 0.022218 0.019634 0.016992 [error]
Peak 0.041052 0.080558 0.057517 0.010654
0.009324 0.010127 0.008997 0.007418 [error]
[ fluence units of on-axis counts / fully illuminated detector ]
======================================================================
====== Table of the duration information =============================
Value tstart tstop
T100 5.972 0.084 6.056
T90 5.764 0.156 5.920
T50 5.016 0.444 5.460
Peak 1.000 0.052 1.052
====== Spectral Analysis Summary =====================================
Model : spectral model: simple power-law (PL) and cutoff power-law (CPL)
Ph_index : photon index: E^{Ph_index}
Ph_90err : 90% error of the photon index
Epeak : Epeak in keV
Epeak_90err: 90% error of Epeak
Norm : normalization at 50 keV in both the PL model and CPL model
Nomr_90err : 90% error of the normalization
chi2 : Chi-Squared
dof : degree of freedo
=== Time-averaged spectral analysis ===
(Best model with acceptable fit: PL)
Model Ph_index Ph_90err_low Ph_90err_hi Epeak Epeak_90err_low Epeak_90err_hi Norm Nomr_90err_low Norm_90err_hi chi2 dof
PL -1.820 -0.271 0.255 - - - 4.86e-03 -8.18e-04 7.94e-04 59.140 57
CPL -1.557 -0.700 1.188 76.567 -76.355 -76.567 6.78e-03 N/A N/A 58.930 56
=== 1-s peak spectral analysis ===
(Best model with acceptable fit: PL)
Model Ph_index Ph_90err_low Ph_90err_hi Epeak Epeak_90err_low Epeak_90err_hi Norm Nomr_90err_low Norm_90err_hi chi2 dof
PL -1.457 -0.232 0.231 - - - 1.37e-02 -2.02e-03 2.01e-03 63.890 57
CPL -0.268 -1.066 1.454 71.259 -18.082 164.643 5.64e-02 -5.64e-02 2.58e-01 60.190 56
=== Fluence/Peak Flux Summary ===
Model Band1 Band2 Band3 Band4 Band5 Total
15-25 25-50 50-100 100-350 15-150 15-350 keV
Fluence PL 5.01e-08 7.58e-08 8.59e-08 1.85e-07 2.67e-07 3.97e-07 erg/cm2
90%_error_low -1.05e-08 -1.08e-08 -1.93e-08 -7.26e-08 -4.47e-08 -9.46e-08 erg/cm2
90%_error_hi 1.10e-08 1.08e-08 1.94e-08 9.77e-08 4.55e-08 1.14e-07 erg/cm2
Peak flux PL 5.43e-01 5.60e-01 4.08e-01 4.78e-01 1.70e+00 1.99e+00 ph/cm2/s
90%_error_low -1.28e-01 -8.83e-02 -7.19e-02 -1.48e-01 -2.52e-01 -2.92e-01 ph/cm2/s
90%_error_hi 1.36e-01 8.74e-02 7.12e-02 1.82e-01 2.53e-01 2.93e-01 ph/cm2/s
Fluence CPL 4.87e-08 7.84e-08 8.64e-08 1.19e-07 2.61e-07 3.32e-07 erg/cm2
90%_error_low -1.21e-08 -1.29e-08 -2.04e-08 -9.37e-08 -4.97e-08 -1.10e-07 erg/cm2
90%_error_hi 1.21e-08 1.48e-08 2.05e-08 1.27e-07 4.49e-08 1.12e-07 erg/cm2
Peak flux CPL 4.47e-01 6.31e-01 4.45e-01 1.56e-01 1.64e+00 1.68e+00 ph/cm2/s
90%_error_low -1.50e-01 -1.12e-01 -8.60e-02 -1.06e-01 -2.60e-01 -2.85e-01 ph/cm2/s
90%_error_hi 1.59e-01 1.19e-01 8.73e-02 2.67e-01 2.59e-01 3.33e-01 ph/cm2/s
======================================================================
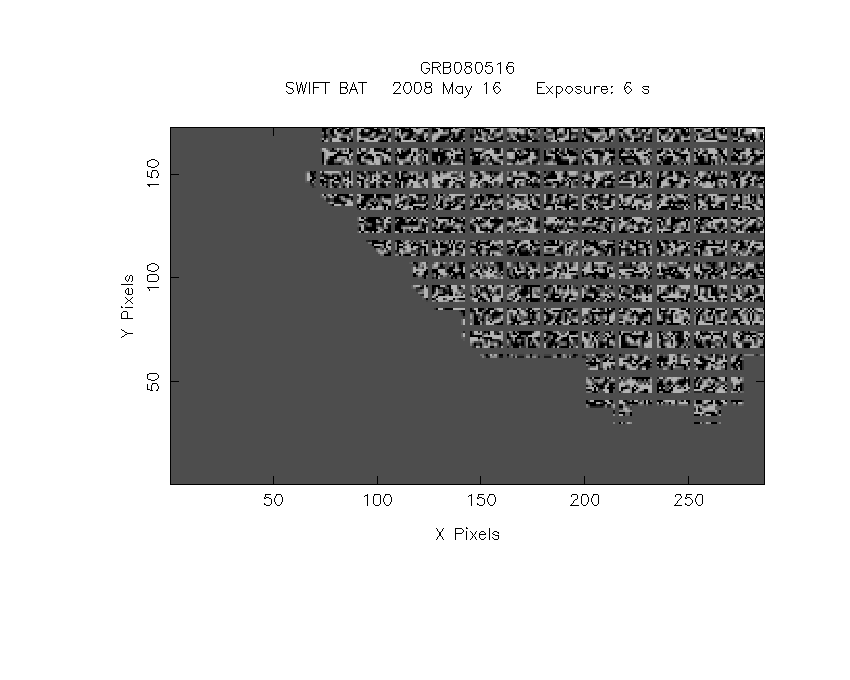
Image
Pre-slew 15.0-350.0 keV image (Event data)
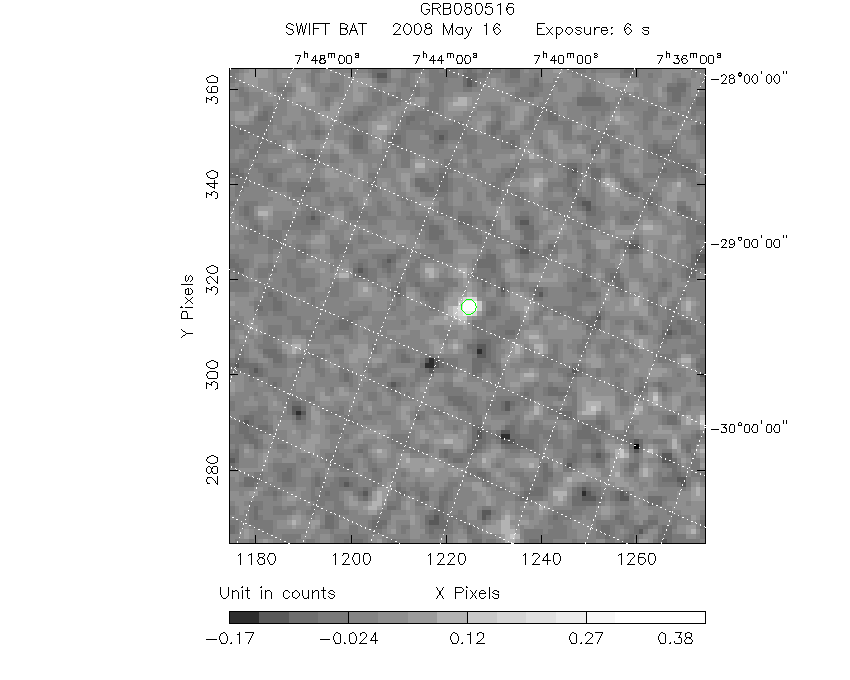
#   RAcent    DECcent   POSerr    Theta     Phi              Peak Cts       SNR   Name
  120.6614   -26.1489   0.0191    38.7053   154.8100         0.4024027     10.056 TRIG_00311762

Foreground time interval of the image:
  0.084   6.056 (delta_t =   5.972 [sec])
Background time interval of the image:
-239.824 -65.655 (delta_t = 174.169 [sec])
-64.824   0.084 (delta_t =  64.908 [sec])
Light Curves
Note: The mask-weighted lightcurves have units of either count/det or counts/sec/det, where a det is 0.4 x 0.4 = 0.16 sq cm.
Full-time range; 1 s binning
Other quick-look light curves:
- 64 ms binning (zoomed)
- 16 ms binning (zoomed)
- 8 ms binning (zoomed)
- 2 ms binning (zoomed)
- SN=5 or 10 s binning (full-time range)
- Raw light curve
Spectra
- 64 ms binning (zoomed)
- 16 ms binning (zoomed)
- 8 ms binning (zoomed)
- 2 ms binning (zoomed)
- SN=5 or 10 s binning (full-time range)
- Raw light curve
Spectra
Notes:
- 1) The fitting includes the systematic errors.
- 2) When the burst includes telescope slew time periods, the fitting uses an average response file made from multiple 5-s response files through out the slew time plus single time preiod for the non-slew times, and weighted by the total counts in the corresponding time period using addrmf. An average response file is needed becuase a spectral fit using the pre-slew DRM will introduce some errors in both a spectral shape and a normalization if the PHA file contains a lot of the slew/post-slew time interval.
- 3) For fits to more complicated models (e.g. a power-law over a cutoff power-law), the BAT team has decided to require a chi-square improvement of more than 6 for each extra dof.
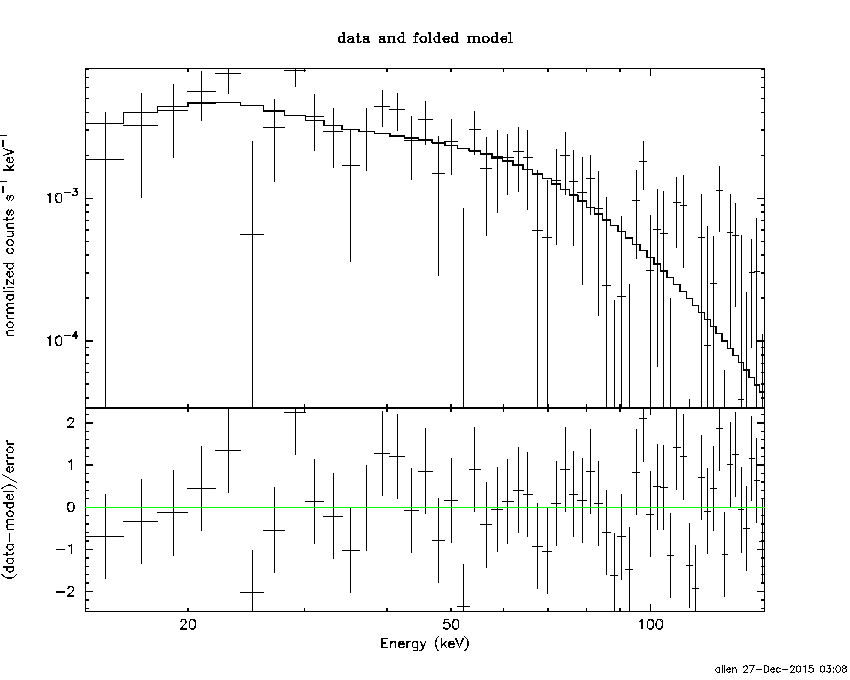
Time averaged spectrum fit using the average DRM
Power-law model
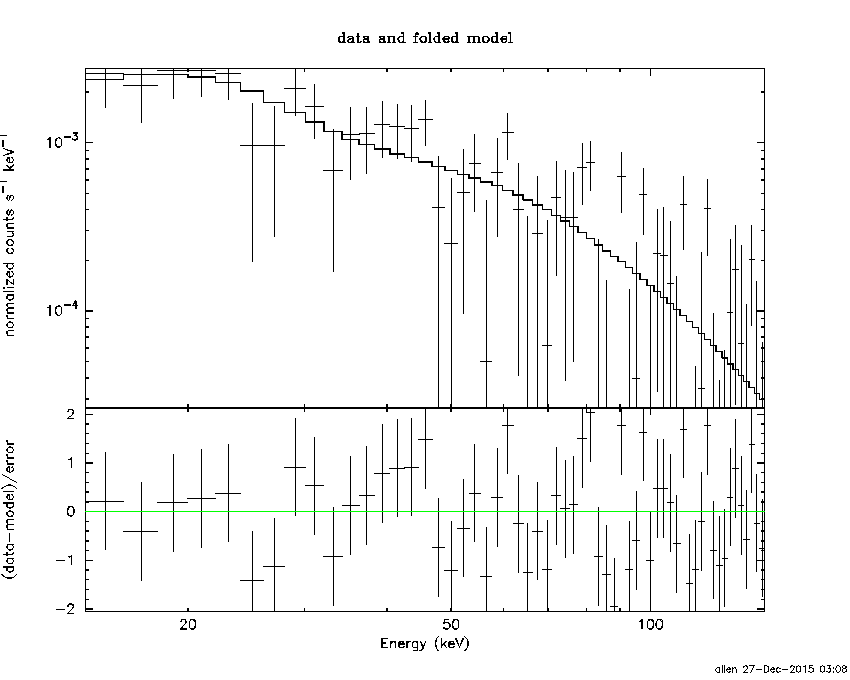
Time interval is from    0.084 sec. to    6.056 sec.

Spectral model in power-law:
------------------------------------------------------------
Parameters  : value       lower 90%   higher 90%
Photon index: -1.82046     ( -0.270577   0.254713 )
Norm@50keV  : 4.86370E-03    ( -0.000818354   0.000794245 )
------------------------------------------------------------
#Fit statistic : Chi-Squared =          59.14 using 59 PHA bins.
# Reduced chi-squared =          1.038 for     57 degrees of freedom
# Null hypothesis probability =   3.973626e-01

Photon flux (15-150 keV)    in 5.972 sec: 0.675633 ( -0.096911  0.096973 ) ph/cm2/s
Energy fluence (15-150 keV)             : 2.67276e-07 ( -4.46784e-08  4.55409e-08 ) ergs/cm2
Cutoff power-law model
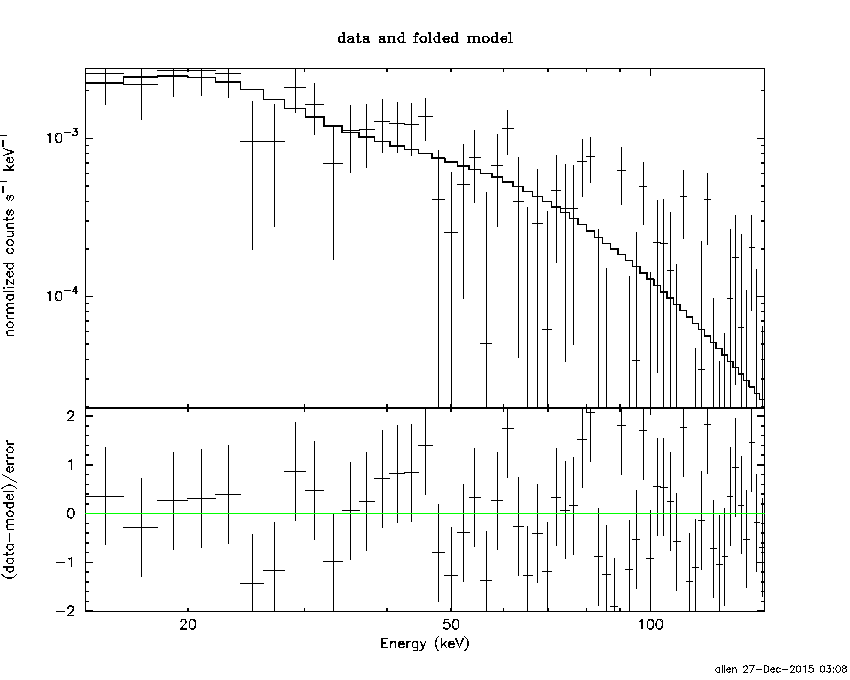
Time interval is from    0.084 sec. to    6.056 sec.
Spectral model in the cutoff power-law:
------------------------------------------------------------
Parameters  : value       lower 90%   higher 90%
Photon index: -1.55746     ( -0.699755   1.18775 )
Epeak [keV] : 76.5675      ( -76.3549 -76.5674 )
Norm@50keV  : 6.77900E-03    (     )
------------------------------------------------------------
#Fit statistic : Chi-Squared =          58.93 using 59 PHA bins.
# Reduced chi-squared =          1.052 for     56 degrees of freedom
# Null hypothesis probability =   3.687305e-01

Photon flux (15-150 keV)    in 5.972 sec: 0.669122 ( -0.10035  0.099786 ) ph/cm2/s
Energy fluence (15-150 keV)             : 2.61331e-07 ( -4.96944e-08  4.48939e-08 ) ergs/cm2
1-s peak spectrum fit
Power-law model
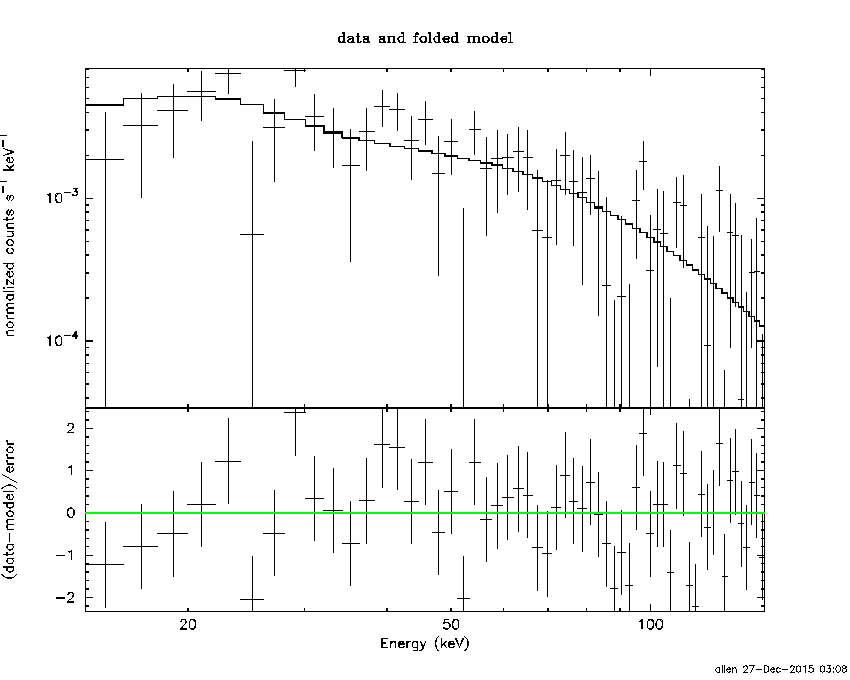
Time interval is from    0.052 sec. to    1.052 sec.

Spectral model in power-law:
------------------------------------------------------------
Parameters  : value       lower 90%   higher 90%
Photon index: -1.45682     ( -0.231912   0.23077 )
Norm@50keV  : 1.37446E-02    ( -0.00202049   0.00201417 )
------------------------------------------------------------
#Fit statistic : Chi-Squared =          63.89 using 59 PHA bins.
# Reduced chi-squared =          1.121 for     57 degrees of freedom
# Null hypothesis probability =   2.473386e-01

Photon flux (15-150 keV)    in 1 sec: 1.69674 ( -0.25191  0.2525 ) ph/cm2/s
Energy fluence (15-150 keV)             : 1.3138e-07 ( -2.07533e-08  2.09376e-08 ) ergs/cm2
Cutoff power-law model
Time interval is from    0.052 sec. to    1.052 sec.
Spectral model in the cutoff power-law:
------------------------------------------------------------
Parameters  : value       lower 90%   higher 90%
Photon index: -0.267739     ( -1.06562   1.4537 )
Epeak [keV] : 71.2591      ( -18.0807 164.644 )
Norm@50keV  : 5.63819E-02    ( -0.0563855   0.258181 )
------------------------------------------------------------
#Fit statistic : Chi-Squared =          60.19 using 59 PHA bins.
# Reduced chi-squared =          1.075 for     56 degrees of freedom
# Null hypothesis probability =   3.267838e-01

Photon flux (15-150 keV)    in 1 sec: 1.63690 ( -0.25958  0.25937 ) ph/cm2/s
Energy fluence (15-150 keV)             : 1.21593e-07 ( -2.28992e-08  2.31575e-08 ) ergs/cm2
Time-resolved spectra
Distribution
T90 vs. Hardness ratio plot
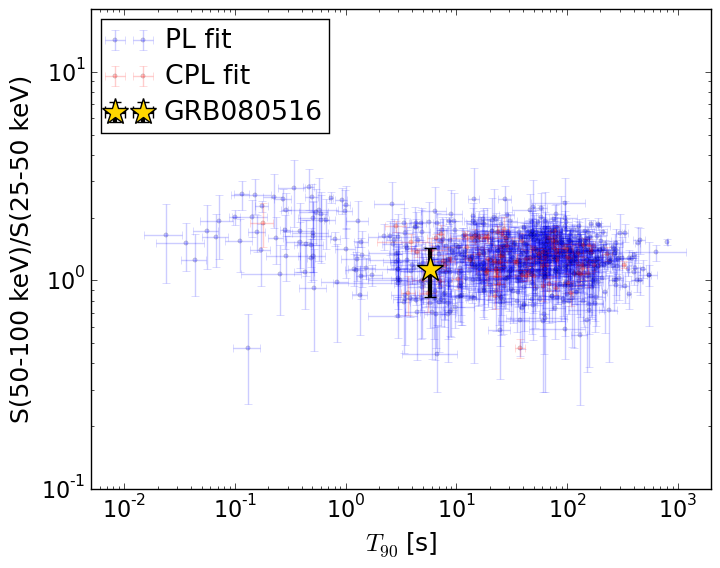
T90                                   = 5.764 sec.
Hardness ratio (energy fluence ratio) = 1.13255690111
S(15-50 keV) vs. S(50-150 keV) plot
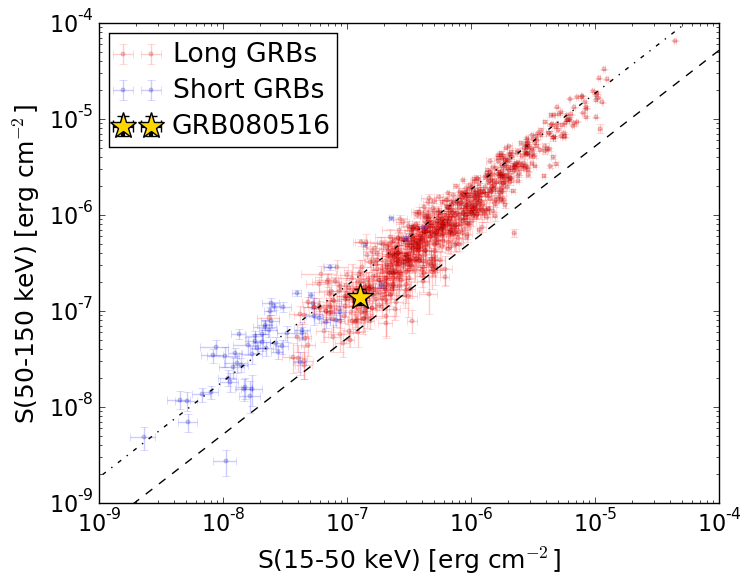
S(15-50 keV)  = 1.2597445e-07
S(50-150 keV) = 1.4129744e-07
The dash-dotted line and the dashed line traces the fluences calculated from the Band function with Epeak = 15 and 150 keV, respectively. Both lines assume a canonical values of alpha = -1 and beta = -2.5.
Mask shadow pattern
IMX = -7.251013151863204E-01, IMY = -3.410517312909804E-01
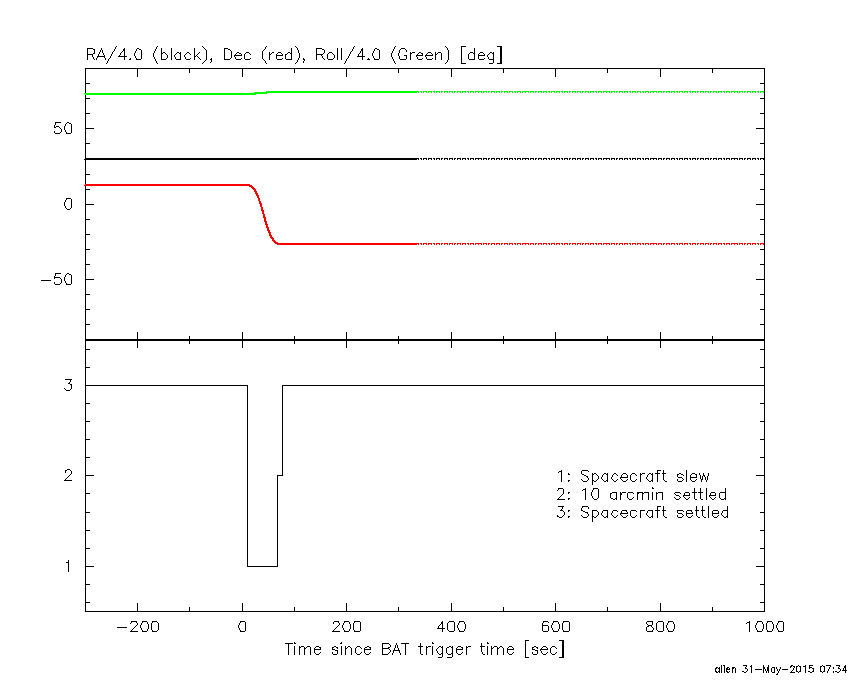
Spacecraft aspect plot
Bright source in the pre-burst/pre-slew/post-slew images
Pre-burst image of 15-350 keV band
Time interval of the image:
-239.824000 -65.654800
-64.824000 0.084000

# RAcent  DECcent POSerr Theta    Phi  PeakCts   SNR AngSep     Name
#  [deg]    [deg]    ['] [deg]  [deg]                   [']
 83.6305  22.0240    0.5  35.0  -92.2  10.4337  24.3    0.6	Crab
158.9303  18.7139    2.8  38.8   52.8   1.7250   4.2 ------	UNKNOWN
164.9035  57.4247    3.2  56.7    4.7   3.7985   3.6 ------	UNKNOWN
108.9960  -1.6591    2.9  17.3 -167.1   0.6223   3.9 ------	UNKNOWN
148.1573  66.5624    2.6  57.4   -9.6   3.5508   4.3 ------	UNKNOWN
 88.1625 -28.2782    2.6  50.6 -167.0   1.8318   4.5 ------	UNKNOWN
Pre-slew background subtracted image of 15-350 keV band
Time interval of the image:
0.084000 6.056000

# RAcent  DECcent POSerr Theta    Phi  PeakCts   SNR AngSep     Name
#  [deg]    [deg]    ['] [deg]  [deg]                   [']
 83.4855  22.0936    5.5  35.2  -92.1  -0.1004  -2.1    9.5	Crab
119.1174 -31.3095    2.2  43.8  157.0   0.2815   5.3 ------	UNKNOWN
120.6613 -26.1489    1.1  38.7  154.8   0.4021  10.0 ------	UNKNOWN
Post-slew image of 15-350 keV band
Time interval of the image:
66.876610 962.274200

# RAcent  DECcent POSerr Theta    Phi  PeakCts   SNR AngSep     Name
#  [deg]    [deg]    ['] [deg]  [deg]                   [']
135.5126 -40.5765    1.1  19.0  115.9   5.4663  10.7    1.5	Vela X-1
 89.9315 -67.5319    2.3  45.4  168.6   5.3786   5.1 ------	UNKNOWN
 70.1656 -69.7376    2.8  52.3  172.4   6.6566   4.1 ------	UNKNOWN
108.4363 -46.0654    2.9  22.2  175.6   1.7083   3.9 ------	UNKNOWN
 53.7984 -66.0701    4.4  56.9  179.2   8.3807   2.7 ------	UNKNOWN
 87.6726 -41.9093    2.7  31.3 -156.0   2.2792   4.3 ------	UNKNOWN
137.7218  28.9122    2.8  57.5   -9.5  10.5551   4.1 ------	UNKNOWN
105.1478   5.7571    2.2  35.3  -54.7   3.8796   5.3 ------	UNKNOWN