Analysis Summary
Notes:
- 1) No attempt has been made to eliminate the non-significant decimal places.
- 2) This batgrbproduct analysis is done using the HEASARC data.
- 3) This batgrbproduct analysis is using the flight position for the mask-weighting calculation.
======================================================================
BAT GRB EVENT DATA PROCESSING REPORT
Process Script Ver: batgrbproduct v2.46
Process Start Time: Mon Jan 20 01:57:16 EST 2014
Host Name: batevent1
Current Working Dir: /local/data/batevent/batevent_reproc/trigger311874
======================================================================
Trigger: 00311874 Segment: 000
BAT Trigger Time: 232752174.784 [s; MET]
Trigger Stop: 232752182.976 [s; MET]
UTC: 2008-05-17T21:22:51.986120 [includes UTCF correction]
Where From?: TDRSS position message
BAT
RA: 102.254712634596 Dec: 50.7307421877239 [deg; J2000]
Catalogged Source?: NO
Point Source?: YES
GRB Indicated?: YES [ by BAT flight software ]
Image S/N Ratio: 9.81
Image Trigger?: NO
Rate S/N Ratio: 11.8321595661992 [ if not an image trigger ]
Image S/N Ratio: 9.81
Analysis Position: [ source = BAT ]
RA: 102.254712634596 Dec: 50.7307421877239 [deg; J2000]
Refined Position: [ source = BAT pre-slew burst ]
RA: 102.278442458184 Dec: 50.7460113143002 [deg; J2000]
{ 06h 49m 06.8s , +50d 44' 45.6" }
+/- 2.30377997269376 [arcmin] (estimated 90% radius based on SNR)
+/- 1.35506563531954 [arcmin] (formal 1-sigma fit error)
SNR: 9.23305717576612
Angular difference between the analysis and refined position is 1.285006 arcmin
Partial Coding Fraction: 0.5 [ including projection effects ]
Duration
T90: 64.5079999864101 +/- 22.3013869451639
Measured from: 0.543999999761581
to: 65.0519999861717 [s; relative to TRIGTIME]
T50: 25.5960000157356 +/- 18.8237293691574
Measured from: 4.53999999165535
to: 30.136000007391 [s; relative to TRIGTIME]
Fluence
Peak Flux (peak 1 second)
Measured from: 3.88400000333786
to: 4.88400000333786 [s; relative to TRIGTIME]
Total Fluence
Measured from: -0.763999998569489
to: 68.3879999816418 [s; relative to TRIGTIME]
Band 1 Band 2 Band 3 Band 4
15-25 25-50 50-100 100-350 keV
Total 0.244035 0.314499 0.306645 0.076972
0.055703 0.058259 0.052203 0.047391 [error]
Peak 0.022649 0.031192 0.016279 0.003404
0.007024 0.007344 0.006567 0.005729 [error]
[ fluence units of on-axis counts / fully illuminated detector ]
======================================================================
====== Table of the duration information =============================
Value tstart tstop
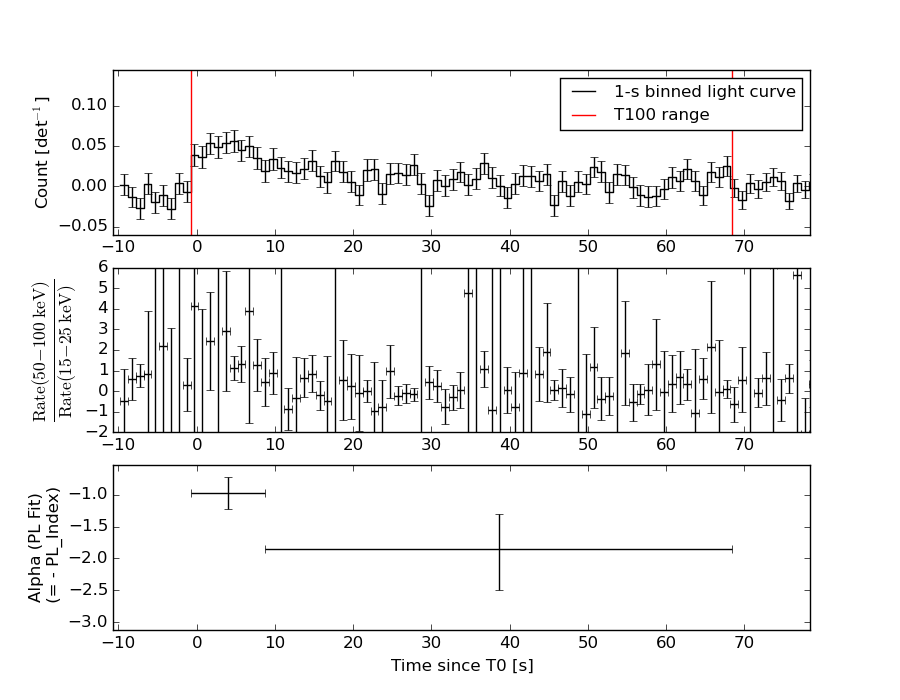
T100 69.152 -0.764 68.388
T90 64.508 0.544 65.052
T50 25.596 4.540 30.136
Peak 1.000 3.884 4.884
====== Spectral Analysis Summary =====================================
Model : spectral model: simple power-law (PL) and cutoff power-law (CPL)
Ph_index : photon index: E^{Ph_index}
Ph_90err : 90% error of the photon index
Epeak : Epeak in keV
Epeak_90err: 90% error of Epeak
Norm : normalization at 50 keV in both the PL model and CPL model
Nomr_90err : 90% error of the normalization
chi2 : Chi-Squared
dof : degree of freedo
=== Time-averaged spectral analysis ===
(Best model with acceptable fit: PL)
Model Ph_index Ph_90err_low Ph_90err_hi Epeak Epeak_90err_low Epeak_90err_hi Norm Nomr_90err_low Norm_90err_hi chi2 dof
PL -1.428 -0.320 0.317 - - - 8.83e-04 -1.67e-04 1.66e-04 54.310 57
CPL -0.817 -0.887 1.735 94.566 -41.190 -94.566 1.82e-03 -1.12e-03 1.16e-02 53.670 56
=== 1-s peak spectral analysis ===
(Best model with acceptable fit: PL)
Model Ph_index Ph_90err_low Ph_90err_hi Epeak Epeak_90err_low Epeak_90err_hi Norm Nomr_90err_low Norm_90err_hi chi2 dof
PL -1.776 -0.505 0.461 - - - 4.37e-03 -1.50e-03 1.46e-03 67.090 57
CPL 0.724 -2.431 8.127 41.402 -7.208 88.945 1.47e-01 -1.47e-01 2.31e+04 64.020 56
=== Fluence/Peak Flux Summary ===
Model Band1 Band2 Band3 Band4 Band5 Total
15-25 25-50 50-100 100-350 15-150 15-350 keV
Fluence PL 7.28e-08 1.40e-07 2.08e-07 6.66e-07 5.87e-07 1.09e-06 erg/cm2
90%_error_low -2.16e-08 -2.71e-08 -5.06e-08 -2.87e-07 -1.22e-07 -3.37e-07 erg/cm2
90%_error_hi 2.33e-08 2.67e-08 5.03e-08 4.09e-07 1.25e-07 4.38e-07 erg/cm2
Peak flux PL 2.34e-01 2.00e-01 1.17e-01 1.02e-01 5.96e-01 6.54e-01 ph/cm2/s
90%_error_low -9.01e-02 -5.84e-02 -4.90e-02 -6.26e-02 -1.74e-01 -1.94e-01 ph/cm2/s
90%_error_hi 9.65e-02 5.84e-02 5.15e-02 1.04e-01 1.74e-01 1.98e-01 ph/cm2/s
Fluence CPL 6.64e-08 1.50e-07 2.14e-07 2.74e-07 5.57e-07 7.04e-07 erg/cm2
90%_error_low -2.64e-08 -3.33e-08 -5.55e-08 -2.23e-07 -1.36e-07 -2.67e-07 erg/cm2
90%_error_hi 2.67e-08 3.58e-08 5.66e-08 6.62e-07 1.39e-07 5.25e-07 erg/cm2
Peak flux CPL 1.97e-01 2.72e-01 8.66e-02 3.31e-03 5.59e-01 5.60e-01 ph/cm2/s
90%_error_low -1.06e-01 -9.26e-02 -8.66e-02 -3.31e-03 -1.71e-01 -1.71e-01 ph/cm2/s
90%_error_hi 1.08e-01 1.03e-01 7.84e-02 8.94e-02 1.74e-01 1.77e-01 ph/cm2/s
======================================================================
Image
Pre-slew 15.0-350.0 keV image (Event data)
#   RAcent    DECcent   POSerr    Theta     Phi              Peak Cts       SNR   Name
  102.2784    50.7460   0.0208    29.1612   -68.1976         0.9886091      9.233 TRIG_00311874

Foreground time interval of the image:
 -0.764  54.517 (delta_t =  55.281 [sec])
Background time interval of the image:
-239.784  -0.764 (delta_t = 239.020 [sec])
Light Curves
Note: The mask-weighted lightcurves have units of either count/det or counts/sec/det, where a det is 0.4 x 0.4 = 0.16 sq cm.
Full-time range; 1 s binning
Other quick-look light curves:
- 64 ms binning (zoomed)
- 16 ms binning (zoomed)
- 8 ms binning (zoomed)
- 2 ms binning (zoomed)
- SN=5 or 10 s binning (full-time range)
- Raw light curve
Spectra
- 64 ms binning (zoomed)
- 16 ms binning (zoomed)
- 8 ms binning (zoomed)
- 2 ms binning (zoomed)
- SN=5 or 10 s binning (full-time range)
- Raw light curve
Spectra
Notes:
- 1) The fitting includes the systematic errors.
- 2) When the burst includes telescope slew time periods, the fitting uses an average response file made from multiple 5-s response files through out the slew time plus single time preiod for the non-slew times, and weighted by the total counts in the corresponding time period using addrmf. An average response file is needed becuase a spectral fit using the pre-slew DRM will introduce some errors in both a spectral shape and a normalization if the PHA file contains a lot of the slew/post-slew time interval.
- 3) For fits to more complicated models (e.g. a power-law over a cutoff power-law), the BAT team has decided to require a chi-square improvement of more than 6 for each extra dof.
Time averaged spectrum fit using the average DRM
Power-law model
Time interval is from   -0.764 sec. to   68.388 sec.

Spectral model in power-law:
------------------------------------------------------------
Parameters  : value       lower 90%   higher 90%
Photon index: -1.42775     ( -0.319741   0.317377 )
Norm@50keV  : 8.82617E-04    ( -0.000167269   0.000165719 )
------------------------------------------------------------
#Fit statistic : Chi-Squared =          54.31 using 59 PHA bins.
# Reduced chi-squared =         0.9528 for     57 degrees of freedom
# Null hypothesis probability =   5.765862e-01

Photon flux (15-150 keV)    in 69.15 sec: 0.108185 ( -0.0200879  0.020121 ) ph/cm2/s
Energy fluence (15-150 keV)             : 5.86573e-07 ( -1.22194e-07  1.24677e-07 ) ergs/cm2
Cutoff power-law model
Time interval is from   -0.764 sec. to   68.388 sec.
Spectral model in the cutoff power-law:
------------------------------------------------------------
Parameters  : value       lower 90%   higher 90%
Photon index: -0.816949     ( -0.887221   1.73459 )
Epeak [keV] : 94.5655      ( -41.1858 -94.5617 )
Norm@50keV  : 1.82368E-03    ( -0.00112412   0.0115822 )
------------------------------------------------------------
#Fit statistic : Chi-Squared =          53.67 using 59 PHA bins.
# Reduced chi-squared =         0.9584 for     56 degrees of freedom
# Null hypothesis probability =   5.634678e-01

Photon flux (15-150 keV)    in 69.15 sec: 0.105498 ( -0.0211112  0.020932 ) ph/cm2/s
Energy fluence (15-150 keV)             : 5.56765e-07 ( -1.35717e-07  1.39079e-07 ) ergs/cm2
1-s peak spectrum fit
Power-law model
Time interval is from    3.884 sec. to    4.884 sec.

Spectral model in power-law:
------------------------------------------------------------
Parameters  : value       lower 90%   higher 90%
Photon index: -1.77574     ( -0.50456   0.46145 )
Norm@50keV  : 4.36814E-03    ( -0.00150359   0.00146456 )
------------------------------------------------------------
#Fit statistic : Chi-Squared =          67.09 using 59 PHA bins.
# Reduced chi-squared =          1.177 for     57 degrees of freedom
# Null hypothesis probability =   1.695447e-01

Photon flux (15-150 keV)    in 1 sec: 0.596384 ( -0.173615  0.173616 ) ph/cm2/s
Energy fluence (15-150 keV)             : 4.02513e-08 ( -1.36342e-08  1.44818e-08 ) ergs/cm2
Cutoff power-law model
Time interval is from    3.884 sec. to    4.884 sec.
Spectral model in the cutoff power-law:
------------------------------------------------------------
Parameters  : value       lower 90%   higher 90%
Photon index: 0.723689     ( -2.48336   8.07501 )
Epeak [keV] : 41.4016      ( -6.91803 89.2351 )
Norm@50keV  : 0.146702    ( -0.179963   23063 )
------------------------------------------------------------
#Fit statistic : Chi-Squared =          64.02 using 59 PHA bins.
# Reduced chi-squared =          1.143 for     56 degrees of freedom
# Null hypothesis probability =   2.158029e-01

Photon flux (15-150 keV)    in 1 sec: 0.559436 ( -0.170742  0.174438 ) ph/cm2/s
Energy fluence (15-150 keV)             : 3.10249e-08 ( -1.11763e-08  1.6049e-08 ) ergs/cm2
Time-resolved spectra
Distribution
T90 vs. Hardness ratio plot
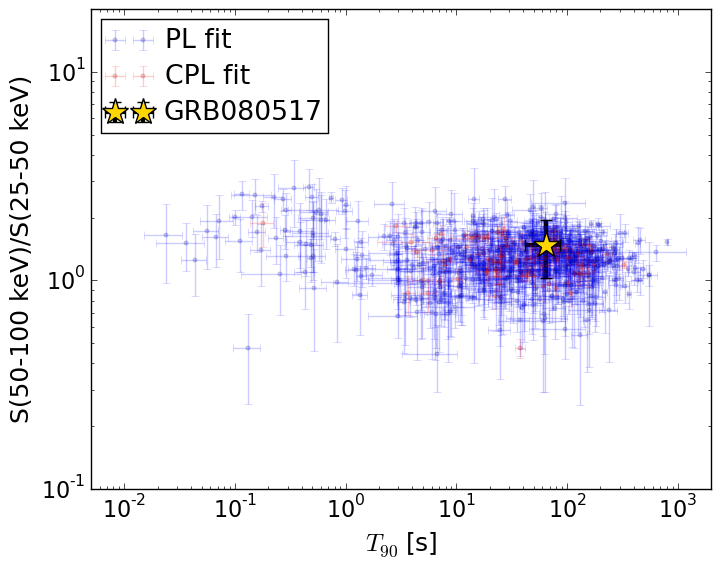
T90                                   = 64.508 sec.
Hardness ratio (energy fluence ratio) = 1.48689402047
S(15-50 keV) vs. S(50-150 keV) plot
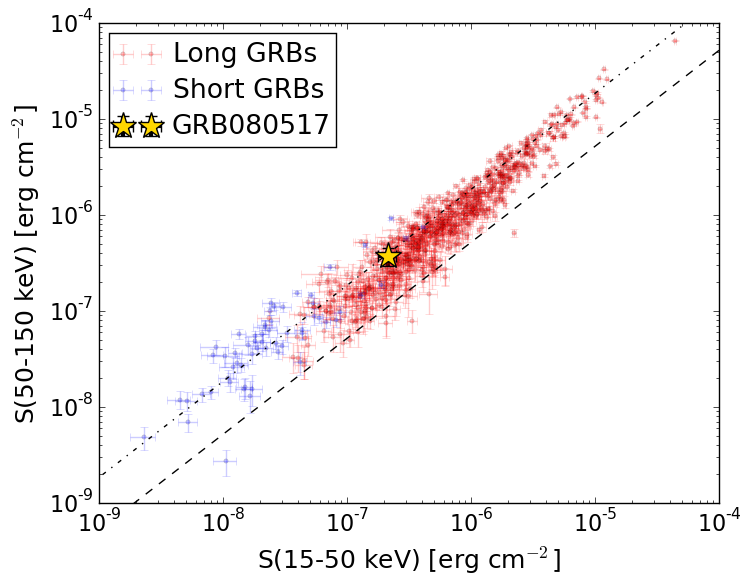
S(15-50 keV)  = 2.1271086e-07
S(50-150 keV) = 3.738644e-07
The dash-dotted line and the dashed line traces the fluences calculated from the Band function with Epeak = 15 and 150 keV, respectively. Both lines assume a canonical values of alpha = -1 and beta = -2.5.
Mask shadow pattern
IMX = 2.072424406940372E-01, IMY = 5.180804300206198E-01
Spacecraft aspect plot
Bright source in the pre-burst/pre-slew/post-slew images
Pre-burst image of 15-350 keV band
Time interval of the image:
-239.784000 -0.764000

# RAcent  DECcent POSerr Theta    Phi  PeakCts   SNR AngSep     Name
#  [deg]    [deg]    ['] [deg]  [deg]                   [']
149.6315  32.6804    2.7  11.1   78.1   0.7454   4.3 ------	UNKNOWN
125.6552  15.2709    2.4  22.2 -172.2   0.8125   4.9 ------	UNKNOWN
237.5247  77.4892    3.2  58.1   -6.6   3.7424   4.1 ------	UNKNOWN
237.7363  77.7405    3.5  58.0   -6.9   3.9758   4.3 ------	UNKNOWN
Pre-slew background subtracted image of 15-350 keV band
Time interval of the image:
-0.764000 54.516600

# RAcent  DECcent POSerr Theta    Phi  PeakCts   SNR AngSep     Name
#  [deg]    [deg]    ['] [deg]  [deg]                   [']
173.6700  18.0428    2.6  37.0   86.6   1.0559   4.4 ------	UNKNOWN
134.0828 -19.3465    2.7  54.6  161.8   1.8673   4.3 ------	UNKNOWN
189.0158  62.6614    2.4  42.2   11.6   0.6226   4.8 ------	UNKNOWN
121.1178 -14.6083    2.2  51.9  178.0   1.0905   5.1 ------	UNKNOWN
102.2785  50.7460    1.2  29.2  -68.2   0.9923   9.3 ------	UNKNOWN
354.8515  85.8788    2.8  58.1  -24.2   1.8782   4.1 ------	UNKNOWN
Post-slew image of 15-350 keV band
Time interval of the image:
109.116590 917.316600

# RAcent  DECcent POSerr Theta    Phi  PeakCts   SNR AngSep     Name
#  [deg]    [deg]    ['] [deg]  [deg]                   [']
 83.6239  22.0145    0.2  32.2 -123.8  33.6420  49.3    0.5	Crab
121.6043  -3.7240    4.5  56.9  179.2   7.6114   2.6 ------	UNKNOWN
340.2034  66.7391    3.7  54.6   -1.8   4.6975   3.1 ------	UNKNOWN
 13.4787  55.6433    2.8  49.7  -25.2   4.2904   4.2 ------	UNKNOWN