Analysis Summary
Notes:
- 1) No attempt has been made to eliminate the non-significant decimal places.
- 2) This batgrbproduct analysis is done using the HEASARC data.
- 3) This batgrbproduct analysis is using the flight position for the mask-weighting calculation.
======================================================================
                  BAT GRB EVENT DATA PROCESSING REPORT
    Process Script Ver: batgrbproduct v2.46
    Process Start Time: Mon Jan 20 01:37:28 EST 2014
             Host Name: batevent1
   Current Working Dir: /local/data/batevent/batevent_reproc/trigger312958
======================================================================

  Trigger: 00312958      Segment: 000

  BAT Trigger Time: 234063030.912   [s; MET]
      Trigger Stop: 234063032.96   [s; MET]
               UTC: 2008-06-02T01:30:28.077080    [includes UTCF correction]
       Where From?: TDRSS position message

  BAT
    RA: 19.1726774847547   Dec: -9.25077306570324  [deg; J2000]

     Catalogged Source?: NO
     Point Source?:      YES
     GRB Indicated?:     YES    [ by BAT flight software ]
     Image S/N Ratio:    8.11
     Image Trigger?:     NO
     Rate S/N Ratio:     13.3790881602597  [ if not an image trigger ]
     Image S/N Ratio:    8.11

  Analysis Position:   [ source = BAT ]
    RA: 19.1726774847547   Dec: -9.25077306570324  [deg; J2000]

  Refined Position:   [ source = BAT pre-slew burst ]
    RA: 19.1738896892608   Dec: -9.23794765140966  [deg; J2000]
        { 01h 16m 41.7s , -09d 14' 16.6" }
         +/- 1.67606817425502 [arcmin] (estimated 90% radius based on SNR)
         +/- 0.826878743819133 [arcmin] (formal 1-sigma fit error)
    SNR: 14.544597081511

  Angular difference between the analysis and refined position is 0.772866 arcmin

  Partial Coding Fraction: 0.1972656    [ including projection effects ]

  Duration
     T90: 74.2880000174046 +/- 7.14318726944463
        Measured from: -9.75600001215935
                   to: 64.5320000052452     [s; relative to TRIGTIME]
     T50: 58.9760000109673 +/- 1.19843230514097
        Measured from: 1.20800000429153
                   to: 60.1840000152588     [s; relative to TRIGTIME]


  Fluence
     Peak Flux  (peak 1 second)
        Measured from: 59.5959999859333
                   to: 60.5959999859333     [s; relative to TRIGTIME]
     Total Fluence
        Measured from: -11.4880000054836
                   to: 69.2439999878407     [s; relative to TRIGTIME]

             Band 1     Band 2     Band 3     Band 4
              15-25      25-50     50-100    100-350     keV
 Total     0.923140   1.512023   1.557406   0.445529
           0.103868   0.110691   0.105159   0.101678 [error]
 Peak      0.032527   0.110120   0.153191   0.061038
           0.007375   0.008660   0.009172   0.008094 [error]

     [ fluence units of on-axis counts / fully illuminated detector ]

======================================================================


====== Table of the duration information =============================

        Value   tstart    tstop
T100   80.732  -11.488   69.244
T90    74.288   -9.756   64.532
T50    58.976    1.208   60.184
Peak    1.000   59.596   60.596


====== Spectral Analysis Summary =====================================

Model      : spectral model: simple power-law (PL) and cutoff power-law (CPL)
Ph_index   : photon index: E^{Ph_index}
Ph_90err   : 90% error of the photon index
Epeak      : Epeak in keV
Epeak_90err: 90% error of Epeak
Norm       : normalization at 50 keV in both the PL model and CPL model
Nomr_90err : 90% error of the normalization
chi2       : Chi-Squared
dof        : degree of freedo

=== Time-averaged spectral analysis ===
(Best model with acceptable fit: PL)

Model Ph_index Ph_90err_low Ph_90err_hi  Epeak  Epeak_90err_low  Epeak_90err_hi  Norm       Nomr_90err_low    Norm_90err_hi    chi2    dof
PL      -1.277    -0.126      0.127       -           -               -         4.06e-03     -2.93e-04          2.92e-04      58.360   57
CPL     -0.844    -0.476      0.557      149.464     -54.742      -149.464      6.39e-03     -2.44e-03          4.82e-03      56.120   56


=== 1-s peak spectral analysis ===
(Best model with acceptable fit: N/A)

Model Ph_index Ph_90err_low Ph_90err_hi  Epeak  Epeak_90err_low  Epeak_90err_hi  Norm       Nomr_90err_low    Norm_90err_hi    chi2    dof
PL      -0.700     -0.129     0.134       -           -               -         2.36e-02     -1.90e-03          1.88e-03      72.470   57
CPL     -0.135     -0.526     0.609      201.335     -73.564      5096.515      4.07e-02     -1.57e-02          3.02e-02      69.100   56


=== Fluence/Peak Flux Summary ===

              Model    Band1     Band2     Band3     Band4     Band5     Total
                       15-25     25-50    50-100    100-350    15-150    15-350    keV
Fluence         PL   3.40e-07  7.16e-07  1.18e-06  4.41e-06  3.26e-06  6.65e-06   erg/cm2
      90%_error_low -4.66e-08 -6.02e-08 -1.00e-07 -7.83e-07 -2.52e-07 -8.50e-07   erg/cm2
      90%_error_hi   4.88e-08  5.97e-08  9.95e-08  8.93e-07  2.53e-07  9.40e-07   erg/cm2
Peak flux       PL   4.55e-01  7.39e-01  9.10e-01  2.21e+00  2.73e+00  4.32e+00   ph/cm2/s
      90%_error_low -7.55e-02 -7.81e-02 -6.84e-02 -3.43e-01 -2.08e-01 -3.73e-01   ph/cm2/s
      90%_error_hi   8.06e-02  7.75e-02  6.82e-02  3.85e-01  2.09e-01  3.90e-01   ph/cm2/s

Fluence        CPL   3.07e-07  7.38e-07  1.23e-06  2.57e-06  3.19e-06  4.85e-06   erg/cm2
      90%_error_low -5.86e-08 -6.65e-08 -1.17e-07 -1.11e-06 -2.68e-07 -1.13e-06   erg/cm2
      90%_error_hi   6.06e-08  6.77e-08  1.19e-07  1.88e-06  2.67e-07  2.11e-06   erg/cm2
Peak flux      CPL   3.84e-01  7.52e-01  9.76e-01  1.33e+00  2.68e+00  3.44e+00   ph/cm2/s
      90%_error_low -9.41e-02 -8.42e-02 -9.10e-02 -4.70e-01 -2.13e-01 -5.14e-01   ph/cm2/s
      90%_error_hi   1.01e-01  8.43e-02  9.25e-02  8.18e-01  2.13e-01  8.19e-01   ph/cm2/s

======================================================================
Image
Pre-slew 15.0-350.0 keV image (Event data)
#   RAcent    DECcent   POSerr    Theta     Phi              Peak Cts       SNR   Name
   19.1739    -9.2379   0.0133    51.2871    -0.8423         2.7714487     14.545 TRIG_00312958

Foreground time interval of the image:
-11.488  29.589 (delta_t =  41.077 [sec])
Background time interval of the image:
-280.411 -11.488 (delta_t = 268.923 [sec])
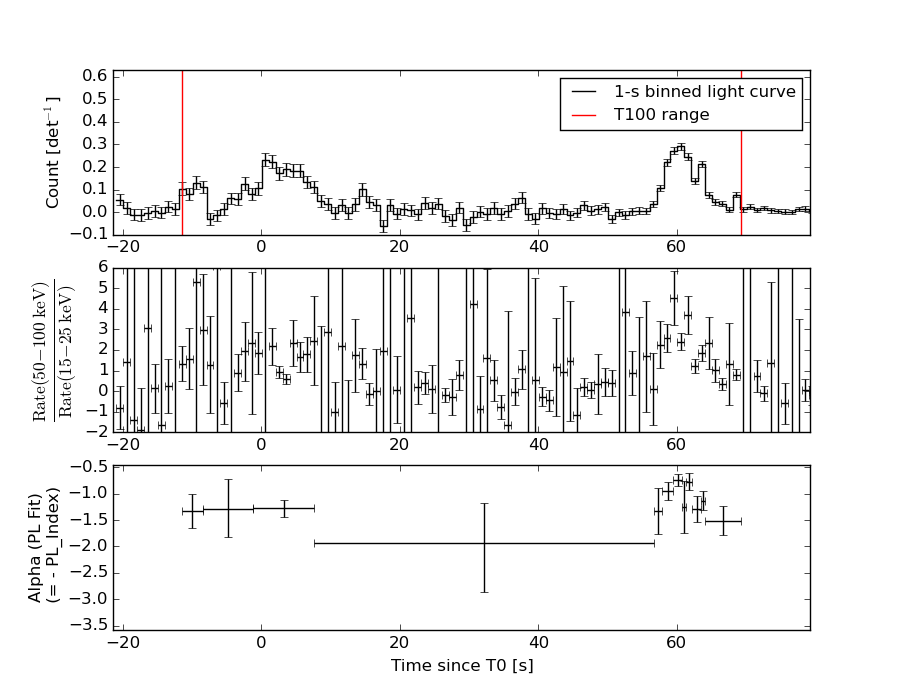
Light Curves
Note: The mask-weighted lightcurves have units of either count/det or counts/sec/det, where a det is 0.4 x 0.4 = 0.16 sq cm.
Full-time range; 1 s binning
Other quick-look light curves:
- 64 ms binning (zoomed)
- 16 ms binning (zoomed)
- 8 ms binning (zoomed)
- 2 ms binning (zoomed)
- SN=5 or 10 s binning (full-time range)
- Raw light curve
Spectra
- 64 ms binning (zoomed)
- 16 ms binning (zoomed)
- 8 ms binning (zoomed)
- 2 ms binning (zoomed)
- SN=5 or 10 s binning (full-time range)
- Raw light curve
Spectra
Notes:
- 1) The fitting includes the systematic errors.
- 2) When the burst includes telescope slew time periods, the fitting uses an average response file made from multiple 5-s response files through out the slew time plus single time preiod for the non-slew times, and weighted by the total counts in the corresponding time period using addrmf. An average response file is needed becuase a spectral fit using the pre-slew DRM will introduce some errors in both a spectral shape and a normalization if the PHA file contains a lot of the slew/post-slew time interval.
- 3) For fits to more complicated models (e.g. a power-law over a cutoff power-law), the BAT team has decided to require a chi-square improvement of more than 6 for each extra dof.
Time averaged spectrum fit using the average DRM
Power-law model
Time interval is from  -11.488 sec. to   69.244 sec.

Spectral model in power-law:
------------------------------------------------------------
Parameters  : value       lower 90%   higher 90%
Photon index: -1.27732     ( -0.126004   0.126987 )
Norm@50keV  : 4.05925E-03    ( -0.000292525   0.000292455 )
------------------------------------------------------------
#Fit statistic : Chi-Squared =          58.36 using 59 PHA bins.
# Reduced chi-squared =          1.024 for     57 degrees of freedom
# Null hypothesis probability =   4.252667e-01

Photon flux (15-150 keV)    in 80.73 sec: 0.482319 ( -0.036692  0.036803 ) ph/cm2/s
Energy fluence (15-150 keV)             : 3.25698e-06 ( -2.51907e-07  2.53085e-07 ) ergs/cm2
Cutoff power-law model
Time interval is from  -11.488 sec. to   69.244 sec.
Spectral model in the cutoff power-law:
------------------------------------------------------------
Parameters  : value       lower 90%   higher 90%
Photon index: -0.844447     ( -0.475937   0.556998 )
Epeak [keV] : 149.464      ( -54.7413 -149.464 )
Norm@50keV  : 6.39394E-03    ( -0.00243873   0.0048207 )
------------------------------------------------------------
#Fit statistic : Chi-Squared =          56.12 using 59 PHA bins.
# Reduced chi-squared =          1.002 for     56 degrees of freedom
# Null hypothesis probability =   4.705032e-01

Photon flux (15-150 keV)    in 80.73 sec: 0.472021 ( -0.038527  0.038583 ) ph/cm2/s
Energy fluence (15-150 keV)             : 3.1879e-06 ( -2.68019e-07  2.66838e-07 ) ergs/cm2
1-s peak spectrum fit
Power-law model
Time interval is from   59.596 sec. to   60.596 sec.

Spectral model in power-law:
------------------------------------------------------------
Parameters  : value       lower 90%   higher 90%
Photon index: -0.700165     ( -0.12927   0.134205 )
Norm@50keV  : 2.36289E-02    ( -0.00189881   0.00187873 )
------------------------------------------------------------
#Fit statistic : Chi-Squared =          72.47 using 59 PHA bins.
# Reduced chi-squared =          1.271 for     57 degrees of freedom
# Null hypothesis probability =   8.126769e-02

Photon flux (15-150 keV)    in 1 sec: 2.73122 ( -0.20844  0.20885 ) ph/cm2/s
Energy fluence (15-150 keV)             : 2.8843e-07 ( -2.25657e-08  2.26557e-08 ) ergs/cm2
Cutoff power-law model
Time interval is from   59.596 sec. to   60.596 sec.
Spectral model in the cutoff power-law:
------------------------------------------------------------
Parameters  : value       lower 90%   higher 90%
Photon index: -0.135258     ( -0.525537   0.608663 )
Epeak [keV] : 201.335      ( -73.5645 5096.51 )
Norm@50keV  : 4.06865E-02    ( -0.0157158   0.0302213 )
------------------------------------------------------------
#Fit statistic : Chi-Squared =          69.10 using 59 PHA bins.
# Reduced chi-squared =          1.234 for     56 degrees of freedom
# Null hypothesis probability =   1.122168e-01

Photon flux (15-150 keV)    in 1 sec: 2.68389 ( -0.21294  0.21329 ) ph/cm2/s
Energy fluence (15-150 keV)             : 2.828e-07 ( -2.40145e-08  2.3735e-08 ) ergs/cm2
Time-resolved spectra
Distribution
T90 vs. Hardness ratio plot
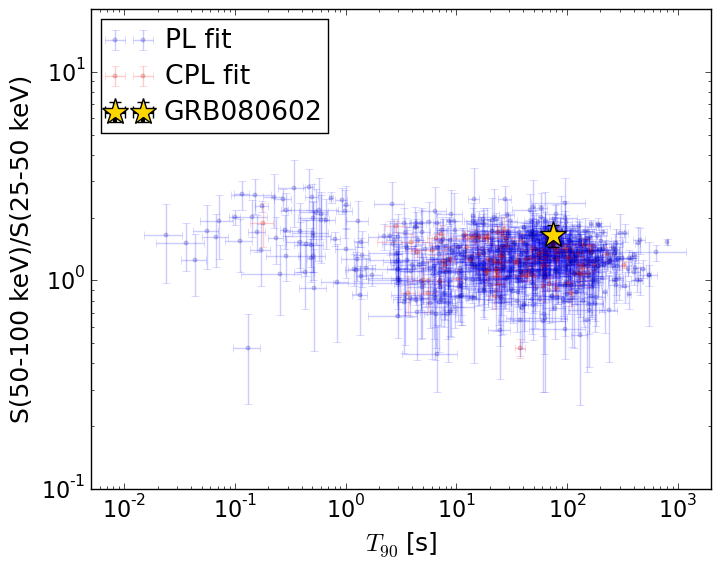
T90                                   = 74.288 sec.
Hardness ratio (energy fluence ratio) = 1.65025112709
S(15-50 keV) vs. S(50-150 keV) plot
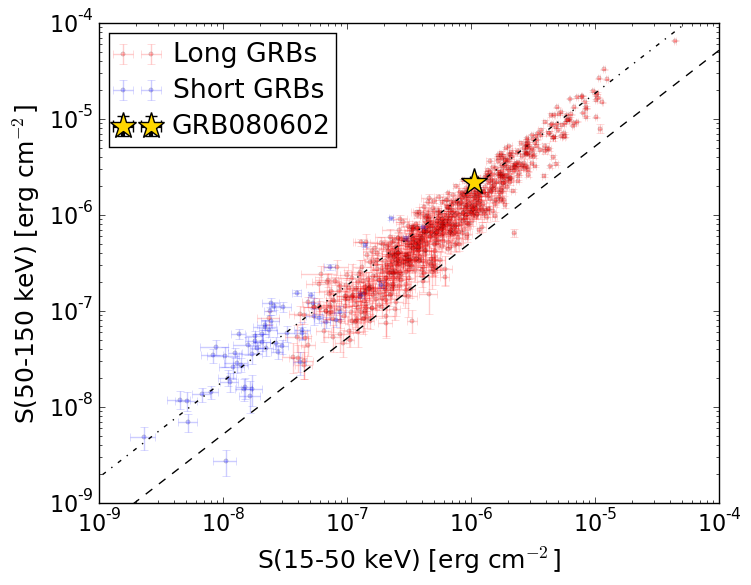
S(15-50 keV)  = 1.0554435e-06
S(50-150 keV) = 2.201522e-06
The dash-dotted line and the dashed line traces the fluences calculated from the Band function with Epeak = 15 and 150 keV, respectively. Both lines assume a canonical values of alpha = -1 and beta = -2.5.
Mask shadow pattern
IMX = 1.247494626952796E+00, IMY = 1.833962613966093E-02
Spacecraft aspect plot
Bright source in the pre-burst/pre-slew/post-slew images
Pre-burst image of 15-350 keV band
Time interval of the image:
-280.411400 -11.488000

# RAcent  DECcent POSerr Theta    Phi  PeakCts   SNR AngSep     Name
#  [deg]    [deg]    ['] [deg]  [deg]                   [']
326.3740  38.2981    5.8  34.3  108.7   0.8660   2.0    9.6	Cyg X-2
 12.4578   8.0656    2.2  33.5    7.1   1.2156   5.2 ------	UNKNOWN
 38.5410  -6.7742    2.4  54.3  -24.9   3.2234   4.8 ------	UNKNOWN
 40.2756  -0.0737    2.3  49.1  -30.7   2.3824   4.9 ------	UNKNOWN
Pre-slew background subtracted image of 15-350 keV band
Time interval of the image:
-11.488000 29.588600

# RAcent  DECcent POSerr Theta    Phi  PeakCts   SNR AngSep     Name
#  [deg]    [deg]    ['] [deg]  [deg]                   [']
326.1098  38.2747   11.2  34.5  108.8  -0.1548  -1.0    4.1	Cyg X-2
231.7057  78.5165    1.9  57.6 -179.8   2.5613   6.1 ------	UNKNOWN
 19.1739  -9.2379    0.8  51.3   -0.8   2.7717  14.5 ------	UNKNOWN
 85.7396  85.9484    2.4  47.5 -165.8   0.5946   4.8 ------	UNKNOWN
Post-slew image of 15-350 keV band
Time interval of the image:
100.588610 962.161900

# RAcent  DECcent POSerr Theta    Phi  PeakCts   SNR AngSep     Name
#  [deg]    [deg]    ['] [deg]  [deg]                   [']
  0.0561 -42.4540    2.9  37.2   56.7   3.8860   3.9 ------	UNKNOWN
 28.8173 -30.1185    2.9  22.7   11.1   1.6516   3.9 ------	UNKNOWN
347.0243  35.5001    2.9  54.1 -179.3   6.1157   4.0 ------	UNKNOWN