Analysis Summary
Notes:
- 1) No attempt has been made to eliminate the non-significant decimal places.
- 2) This batgrbproduct analysis is done using the HEASARC data.
- 3) This batgrbproduct analysis is using the flight position for the mask-weighting calculation.
======================================================================
                  BAT GRB EVENT DATA PROCESSING REPORT
    Process Script Ver: batgrbproduct v2.46
    Process Start Time: Mon Jan 20 01:30:07 EST 2014
             Host Name: batevent1
   Current Working Dir: /local/data/batevent/batevent_reproc/trigger313087
======================================================================

  Trigger: 00313087      Segment: 000

  BAT Trigger Time: 234214696.128   [s; MET]
      Trigger Stop: 234214696.64   [s; MET]
               UTC: 2008-06-03T19:38:13.288800    [includes UTCF correction]
       Where From?: TDRSS position message

  BAT
    RA: 176.527531635607   Dec: 68.0759595189382  [deg; J2000]

     Catalogged Source?: NO
     Point Source?:      YES
     GRB Indicated?:     YES    [ by BAT flight software ]
     Image S/N Ratio:    10.63
     Image Trigger?:     NO
     Rate S/N Ratio:     19.3649167310371  [ if not an image trigger ]
     Image S/N Ratio:    10.63

  Analysis Position:   [ source = BAT ]
    RA: 176.527531635607   Dec: 68.0759595189382  [deg; J2000]

  Refined Position:   [ source = BAT pre-slew burst ]
    RA: 176.551369790955   Dec: 68.0619708322101  [deg; J2000]
        { 11h 46m 12.3s , +68d 03' 43.1" }
         +/- 0.748871992018109 [arcmin] (estimated 90% radius based on SNR)
         +/- 0.193980388128199 [arcmin] (formal 1-sigma fit error)
    SNR: 45.9765215968534

  Angular difference between the analysis and refined position is 0.994901 arcmin

  Partial Coding Fraction: 1    [ including projection effects ]

  Duration
     T90: 59.1240000128746 +/- 1.63096534638045
        Measured from: 0.944000005722046
                   to: 60.0680000185966     [s; relative to TRIGTIME]
     T50: 45.3440000116825 +/- 1.07059610465852
        Measured from: 3.6240000128746
                   to: 48.9680000245571     [s; relative to TRIGTIME]


  Fluence
     Peak Flux  (peak 1 second)
        Measured from: 0.96000000834465
                   to: 1.96000000834465     [s; relative to TRIGTIME]
     Total Fluence
        Measured from: -0.11599999666214
                   to: 68.2560000121593     [s; relative to TRIGTIME]

             Band 1     Band 2     Band 3     Band 4
              15-25      25-50     50-100    100-350     keV
 Total     1.392891   1.776075   1.143370   0.180465
           0.039984   0.042232   0.037520   0.032468 [error]
 Peak      0.095298   0.152767   0.158416   0.057586
           0.005950   0.006854   0.006924   0.005661 [error]

     [ fluence units of on-axis counts / fully illuminated detector ]

======================================================================


====== Table of the duration information =============================

        Value   tstart    tstop
T100   68.372   -0.116   68.256
T90    59.124    0.944   60.068
T50    45.344    3.624   48.968
Peak    1.000    0.960    1.960


====== Spectral Analysis Summary =====================================

Model      : spectral model: simple power-law (PL) and cutoff power-law (CPL)
Ph_index   : photon index: E^{Ph_index}
Ph_90err   : 90% error of the photon index
Epeak      : Epeak in keV
Epeak_90err: 90% error of Epeak
Norm       : normalization at 50 keV in both the PL model and CPL model
Nomr_90err : 90% error of the normalization
chi2       : Chi-Squared
dof        : degree of freedo

=== Time-averaged spectral analysis ===
(Best model with acceptable fit: CPL)

Model Ph_index Ph_90err_low Ph_90err_hi  Epeak  Epeak_90err_low  Epeak_90err_hi  Norm       Nomr_90err_low    Norm_90err_hi    chi2    dof
PL      -1.731    -0.061      0.061       -           -               -         4.09e-03     -1.35e-04          1.35e-04      68.740   57
CPL     -1.210    -0.256      0.272       74.941     -10.857        25.782      7.44e-03     -1.86e-03          2.67e-03      56.010   56


=== 1-s peak spectral analysis ===
(Best model with acceptable fit: PL)

Model Ph_index Ph_90err_low Ph_90err_hi  Epeak  Epeak_90err_low  Epeak_90err_hi  Norm       Nomr_90err_low    Norm_90err_hi    chi2    dof
PL      -1.098     -0.087     0.087       -           -               -         3.04e-02     -1.43e-03          1.43e-03      51.930   57
CPL     -1.094     -0.086     0.092     9999.210    -9999.210      -9999.210      3.06e-02     -1.38e-03          9.83e-03      51.950   56


=== Fluence/Peak Flux Summary ===

              Model    Band1     Band2     Band3     Band4     Band5     Total
                       15-25     25-50    50-100    100-350    15-150    15-350    keV
Fluence         PL   4.44e-07  7.09e-07  8.54e-07  2.01e-06  2.58e-06  4.02e-06   erg/cm2
      90%_error_low -2.50e-08 -2.35e-08 -3.81e-08 -1.90e-07 -8.86e-08 -2.18e-07   erg/cm2
      90%_error_hi   2.55e-08  2.34e-08  3.81e-08  2.03e-07  8.90e-08  2.29e-07   erg/cm2
Peak flux       PL   8.54e-01  1.09e+00  1.02e+00  1.68e+00  3.53e+00  4.64e+00   ph/cm2/s
      90%_error_low -8.08e-02 -6.22e-02 -5.61e-02 -1.95e-01 -1.69e-01 -2.42e-01   ph/cm2/s
      90%_error_hi   8.35e-02  6.17e-02  5.57e-02  2.12e-01  1.69e-01  2.46e-01   ph/cm2/s

Fluence        CPL   4.02e-07  7.37e-07  8.68e-07  9.75e-07  2.46e-06  2.98e-06   erg/cm2
      90%_error_low -3.12e-08 -2.74e-08 -4.09e-08 -2.65e-07 -1.05e-07 -2.88e-07   erg/cm2
      90%_error_hi   3.18e-08  2.77e-08  4.11e-08  3.87e-07  1.05e-07  4.00e-07   erg/cm2
Peak flux      CPL   8.52e-01  1.09e+00  1.02e+00  1.67e+00  3.54e+00  4.72e+00   ph/cm2/s
      90%_error_low     N/A   -6.96e-02 -6.10e-02     N/A   -2.04e-01 -5.73e-01   ph/cm2/s
      90%_error_hi      N/A    7.42e-02  7.77e-02     N/A    1.87e-01  1.48e-01   ph/cm2/s

======================================================================
Image
Pre-slew 15.0-350.0 keV image (Event data)
#   RAcent    DECcent   POSerr    Theta     Phi              Peak Cts       SNR   Name
  176.5514    68.0620   0.0042    17.2204    -6.5766         2.0334852     45.977 TRIG_00313087

Foreground time interval of the image:
 -0.116  10.173 (delta_t =  10.289 [sec])
Background time interval of the image:
-30.227  -0.116 (delta_t =  30.111 [sec])
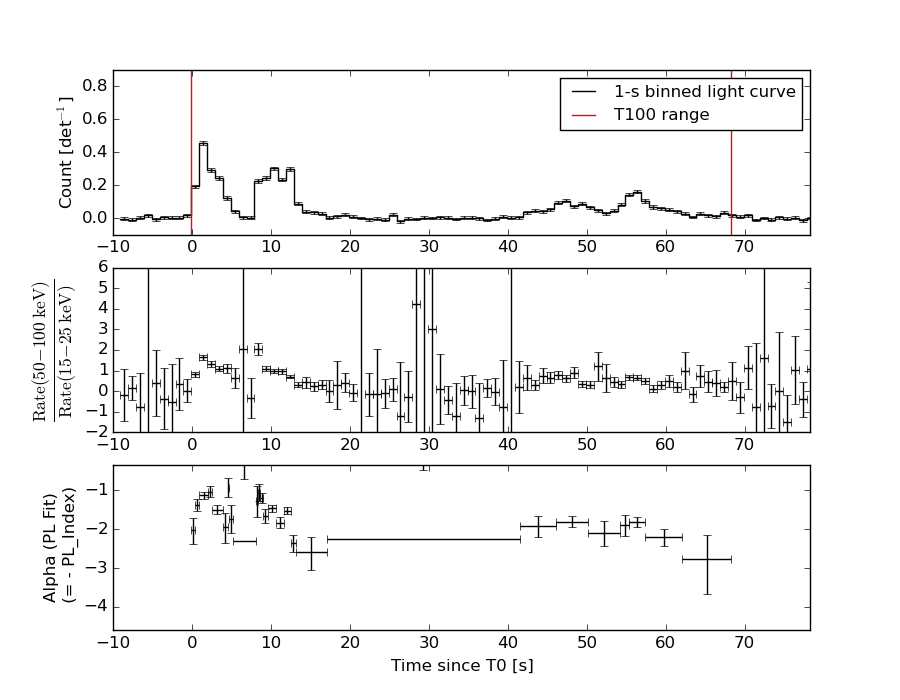
Light Curves
Note: The mask-weighted lightcurves have units of either count/det or counts/sec/det, where a det is 0.4 x 0.4 = 0.16 sq cm.
Full-time range; 1 s binning
Other quick-look light curves:
- 64 ms binning (zoomed)
- 16 ms binning (zoomed)
- 8 ms binning (zoomed)
- 2 ms binning (zoomed)
- SN=5 or 10 s binning (full-time range)
- Raw light curve
Spectra
- 64 ms binning (zoomed)
- 16 ms binning (zoomed)
- 8 ms binning (zoomed)
- 2 ms binning (zoomed)
- SN=5 or 10 s binning (full-time range)
- Raw light curve
Spectra
Notes:
- 1) The fitting includes the systematic errors.
- 2) When the burst includes telescope slew time periods, the fitting uses an average response file made from multiple 5-s response files through out the slew time plus single time preiod for the non-slew times, and weighted by the total counts in the corresponding time period using addrmf. An average response file is needed becuase a spectral fit using the pre-slew DRM will introduce some errors in both a spectral shape and a normalization if the PHA file contains a lot of the slew/post-slew time interval.
- 3) For fits to more complicated models (e.g. a power-law over a cutoff power-law), the BAT team has decided to require a chi-square improvement of more than 6 for each extra dof.
Time averaged spectrum fit using the average DRM
Power-law model
Time interval is from   -0.116 sec. to   68.256 sec.

Spectral model in power-law:
------------------------------------------------------------
Parameters  : value       lower 90%   higher 90%
Photon index: -1.73124     ( -0.0611324   0.0606951 )
Norm@50keV  : 4.09093E-03    ( -0.00013497   0.000134618 )
------------------------------------------------------------
#Fit statistic : Chi-Squared =          68.74 using 59 PHA bins.
# Reduced chi-squared =          1.206 for     57 degrees of freedom
# Null hypothesis probability =   1.370554e-01

Photon flux (15-150 keV)    in 68.37 sec: 0.549412 ( -0.018451  0.018499 ) ph/cm2/s
Energy fluence (15-150 keV)             : 2.58419e-06 ( -8.85911e-08  8.89692e-08 ) ergs/cm2
Cutoff power-law model
Time interval is from   -0.116 sec. to   68.256 sec.
Spectral model in the cutoff power-law:
------------------------------------------------------------
Parameters  : value       lower 90%   higher 90%
Photon index: -1.21047     ( -0.25618   0.271762 )
Epeak [keV] : 74.9413      ( -10.8568 25.7813 )
Norm@50keV  : 7.43716E-03    ( -0.00185624   0.00266603 )
------------------------------------------------------------
#Fit statistic : Chi-Squared =          56.01 using 59 PHA bins.
# Reduced chi-squared =          1.000 for     56 degrees of freedom
# Null hypothesis probability =   4.746309e-01

Photon flux (15-150 keV)    in 68.37 sec: 0.528695 ( -0.020703  0.020778 ) ph/cm2/s
Energy fluence (15-150 keV)             : 2.46437e-06 ( -1.04947e-07  1.05231e-07 ) ergs/cm2
1-s peak spectrum fit
Power-law model

Time interval is from    0.960 sec. to    1.960 sec.

Spectral model in power-law:
------------------------------------------------------------
Parameters  : value       lower 90%   higher 90%
Photon index: -1.0979     ( -0.0867618   0.0872389 )
Norm@50keV  : 3.04496E-02    ( -0.00142846   0.00142832 )
------------------------------------------------------------
#Fit statistic : Chi-Squared =          51.93 using 59 PHA bins.
# Reduced chi-squared =         0.9111 for     57 degrees of freedom
# Null hypothesis probability =   6.650848e-01

Photon flux (15-150 keV)    in 1 sec: 3.53123 ( -0.16909  0.16926 ) ph/cm2/s
Energy fluence (15-150 keV)             : 3.18603e-07 ( -1.70803e-08  1.71733e-08 ) ergs/cm2
Cutoff power-law model
Time interval is from    0.960 sec. to    1.960 sec.
Spectral model in the cutoff power-law:
------------------------------------------------------------
Parameters  : value       lower 90%   higher 90%
Photon index: -1.09382     ( -0.0865545   0.0915793 )
Epeak [keV] : 9999.21      ( -9999.28 -9999.28 )
Norm@50keV  : 3.05571E-02    ( -0.00143533   0.00977455 )
------------------------------------------------------------
#Fit statistic : Chi-Squared =          51.95 using 59 PHA bins.
# Reduced chi-squared =         0.9277 for     56 degrees of freedom
# Null hypothesis probability =   6.288072e-01

Photon flux (15-150 keV)    in 1 sec: 3.53857 ( -0.20352  0.18654 ) ph/cm2/s
Energy fluence (15-150 keV)             : 3.19463e-07 ( 0  0 ) ergs/cm2
Time-resolved spectra
Distribution
T90 vs. Hardness ratio plot
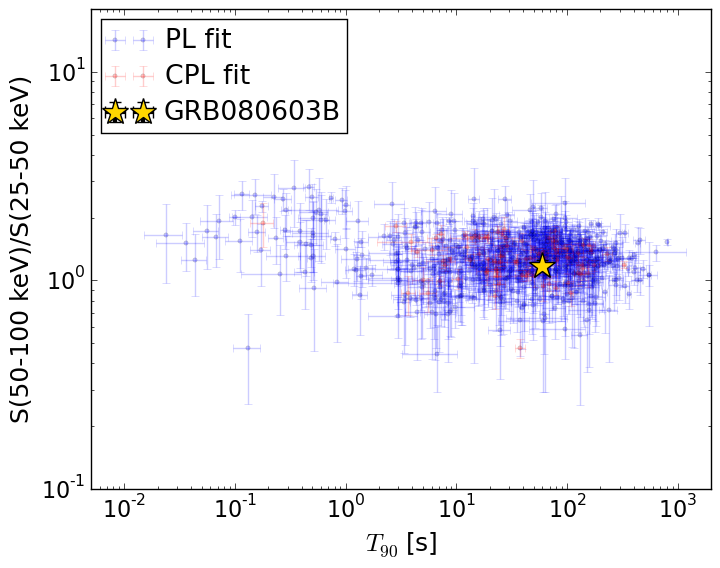
T90                                   = 59.124 sec.
Hardness ratio (energy fluence ratio) = 1.1782024649
S(15-50 keV) vs. S(50-150 keV) plot
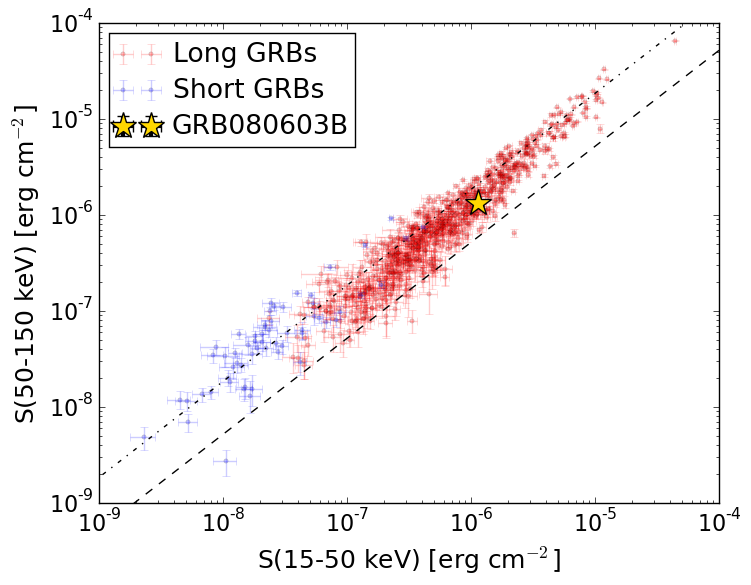
S(15-50 keV)  = 1.1385709e-06
S(50-150 keV) = 1.3257862e-06
The dash-dotted line and the dashed line traces the fluences calculated from the Band function with Epeak = 15 and 150 keV, respectively. Both lines assume a canonical values of alpha = -1 and beta = -2.5.
Mask shadow pattern
IMX = 3.079025315625138E-01, IMY = 3.549799085768047E-02
Spacecraft aspect plot
Bright source in the pre-burst/pre-slew/post-slew images
Pre-burst image of 15-350 keV band
Time interval of the image:
-30.227410 -0.116000

# RAcent  DECcent POSerr Theta    Phi  PeakCts   SNR AngSep     Name
#  [deg]    [deg]    ['] [deg]  [deg]                   [']
261.1583  63.2168    2.4  47.7   16.5   0.6510   4.8 ------	UNKNOWN
136.6458  22.5765    2.9  36.6 -152.7   0.2643   4.0 ------	UNKNOWN
  6.8847  70.7469    2.9  56.6  -29.1   1.0866   3.9 ------	UNKNOWN
 93.7414  54.3869    2.4  41.2  -77.7   0.9653   4.8 ------	UNKNOWN
Pre-slew background subtracted image of 15-350 keV band
Time interval of the image:
-0.116000 10.172590

# RAcent  DECcent POSerr Theta    Phi  PeakCts   SNR AngSep     Name
#  [deg]    [deg]    ['] [deg]  [deg]                   [']
176.5514  68.0620    0.3  17.2   -6.6   2.0334  46.0 ------	UNKNOWN
289.9890  73.4202    2.3  49.3   -2.7   0.4454   5.0 ------	UNKNOWN
125.1191  22.6181    2.2  42.4 -138.6   0.4033   5.3 ------	UNKNOWN
Post-slew image of 15-350 keV band
Time interval of the image:
50.972600 483.072000

# RAcent  DECcent POSerr Theta    Phi  PeakCts   SNR AngSep     Name
#  [deg]    [deg]    ['] [deg]  [deg]                   [']
301.9344  51.5906    2.6  53.7   17.5  21.1896   4.5 ------	UNKNOWN
314.5877  61.5389    4.0  46.9    4.4   5.4091   2.9 ------	UNKNOWN
 99.6949  48.5890    3.0  41.2  -99.2  15.6757   3.8 ------	UNKNOWN