Analysis Summary
Notes:
- 1) No attempt has been made to eliminate the non-significant decimal places.
- 2) This batgrbproduct analysis is done using the HEASARC data.
- 3) This batgrbproduct analysis is using the flight position for the mask-weighting calculation.
======================================================================
                  BAT GRB EVENT DATA PROCESSING REPORT
    Process Script Ver: batgrbproduct v2.46
    Process Start Time: Mon Jan 20 01:18:58 EST 2014
             Host Name: batevent1
   Current Working Dir: /local/data/batevent/batevent_reproc/trigger313299
======================================================================

  Trigger: 00313299      Segment: 000

  BAT Trigger Time: 234402480.704   [s; MET]
      Trigger Stop: 234402481.728   [s; MET]
               UTC: 2008-06-05T23:47:57.859480    [includes UTCF correction]
       Where From?: TDRSS position message

  BAT
    RA: 262.127299384762   Dec: 4.00166807477933  [deg; J2000]

     Catalogged Source?: NO
     Point Source?:      YES
     GRB Indicated?:     YES    [ by BAT flight software ]
     Image S/N Ratio:    25.82
     Image Trigger?:     NO
     Rate S/N Ratio:     120.743529847359  [ if not an image trigger ]
     Image S/N Ratio:    25.82

  Analysis Position:   [ source = BAT ]
    RA: 262.127299384762   Dec: 4.00166807477933  [deg; J2000]

  Refined Position:   [ source = BAT pre-slew burst ]
    RA: 262.129984962012   Dec: 4.00907888034348  [deg; J2000]
        { 17h 28m 31.2s , +04d 00' 32.7" }
         +/- 0.558082704217376 [arcmin] (estimated 90% radius based on SNR)
         +/- 0.158187564979418 [arcmin] (formal 1-sigma fit error)
    SNR: 69.9805860664166

  Angular difference between the analysis and refined position is 0.472811 arcmin

  Partial Coding Fraction: 0.4140625    [ including projection effects ]

  Duration
     T90: 18.055999994278 +/- 0.888225208353073
        Measured from: -2.80399999022484
                   to: 15.2520000040531     [s; relative to TRIGTIME]
     T50: 7.06000000238419 +/- 0.116275537741645
        Measured from: 2.31600001454353
                   to: 9.37600001692772     [s; relative to TRIGTIME]


  Fluence
     Peak Flux  (peak 1 second)
        Measured from: 7.57199999690056
                   to: 8.57199999690056     [s; relative to TRIGTIME]
     Total Fluence
        Measured from: -5.53200000524521
                   to: 22.5760000050068     [s; relative to TRIGTIME]

             Band 1     Band 2     Band 3     Band 4
              15-25      25-50     50-100    100-350     keV
 Total     4.289878   7.224310   6.262940   1.831162
           0.060148   0.069483   0.068050   0.057761 [error]
 Peak      0.395359   0.835084   0.926597   0.355922
           0.015363   0.020385   0.022146   0.017162 [error]

     [ fluence units of on-axis counts / fully illuminated detector ]

======================================================================


====== Table of the duration information =============================

        Value   tstart    tstop
T100   28.108   -5.532   22.576
T90    18.056   -2.804   15.252
T50     7.060    2.316    9.376
Peak    1.000    7.572    8.572


====== Spectral Analysis Summary =====================================

Model      : spectral model: simple power-law (PL) and cutoff power-law (CPL)
Ph_index   : photon index: E^{Ph_index}
Ph_90err   : 90% error of the photon index
Epeak      : Epeak in keV
Epeak_90err: 90% error of Epeak
Norm       : normalization at 50 keV in both the PL model and CPL model
Nomr_90err : 90% error of the normalization
chi2       : Chi-Squared
dof        : degree of freedo

=== Time-averaged spectral analysis ===
(Best model with acceptable fit: CPL)

Model Ph_index Ph_90err_low Ph_90err_hi  Epeak  Epeak_90err_low  Epeak_90err_hi  Norm       Nomr_90err_low    Norm_90err_hi    chi2    dof
PL      -1.324    -0.030      0.030       -           -               -         4.90e-02     -7.83e-04          7.82e-04      37.900   57
CPL     -1.146    -0.119      0.122      290.697     -92.583       421.177      5.81e-02     -6.09e-03          6.97e-03      31.320   56


=== 1-s peak spectral analysis ===
(Best model with acceptable fit: N/A)

Model Ph_index Ph_90err_low Ph_90err_hi  Epeak  Epeak_90err_low  Epeak_90err_hi  Norm       Nomr_90err_low    Norm_90err_hi    chi2    dof
PL      -0.938     -0.049     0.049       -           -               -         1.73e-01     -4.85e-03          4.84e-03      42.370   57
CPL     -0.714     -0.179     0.198      344.136    -132.467      1290.214      2.16e-01     -3.33e-02          4.51e-02      38.290   56


=== Fluence/Peak Flux Summary ===

              Model    Band1     Band2     Band3     Band4     Band5     Total
                       15-25     25-50    50-100    100-350    15-150    15-350    keV
Fluence         PL   1.49e-06  3.06e-06  4.88e-06  1.74e-05  1.35e-05  2.68e-05   erg/cm2
      90%_error_low -5.23e-08 -6.27e-08 -8.33e-08 -7.00e-07 -2.13e-07 -7.24e-07   erg/cm2
      90%_error_hi   5.31e-08  6.26e-08  8.30e-08  7.21e-07  2.13e-07  7.41e-07   erg/cm2
Peak flux       PL   1.58e-03  1.91e-02  2.53e-01  2.23e+01  9.40e-01  2.21e+01   ph/cm2/s
      90%_error_low     N/A       N/A       N/A       N/A       N/A       N/A     ph/cm2/s
      90%_error_hi      N/A       N/A       N/A       N/A       N/A       N/A     ph/cm2/s

Fluence        CPL   1.41e-06  3.07e-06  4.97e-06  1.42e-05  1.34e-05  2.36e-05   erg/cm2
      90%_error_low -7.15e-08 -6.42e-08 -1.02e-07 -1.77e-06 -2.27e-07 -1.77e-06   erg/cm2
      90%_error_hi   7.28e-08  6.42e-08  1.03e-07  2.08e-06  2.26e-07  2.07e-06   erg/cm2
Peak flux      CPL   3.91e+00  5.93e+00  6.31e+00  9.49e+00  1.97e+01  2.56e+01   ph/cm2/s
      90%_error_low -3.19e-01 -2.18e-01 -2.32e-01 -1.57e+00 -5.81e-01 -1.68e+00   ph/cm2/s
      90%_error_hi   3.26e-01  2.19e-01  2.34e-01  1.89e+00  5.81e-01  1.97e+00   ph/cm2/s

======================================================================
Image
Pre-slew 15.0-350.0 keV image (Event data)
#   RAcent    DECcent   POSerr    Theta     Phi              Peak Cts       SNR   Name
  262.1300     4.0091   0.0027    29.5847    63.8919        17.4523451     69.981 TRIG_00313299

Foreground time interval of the image:
 -5.532  11.197 (delta_t =  16.729 [sec])
Background time interval of the image:
-219.803  -5.532 (delta_t = 214.271 [sec])
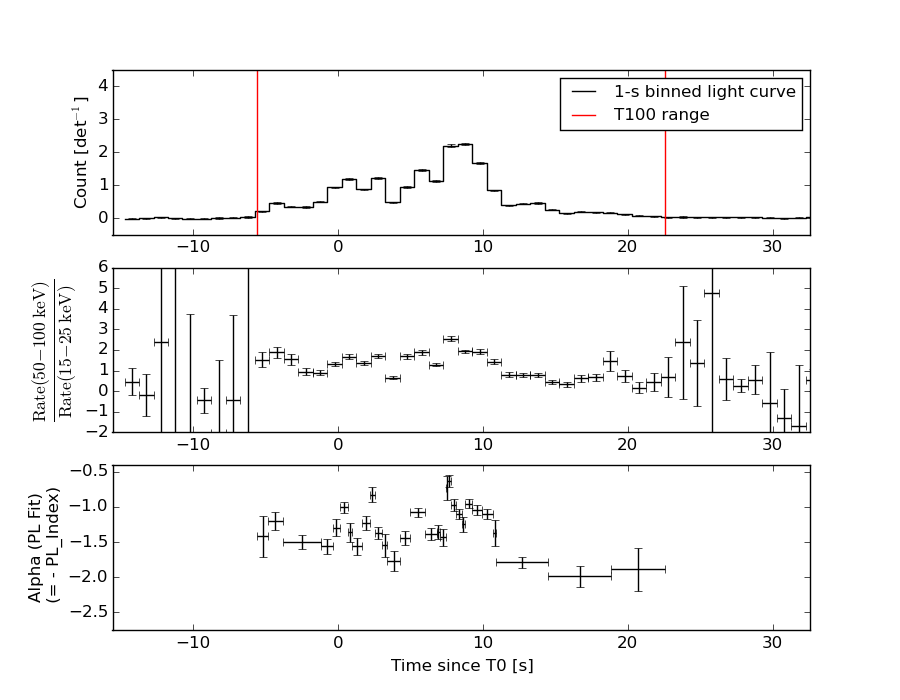
Light Curves
Note: The mask-weighted lightcurves have units of either count/det or counts/sec/det, where a det is 0.4 x 0.4 = 0.16 sq cm.
Full-time range; 1 s binning
Other quick-look light curves:
- 64 ms binning (zoomed)
- 16 ms binning (zoomed)
- 8 ms binning (zoomed)
- 2 ms binning (zoomed)
- SN=5 or 10 s binning (full-time range)
- Raw light curve
Spectra
- 64 ms binning (zoomed)
- 16 ms binning (zoomed)
- 8 ms binning (zoomed)
- 2 ms binning (zoomed)
- SN=5 or 10 s binning (full-time range)
- Raw light curve
Spectra
Notes:
- 1) The fitting includes the systematic errors.
- 2) When the burst includes telescope slew time periods, the fitting uses an average response file made from multiple 5-s response files through out the slew time plus single time preiod for the non-slew times, and weighted by the total counts in the corresponding time period using addrmf. An average response file is needed becuase a spectral fit using the pre-slew DRM will introduce some errors in both a spectral shape and a normalization if the PHA file contains a lot of the slew/post-slew time interval.
- 3) For fits to more complicated models (e.g. a power-law over a cutoff power-law), the BAT team has decided to require a chi-square improvement of more than 6 for each extra dof.
Time averaged spectrum fit using the average DRM
Power-law model
Time interval is from   -5.532 sec. to   22.576 sec.

Spectral model in power-law:
------------------------------------------------------------
Parameters  : value       lower 90%   higher 90%
Photon index: -1.32397     ( -0.0296608   0.0297382 )
Norm@50keV  : 4.90480E-02    ( -0.000782837   0.000782077 )
------------------------------------------------------------
#Fit statistic : Chi-Squared =          37.90 using 59 PHA bins.
# Reduced chi-squared =         0.6649 for     57 degrees of freedom
# Null hypothesis probability =   9.758903e-01

Photon flux (15-150 keV)    in 28.11 sec: 5.87823 ( -0.1072  0.10755 ) ph/cm2/s
Energy fluence (15-150 keV)             : 1.35482e-05 ( -2.13244e-07  2.13167e-07 ) ergs/cm2
Cutoff power-law model
Time interval is from   -5.532 sec. to   22.576 sec.
Spectral model in the cutoff power-law:
------------------------------------------------------------
Parameters  : value       lower 90%   higher 90%
Photon index: -1.14606     ( -0.118705   0.121858 )
Epeak [keV] : 290.697      ( -92.5843 421.176 )
Norm@50keV  : 5.81264E-02    ( -0.00609048   0.00696946 )
------------------------------------------------------------
#Fit statistic : Chi-Squared =          31.32 using 59 PHA bins.
# Reduced chi-squared =         0.5592 for     56 degrees of freedom
# Null hypothesis probability =   9.969155e-01

Photon flux (15-150 keV)    in 28.11 sec: 5.79319 ( -0.11947  0.12012 ) ph/cm2/s
Energy fluence (15-150 keV)             : 1.34339e-05 ( -2.26955e-07  2.26466e-07 ) ergs/cm2
1-s peak spectrum fit
Power-law model
Time interval is from    7.572 sec. to    8.572 sec.

Spectral model in power-law:
------------------------------------------------------------
Parameters  : value       lower 90%   higher 90%
Photon index: -0.937964     ( -0.0490162   0.0492884 )
Norm@50keV  : 0.173330    ( -0.00485224   0.0048458 )
------------------------------------------------------------
#Fit statistic : Chi-Squared =          42.37 using 59 PHA bins.
# Reduced chi-squared =         0.7434 for     57 degrees of freedom
# Null hypothesis probability =   9.257152e-01

Photon flux (15-150 keV)    in 1 sec: 0.939685 (    ) ph/cm2/s
Energy fluence (15-150 keV)             : 1.91743e-06 ( -5.74426e-08  5.75377e-08 ) ergs/cm2
Cutoff power-law model
Time interval is from    7.572 sec. to    8.572 sec.
Spectral model in the cutoff power-law:
------------------------------------------------------------
Parameters  : value       lower 90%   higher 90%
Photon index: -0.714137     ( -0.179312   0.198396 )
Epeak [keV] : 344.136      ( -132.467 1290.21 )
Norm@50keV  : 0.216077    ( -0.0333371   0.045077 )
------------------------------------------------------------
#Fit statistic : Chi-Squared =          38.29 using 59 PHA bins.
# Reduced chi-squared =         0.6838 for     56 degrees of freedom
# Null hypothesis probability =   9.661218e-01

Photon flux (15-150 keV)    in 1 sec: 19.7281 ( -0.5808  0.5813 ) ph/cm2/s
Energy fluence (15-150 keV)             : 1.90204e-06 ( -5.96142e-08  5.94225e-08 ) ergs/cm2
Time-resolved spectra
Distribution
T90 vs. Hardness ratio plot
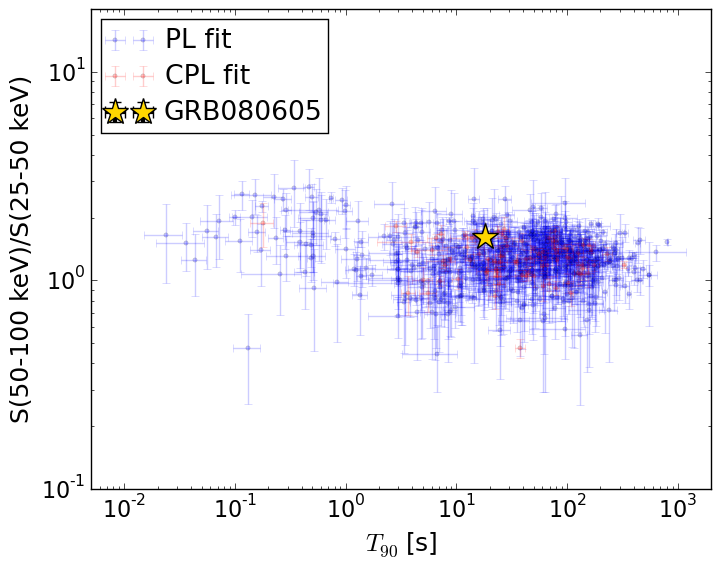
T90                                   = 18.056 sec.
Hardness ratio (energy fluence ratio) = 1.62102679449
S(15-50 keV) vs. S(50-150 keV) plot
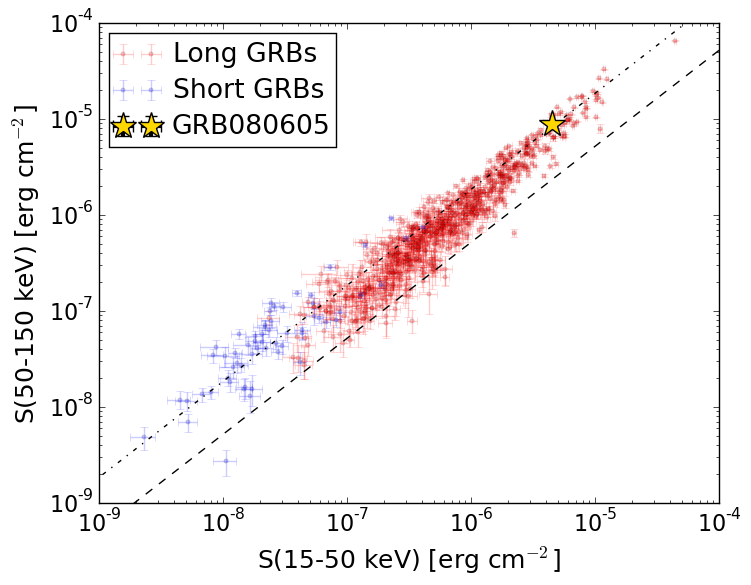
S(15-50 keV)  = 4.482836e-06
S(50-150 keV) = 8.951016e-06
The dash-dotted line and the dashed line traces the fluences calculated from the Band function with Epeak = 15 and 150 keV, respectively. Both lines assume a canonical values of alpha = -1 and beta = -2.5.
Mask shadow pattern
IMX = 2.498364785083470E-01, IMY = -5.097982982999856E-01
Spacecraft aspect plot
Bright source in the pre-burst/pre-slew/post-slew images
Pre-burst image of 15-350 keV band
Time interval of the image:
-219.803410 -5.532000

# RAcent  DECcent POSerr Theta    Phi  PeakCts   SNR AngSep     Name
#  [deg]    [deg]    ['] [deg]  [deg]                   [']
245.0034 -15.6498    0.8  37.1  110.3   7.5159  13.7    1.5	Sco X-1
254.4346  35.3262    1.5  21.3  -14.3   1.6594   7.5    1.5	Her X-1
268.4301  -1.3367    6.8  37.8   64.8   1.0499   1.7    7.9	SW J1753.5-0127
299.6074  35.1990    2.0  56.4    3.9   6.8948   5.8    0.9	Cyg X-1
212.0848  24.8825    2.7  23.3 -131.5   0.8574   4.3 ------	UNKNOWN
293.5407  51.9597    2.4  53.5  -17.0   2.7587   4.9 ------	UNKNOWN
244.0644  67.4243    2.9  47.1  -53.1   4.2156   4.0 ------	UNKNOWN
197.6791  46.5417    4.2  41.1  -98.3   3.0053   2.8 ------	UNKNOWN
Pre-slew background subtracted image of 15-350 keV band
Time interval of the image:
-5.532000 11.196600

# RAcent  DECcent POSerr Theta    Phi  PeakCts   SNR AngSep     Name
#  [deg]    [deg]    ['] [deg]  [deg]                   [']
245.1713 -15.6784    9.6  37.2  110.0  -0.5457  -1.2   11.3	Sco X-1
254.3361  35.2046    4.8  21.1  -14.2   0.3220   2.4   10.2	Her X-1
268.3713  -1.4834   29.9  37.9   65.1  -0.1732  -0.4    1.9	SW J1753.5-0127
299.5999  35.1838   11.1  56.4    3.9   1.0194   1.0    1.2	Cyg X-1
262.1300   4.0091    0.2  29.6   63.9  17.4519  70.0 ------	UNKNOWN
274.9777  23.8499    2.5  35.3   20.7   0.9198   4.5 ------	UNKNOWN
199.6916  31.9162    2.9  35.1 -120.2   0.5972   3.9 ------	UNKNOWN
191.0566  26.6415    2.9  42.3 -129.4   0.6583   4.0 ------	UNKNOWN
263.8307  68.5306    3.7  50.7  -44.5   1.5351   3.2 ------	UNKNOWN
189.7737  35.8379    3.8  43.8 -116.0   1.2331   3.1 ------	UNKNOWN
186.7048  30.5654    3.1  46.0 -123.7   1.6214   3.8 ------	UNKNOWN
Post-slew image of 15-350 keV band
Time interval of the image:
78.596600 962.359200

# RAcent  DECcent POSerr Theta    Phi  PeakCts   SNR AngSep     Name
#  [deg]    [deg]    ['] [deg]  [deg]                   [']
244.9900 -15.6342    0.3  25.9  115.2  31.3001  36.7    0.7	Sco X-1
254.4738  35.3300    1.6  32.1 -117.0   7.9137   7.0    1.1	Her X-1
262.9070 -24.5948    9.7  28.6   73.3   1.0890   1.2   10.6	GX 1+4
268.3213  -1.4360    3.5   8.2   25.9   2.1550   3.2    3.0	SW J1753.5-0127
270.3055 -25.1157    2.2  30.2   59.9   5.0382   5.2    2.5	GX 5-1
270.3137 -25.7101    3.2  30.7   60.2   3.5951   3.6    2.1	GRS 1758-258
273.9251 -14.1494    4.0  21.6   42.2   1.8685   2.8    8.2	GX 17+2
275.9216 -30.2709    4.3  36.7   54.6   3.6367   2.7    5.8	H1820-303
285.0331 -25.0534   13.1  36.6   38.5   0.9276   0.9    8.0	HT1900.1-2455
288.7949  10.9387    0.6  27.3  -31.5  12.3296  20.2    0.5	GRS 1915+105
262.9474 -33.8358   10.6  37.8   73.7   2.4974   1.1    2.1	GX 354-0
266.8521 -27.3220    1.0  31.6   66.8  12.7145  11.4 ------	UNKNOWN
310.2729  24.9210    5.1  50.7  -44.5  10.1912   2.3 ------	UNKNOWN