Analysis Summary
Notes:
- 1) No attempt has been made to eliminate the non-significant decimal places.
- 2) This batgrbproduct analysis is done using the HEASARC data.
- 3) This batgrbproduct analysis is using the flight position for the mask-weighting calculation.
======================================================================
BAT GRB EVENT DATA PROCESSING REPORT
Process Script Ver: batgrbproduct v2.46
Process Start Time: Mon Jan 20 01:13:48 EST 2014
Host Name: batevent1
Current Working Dir: /local/data/batevent/batevent_reproc/trigger313417
======================================================================
Trigger: 00313417 Segment: 000
BAT Trigger Time: 234511649.856 [s; MET]
Trigger Stop: 234511650.88 [s; MET]
UTC: 2008-06-07T06:07:27.008340 [includes UTCF correction]
Where From?: TDRSS position message
BAT
RA: 194.967287472106 Dec: 15.9004689525493 [deg; J2000]
Catalogged Source?: NO
Point Source?: YES
GRB Indicated?: YES [ by BAT flight software ]
Image S/N Ratio: 17.87
Image Trigger?: NO
Rate S/N Ratio: 238.88490952758 [ if not an image trigger ]
Image S/N Ratio: 17.87
Analysis Position: [ source = BAT ]
RA: 194.967287472106 Dec: 15.9004689525493 [deg; J2000]
Refined Position: [ source = BAT pre-slew burst ]
RA: 194.96360541938 Dec: 15.9101271928674 [deg; J2000]
{ 12h 59m 51.3s , +15d 54' 36.5" }
+/- 0.896855558096024 [arcmin] (estimated 90% radius based on SNR)
+/- 0.286990466310308 [arcmin] (formal 1-sigma fit error)
SNR: 35.5351096657511
Angular difference between the analysis and refined position is 0.617216 arcmin
Partial Coding Fraction: 0.1113281 [ including projection effects ]
Duration
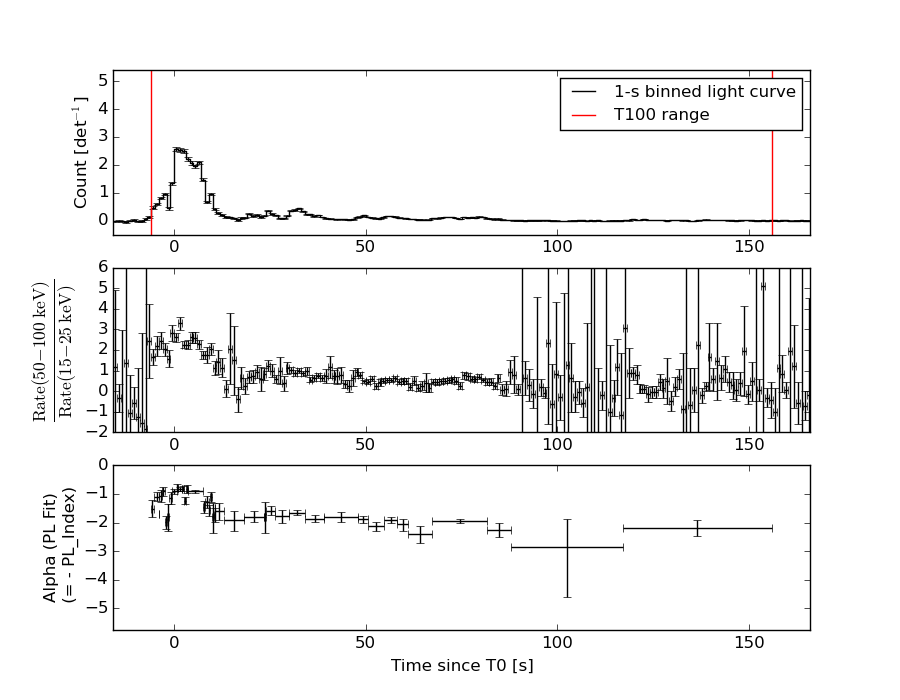
T90: 78.972000002861 +/- 3.04169689285327
Measured from: -2.99599999189377
to: 75.9760000109673 [s; relative to TRIGTIME]
T50: 22.5799999833107 +/- 1.68855913334988
Measured from: 1.70800000429153
to: 24.2879999876022 [s; relative to TRIGTIME]
Fluence
Peak Flux (peak 1 second)
Measured from: 1.50400000810623
to: 2.50400000810623 [s; relative to TRIGTIME]
Total Fluence
Measured from: -5.96000000834465
to: 155.840000003576 [s; relative to TRIGTIME]
Band 1 Band 2 Band 3 Band 4
15-25 25-50 50-100 100-350 keV
Total 7.651197 11.876875 11.482594 4.147420
0.132098 0.158146 0.160673 0.127372 [error]
Peak 0.369364 0.895090 1.165779 0.497568
0.028047 0.039659 0.047695 0.037801 [error]
[ fluence units of on-axis counts / fully illuminated detector ]
======================================================================
====== Table of the duration information =============================
Value tstart tstop
T100 161.800 -5.960 155.840
T90 78.972 -2.996 75.976
T50 22.580 1.708 24.288
Peak 1.000 1.504 2.504
====== Spectral Analysis Summary =====================================
Model : spectral model: simple power-law (PL) and cutoff power-law (CPL)
Ph_index : photon index: E^{Ph_index}
Ph_90err : 90% error of the photon index
Epeak : Epeak in keV
Epeak_90err: 90% error of Epeak
Norm : normalization at 50 keV in both the PL model and CPL model
Nomr_90err : 90% error of the normalization
chi2 : Chi-Squared
dof : degree of freedo
=== Time-averaged spectral analysis ===
(Best model with acceptable fit: PL)
Model Ph_index Ph_90err_low Ph_90err_hi Epeak Epeak_90err_low Epeak_90err_hi Norm Nomr_90err_low Norm_90err_hi chi2 dof
PL -1.241 -0.035 0.035 - - - 1.52e-02 -2.82e-04 2.82e-04 40.300 57
CPL -1.235 -0.036 0.034 9998.640 -9998.640 -9998.640 1.53e-02 -2.67e-04 1.07e-03 40.440 56
=== 1-s peak spectral analysis ===
(Best model with acceptable fit: PL)
Model Ph_index Ph_90err_low Ph_90err_hi Epeak Epeak_90err_low Epeak_90err_hi Norm Nomr_90err_low Norm_90err_hi chi2 dof
PL -0.805 -0.078 0.079 - - - 2.03e-01 -9.42e-03 9.38e-03 34.480 57
CPL -0.659 -0.180 0.310 552.387 -552.387 -552.387 2.35e-01 -2.34e-02 8.17e-02 33.760 56
=== Fluence/Peak Flux Summary ===
Model Band1 Band2 Band3 Band4 Band5 Total
15-25 25-50 50-100 100-350 15-150 15-350 keV
Fluence PL 2.47e-06 5.32e-06 9.01e-06 3.50e-05 2.47e-05 5.18e-05 erg/cm2
90%_error_low -1.01e-07 -1.27e-07 -1.79e-07 -1.66e-06 -4.57e-07 -1.72e-06 erg/cm2
90%_error_hi 1.03e-07 1.27e-07 1.78e-07 1.72e-06 4.58e-07 1.76e-06 erg/cm2
Peak flux PL 4.31e+00 6.57e+00 7.53e+00 1.65e+01 2.33e+01 3.49e+01 ph/cm2/s
90%_error_low -4.05e-01 -3.85e-01 -3.65e-01 -1.67e+00 -1.07e+00 -1.89e+00 ph/cm2/s
90%_error_hi 4.19e-01 3.82e-01 3.63e-01 1.79e+00 1.07e+00 1.94e+00 ph/cm2/s
Fluence CPL 2.47e-06 5.32e-06 8.94e-06 3.56e-05 2.47e-05 5.15e-05 erg/cm2
90%_error_low N/A -1.27e-07 N/A N/A -4.58e-07 -1.78e-06 erg/cm2
90%_error_hi N/A 1.27e-07 N/A N/A 4.57e-07 1.84e-06 erg/cm2
Peak flux CPL 1.07e-01 4.53e-02 6.73e-03 1.56e-02 5.53e-02 2.13e-01 ph/cm2/s
90%_error_low -1.07e-01 -4.53e-02 N/A -1.56e-02 -5.53e-02 -2.13e-01 ph/cm2/s
90%_error_hi 3.72e-01 6.43e-01 N/A 8.88e-02 1.99e-01 3.01e-02 ph/cm2/s
======================================================================
Image
Pre-slew 15.0-350.0 keV image (Event data)
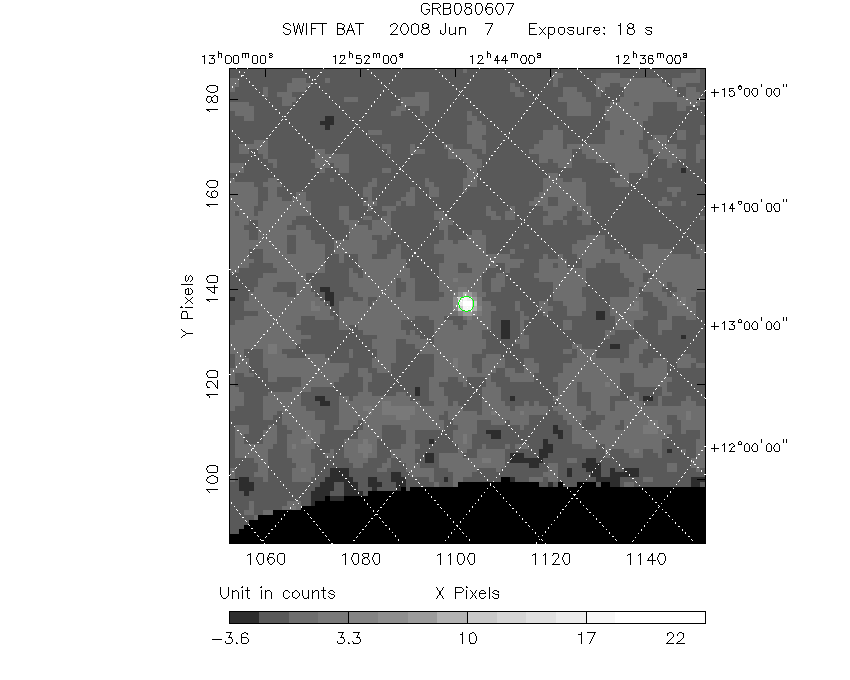
#   RAcent    DECcent   POSerr    Theta     Phi              Peak Cts       SNR   Name
  194.9636    15.9101   0.0054    40.4736   123.2433        25.4126879     35.535 TRIG_00313417

Foreground time interval of the image:
 -5.960  11.845 (delta_t =  17.805 [sec])
Background time interval of the image:
-239.856  -5.960 (delta_t = 233.896 [sec])
Light Curves
Note: The mask-weighted lightcurves have units of either count/det or counts/sec/det, where a det is 0.4 x 0.4 = 0.16 sq cm.
Full-time range; 1 s binning
Other quick-look light curves:
- 64 ms binning (zoomed)
- 16 ms binning (zoomed)
- 8 ms binning (zoomed)
- 2 ms binning (zoomed)
- SN=5 or 10 s binning (full-time range)
- Raw light curve
Spectra
- 64 ms binning (zoomed)
- 16 ms binning (zoomed)
- 8 ms binning (zoomed)
- 2 ms binning (zoomed)
- SN=5 or 10 s binning (full-time range)
- Raw light curve
Spectra
Notes:
- 1) The fitting includes the systematic errors.
- 2) When the burst includes telescope slew time periods, the fitting uses an average response file made from multiple 5-s response files through out the slew time plus single time preiod for the non-slew times, and weighted by the total counts in the corresponding time period using addrmf. An average response file is needed becuase a spectral fit using the pre-slew DRM will introduce some errors in both a spectral shape and a normalization if the PHA file contains a lot of the slew/post-slew time interval.
- 3) For fits to more complicated models (e.g. a power-law over a cutoff power-law), the BAT team has decided to require a chi-square improvement of more than 6 for each extra dof.
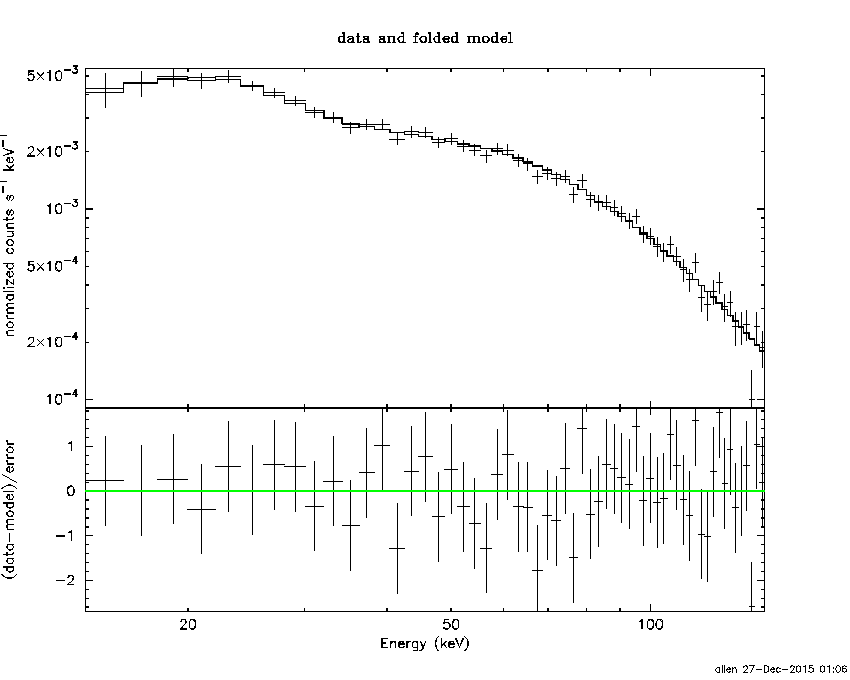
Time averaged spectrum fit using the average DRM
Power-law model

Time interval is from   -5.960 sec. to  155.840 sec.

Spectral model in power-law:
------------------------------------------------------------
Parameters  : value       lower 90%   higher 90%
Photon index: -1.24061     ( -0.0349637   0.0351177 )
Norm@50keV  : 1.52351E-02    ( -0.000282121   0.000281573 )
------------------------------------------------------------
#Fit statistic : Chi-Squared =          40.30 using 59 PHA bins.
# Reduced chi-squared =         0.7071 for     57 degrees of freedom
# Null hypothesis probability =   9.540284e-01

Photon flux (15-150 keV)    in 161.8 sec: 1.79920 ( -0.03697  0.03719 ) ph/cm2/s
Energy fluence (15-150 keV)             : 2.47342e-05 ( -4.57009e-07  4.57556e-07 ) ergs/cm2
Cutoff power-law model
Time interval is from   -5.960 sec. to  155.840 sec.
Spectral model in the cutoff power-law:
------------------------------------------------------------
Parameters  : value       lower 90%   higher 90%
Photon index: -1.23505     ( -0.0360805   0.0345535 )
Epeak [keV] : 9998.64      ( -9998.85 -9998.85 )
Norm@50keV  : 1.52910E-02    ( -0.000277385   0.00105777 )
------------------------------------------------------------
#Fit statistic : Chi-Squared =          40.44 using 59 PHA bins.
# Reduced chi-squared =         0.7221 for     56 degrees of freedom
# Null hypothesis probability =   9.417214e-01

Photon flux (15-150 keV)    in 161.8 sec: 0.774580 ( -0.068593  0.059965 ) ph/cm2/s
Energy fluence (15-150 keV)             : 2.47292e-05 ( -4.57582e-07  4.56773e-07 ) ergs/cm2
1-s peak spectrum fit
Power-law model
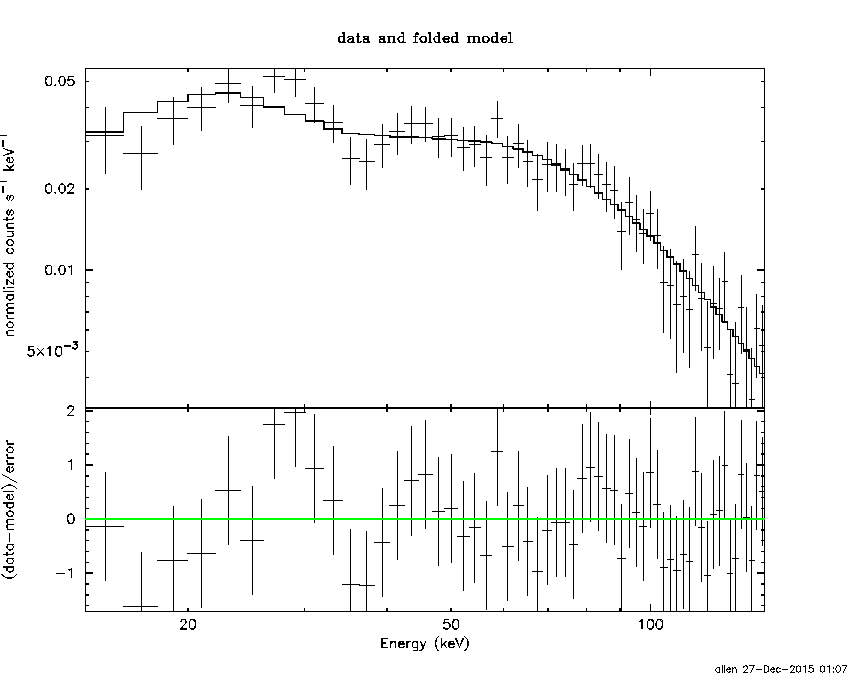
Time interval is from    1.504 sec. to    2.504 sec.

Spectral model in power-law:
------------------------------------------------------------
Parameters  : value       lower 90%   higher 90%
Photon index: -0.804616     ( -0.078049   0.0789062 )
Norm@50keV  : 0.202804    ( -0.00941822   0.00938049 )
------------------------------------------------------------
#Fit statistic : Chi-Squared =          34.48 using 59 PHA bins.
# Reduced chi-squared =         0.6049 for     57 degrees of freedom
# Null hypothesis probability =   9.920607e-01

Photon flux (15-150 keV)    in 1 sec: 23.3047 ( -1.067  1.0673 ) ph/cm2/s
Energy fluence (15-150 keV)             : 2.36559e-06 ( -1.19123e-07  1.19373e-07 ) ergs/cm2
Cutoff power-law model
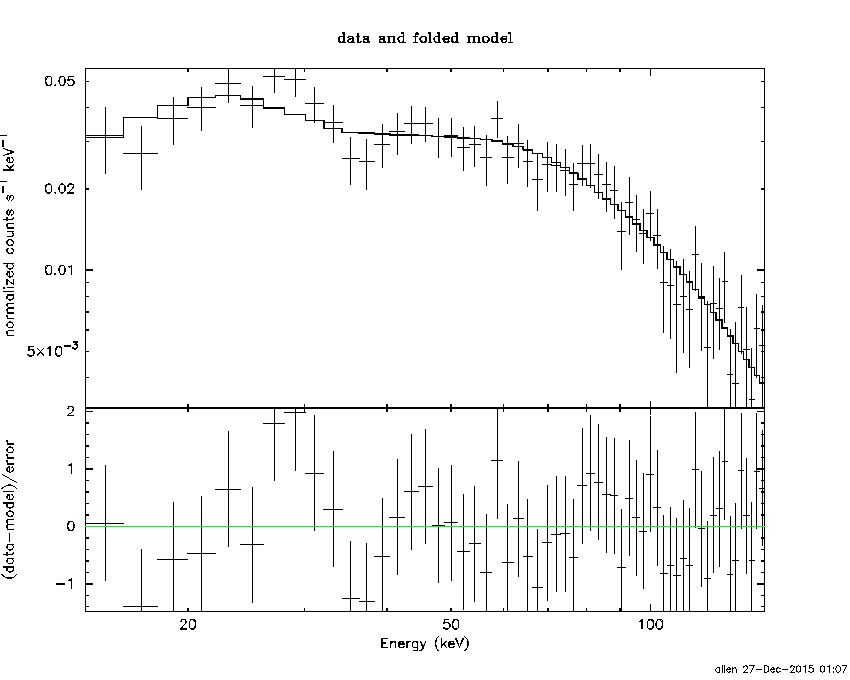
Time interval is from    1.504 sec. to    2.504 sec.
Spectral model in the cutoff power-law:
------------------------------------------------------------
Parameters  : value       lower 90%   higher 90%
Photon index: -0.658699     ( -0.179817   0.310059 )
Epeak [keV] : 552.387      ( -552.388 -552.388 )
Norm@50keV  : 0.234559    ( -0.0233763   0.081674 )
------------------------------------------------------------
#Fit statistic : Chi-Squared =          33.76 using 59 PHA bins.
# Reduced chi-squared =         0.6029 for     56 degrees of freedom
# Null hypothesis probability =   9.918983e-01

Photon flux (15-150 keV)    in 1 sec: 5.52952E-02 ( -0.0552952  0.199354 ) ph/cm2/s
Energy fluence (15-150 keV)             : 2.35717e-06 ( -1.21591e-07  1.21222e-07 ) ergs/cm2
Time-resolved spectra
Distribution
T90 vs. Hardness ratio plot
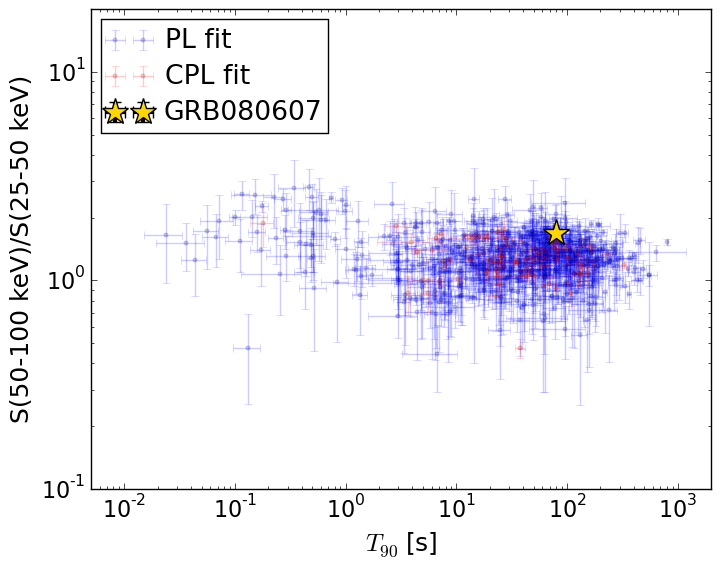
T90                                   = 78.972 sec.
Hardness ratio (energy fluence ratio) = 1.69281694548
S(15-50 keV) vs. S(50-150 keV) plot
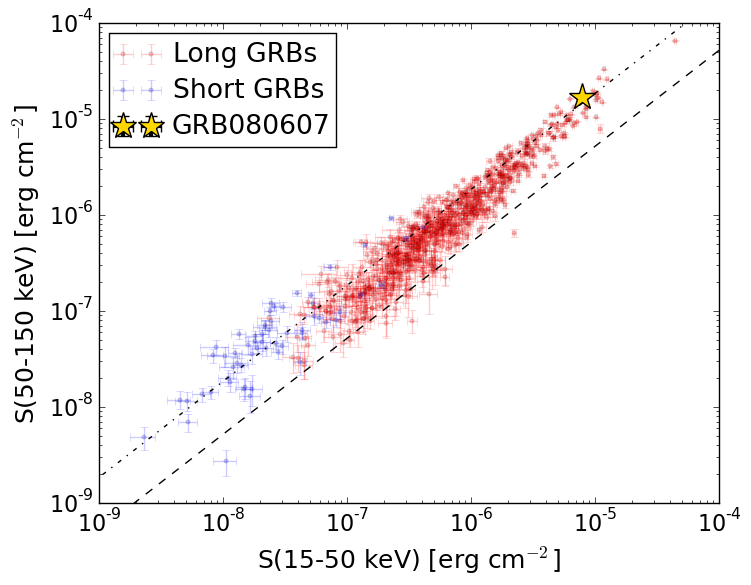
S(15-50 keV)  = 7.79079e-06
S(50-150 keV) = 1.6943531e-05
The dash-dotted line and the dashed line traces the fluences calculated from the Band function with Epeak = 15 and 150 keV, respectively. Both lines assume a canonical values of alpha = -1 and beta = -2.5.
Mask shadow pattern

IMX = -4.677664989216760E-01, IMY = -7.136450700860668E-01
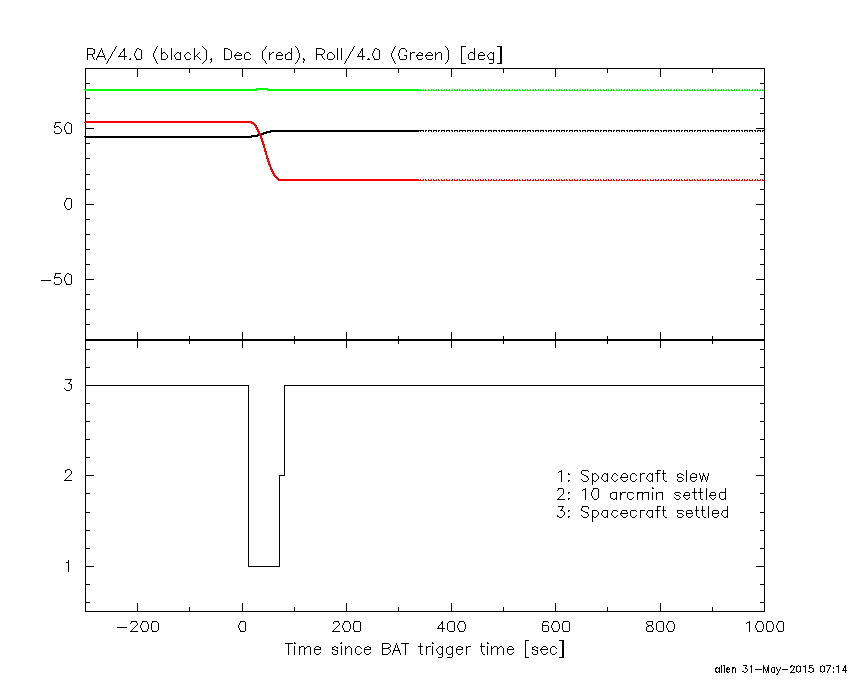
Spacecraft aspect plot
Bright source in the pre-burst/pre-slew/post-slew images
Pre-burst image of 15-350 keV band
Time interval of the image:
-239.856000 -5.960000

# RAcent  DECcent POSerr Theta    Phi  PeakCts   SNR AngSep     Name
#  [deg]    [deg]    ['] [deg]  [deg]                   [']
146.9026   7.6799    2.9  53.4 -171.8   1.8031   3.9 ------	UNKNOWN
Pre-slew background subtracted image of 15-350 keV band
Time interval of the image:
-5.960000 11.844600

# RAcent  DECcent POSerr Theta    Phi  PeakCts   SNR AngSep     Name
#  [deg]    [deg]    ['] [deg]  [deg]                   [']
194.9636  15.9101    0.3  40.5  123.2  25.4095  35.5 ------	UNKNOWN
252.1039  43.0439    3.6  47.1   39.4   2.3282   3.2 ------	UNKNOWN
250.1350  45.4818    2.9  44.5   38.0   1.8868   4.0 ------	UNKNOWN
240.1347  50.6916    2.6  36.1   37.2   1.1630   4.4 ------	UNKNOWN
 56.3247  72.6017    3.1  47.0  -53.1   1.2691   3.8 ------	UNKNOWN
Post-slew image of 15-350 keV band
Time interval of the image:
71.044600 962.180400

# RAcent  DECcent POSerr Theta    Phi  PeakCts   SNR AngSep     Name
#  [deg]    [deg]    ['] [deg]  [deg]                   [']
194.9602  15.8976    1.9   0.0  121.1   2.9136   6.1 ------	UNKNOWN
152.1713 -25.9990    3.5  59.1 -166.1  11.5649   3.3 ------	UNKNOWN
168.1982  23.7763    5.0  26.3  -99.8   1.4071   2.3 ------	UNKNOWN
171.4489  63.9822    4.8  50.7  -44.5   6.4771   2.4 ------	UNKNOWN