Analysis Summary
Notes:
- 1) No attempt has been made to eliminate the non-significant decimal places.
- 2) This batgrbproduct analysis is done using the HEASARC data.
- 3) This batgrbproduct analysis is using the flight position for the mask-weighting calculation.
======================================================================
BAT GRB EVENT DATA PROCESSING REPORT
Process Script Ver: batgrbproduct v2.46
Process Start Time: Mon Jan 20 01:08:15 EST 2014
Host Name: batevent1
Current Working Dir: /local/data/batevent/batevent_reproc/trigger313954
======================================================================
Trigger: 00313954 Segment: 000
BAT Trigger Time: 235048360.832 [s; MET]
Trigger Stop: 235048361.088 [s; MET]
UTC: 2008-06-13T11:12:37.968880 [includes UTCF correction]
Where From?: TDRSS position message
BAT
RA: 173.79663866518 Dec: -7.09837558340558 [deg; J2000]
Catalogged Source?: NO
Point Source?: YES
GRB Indicated?: YES [ by BAT flight software ]
Image S/N Ratio: 11.32
Image Trigger?: NO
Rate S/N Ratio: 57.0087712549569 [ if not an image trigger ]
Image S/N Ratio: 11.32
Analysis Position: [ source = BAT ]
RA: 173.79663866518 Dec: -7.09837558340558 [deg; J2000]
Refined Position: [ source = BAT pre-slew burst ]
RA: 173.805091560328 Dec: -7.10155640158559 [deg; J2000]
{ 11h 35m 13.2s , -07d 06' 05.6" }
+/- 0.616732357783413 [arcmin] (estimated 90% radius based on SNR)
+/- 0.204414511703529 [arcmin] (formal 1-sigma fit error)
SNR: 60.6708650546367
Angular difference between the analysis and refined position is 0.538255 arcmin
Partial Coding Fraction: 0.890625 [ including projection effects ]
Duration
T90: 79.4480000138283 +/- 9.4565693400353
Measured from: -1.3759999871254
to: 78.0720000267029 [s; relative to TRIGTIME]
T50: 25.8240000009537 +/- 1.42303899224837
Measured from: 6.95200002193451
to: 32.7760000228882 [s; relative to TRIGTIME]
Fluence
Peak Flux (peak 1 second)
Measured from: 2.22800001502037
to: 3.22800001502037 [s; relative to TRIGTIME]
Total Fluence
Measured from: -5.283999979496
to: 129.836000025272 [s; relative to TRIGTIME]
Band 1 Band 2 Band 3 Band 4
15-25 25-50 50-100 100-350 keV
Total 2.076983 3.170205 2.655151 0.891102
0.059143 0.062684 0.056408 0.049633 [error]
Peak 0.055471 0.109308 0.140689 0.059798
0.006231 0.007391 0.007560 0.006723 [error]
[ fluence units of on-axis counts / fully illuminated detector ]
======================================================================
====== Table of the duration information =============================
Value tstart tstop
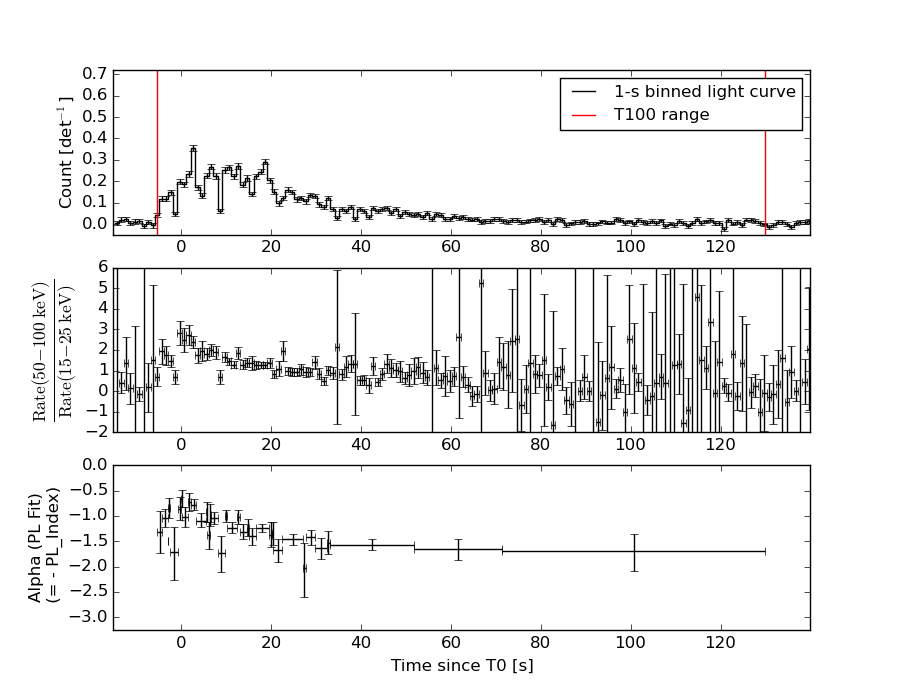
T100 135.120 -5.284 129.836
T90 79.448 -1.376 78.072
T50 25.824 6.952 32.776
Peak 1.000 2.228 3.228
====== Spectral Analysis Summary =====================================
Model : spectral model: simple power-law (PL) and cutoff power-law (CPL)
Ph_index : photon index: E^{Ph_index}
Ph_90err : 90% error of the photon index
Epeak : Epeak in keV
Epeak_90err: 90% error of Epeak
Norm : normalization at 50 keV in both the PL model and CPL model
Nomr_90err : 90% error of the normalization
chi2 : Chi-Squared
dof : degree of freedo
=== Time-averaged spectral analysis ===
(Best model with acceptable fit: PL)
Model Ph_index Ph_90err_low Ph_90err_hi Epeak Epeak_90err_low Epeak_90err_hi Norm Nomr_90err_low Norm_90err_hi chi2 dof
PL -1.332 -0.048 0.048 - - - 4.31e-03 -1.05e-04 1.05e-04 54.610 57
CPL -1.295 -0.082 0.054 999.053 -999.053 -999.053 4.49e-03 -2.68e-04 2.61e-04 55.610 56
=== 1-s peak spectral analysis ===
(Best model with acceptable fit: PL)
Model Ph_index Ph_90err_low Ph_90err_hi Epeak Epeak_90err_low Epeak_90err_hi Norm Nomr_90err_low Norm_90err_hi chi2 dof
PL -0.745 -0.116 0.119 - - - 2.39e-02 -1.58e-03 1.57e-03 54.310 57
CPL -0.738 -0.115 0.121 9999.350 -9999.350 -9999.350 2.40e-02 -1.43e-03 1.01e-02 54.330 56
=== Fluence/Peak Flux Summary ===
Model Band1 Band2 Band3 Band4 Band5 Total
15-25 25-50 50-100 100-350 15-150 15-350 keV
Fluence PL 6.36e-07 1.30e-06 2.06e-06 7.27e-06 5.72e-06 1.13e-05 erg/cm2
90%_error_low -3.32e-08 -3.88e-08 -5.91e-08 -4.90e-07 -1.47e-07 -5.15e-07 erg/cm2
90%_error_hi 3.39e-08 3.87e-08 5.89e-08 5.15e-07 1.47e-07 5.37e-07 erg/cm2
Peak flux PL 4.78e-01 7.58e-01 9.04e-01 2.10e+00 2.75e+00 4.24e+00 ph/cm2/s
90%_error_low -6.82e-02 -6.68e-02 -5.85e-02 -2.96e-01 -1.75e-01 -3.17e-01 ph/cm2/s
90%_error_hi 7.21e-02 6.61e-02 5.83e-02 3.30e-01 1.76e-01 3.31e-01 ph/cm2/s
Fluence CPL 6.35e-07 1.29e-06 2.04e-06 7.46e-06 5.75e-06 1.12e-05 erg/cm2
90%_error_low N/A -3.27e-08 N/A -1.16e-06 -1.83e-07 -9.04e-07 erg/cm2
90%_error_hi N/A 4.48e-08 N/A 1.41e-08 1.11e-07 5.26e-07 erg/cm2
Peak flux CPL 4.77e-01 7.57e-01 9.01e-01 2.22e+00 2.75e+00 4.34e+00 ph/cm2/s
90%_error_low N/A -6.54e-02 -5.72e-02 -8.13e-01 -1.85e-01 -7.81e-01 ph/cm2/s
90%_error_hi N/A 6.89e-02 6.67e-02 -9.32e-02 1.79e-01 1.98e-01 ph/cm2/s
======================================================================
Image
Pre-slew 15.0-350.0 keV image (Event data)
#   RAcent    DECcent   POSerr    Theta     Phi              Peak Cts       SNR   Name
  173.8051    -7.1016   0.0032    24.1816     4.5992         3.6077364     60.671 TRIG_00313954

Foreground time interval of the image:
 -5.284  13.069 (delta_t =  18.353 [sec])
Background time interval of the image:
-239.832  -5.284 (delta_t = 234.548 [sec])
Light Curves
Note: The mask-weighted lightcurves have units of either count/det or counts/sec/det, where a det is 0.4 x 0.4 = 0.16 sq cm.
Full-time range; 1 s binning
Other quick-look light curves:
- 64 ms binning (zoomed)
- 16 ms binning (zoomed)
- 8 ms binning (zoomed)
- 2 ms binning (zoomed)
- SN=5 or 10 s binning (full-time range)
- Raw light curve
Spectra
- 64 ms binning (zoomed)
- 16 ms binning (zoomed)
- 8 ms binning (zoomed)
- 2 ms binning (zoomed)
- SN=5 or 10 s binning (full-time range)
- Raw light curve
Spectra
Notes:
- 1) The fitting includes the systematic errors.
- 2) When the burst includes telescope slew time periods, the fitting uses an average response file made from multiple 5-s response files through out the slew time plus single time preiod for the non-slew times, and weighted by the total counts in the corresponding time period using addrmf. An average response file is needed becuase a spectral fit using the pre-slew DRM will introduce some errors in both a spectral shape and a normalization if the PHA file contains a lot of the slew/post-slew time interval.
- 3) For fits to more complicated models (e.g. a power-law over a cutoff power-law), the BAT team has decided to require a chi-square improvement of more than 6 for each extra dof.
Time averaged spectrum fit using the average DRM
Power-law model
Time interval is from   -5.284 sec. to  129.836 sec.

Spectral model in power-law:
------------------------------------------------------------
Parameters  : value       lower 90%   higher 90%
Photon index: -1.33212     ( -0.0476329   0.047855 )
Norm@50keV  : 4.31470E-03    ( -0.000104787   0.000104732 )
------------------------------------------------------------
#Fit statistic : Chi-Squared =          54.61 using 59 PHA bins.
# Reduced chi-squared =         0.9580 for     57 degrees of freedom
# Null hypothesis probability =   5.654444e-01

Photon flux (15-150 keV)    in 135.1 sec: 0.517927 ( -0.01391  0.013968 ) ph/cm2/s
Energy fluence (15-150 keV)             : 5.71709e-06 ( -1.46579e-07  1.46924e-07 ) ergs/cm2
Cutoff power-law model
Time interval is from   -5.284 sec. to  129.836 sec.
Spectral model in the cutoff power-law:
------------------------------------------------------------
Parameters  : value       lower 90%   higher 90%
Photon index: -1.33043     ( -0.0463028   0.0893692 )
Epeak [keV] : 9999.36      ( -9999.36 -9999.36 )
Norm@50keV  : 4.32258E-03    ( -0.00010468   0.000423743 )
------------------------------------------------------------
#Fit statistic : Chi-Squared =          54.72 using 59 PHA bins.
# Reduced chi-squared =         0.9771 for     56 degrees of freedom
# Null hypothesis probability =   5.235897e-01

Photon flux (15-150 keV)    in 135.1 sec: 0.522152 ( -0.018279  0.009582 ) ph/cm2/s
Energy fluence (15-150 keV)             : 5.75169e-06 ( -1.82846e-07  1.1057e-07 ) ergs/cm2
1-s peak spectrum fit
Power-law model
Time interval is from    2.228 sec. to    3.228 sec.

Spectral model in power-law:
------------------------------------------------------------
Parameters  : value       lower 90%   higher 90%
Photon index: -0.744502     ( -0.115558   0.118734 )
Norm@50keV  : 2.38537E-02    ( -0.00157979   0.00156619 )
------------------------------------------------------------
#Fit statistic : Chi-Squared =          54.31 using 59 PHA bins.
# Reduced chi-squared =         0.9528 for     57 degrees of freedom
# Null hypothesis probability =   5.766764e-01

Photon flux (15-150 keV)    in 1 sec: 2.74876 ( -0.17531  0.17561 ) ph/cm2/s
Energy fluence (15-150 keV)             : 2.85496e-07 ( -1.93377e-08  1.94128e-08 ) ergs/cm2
Cutoff power-law model

Time interval is from    2.228 sec. to    3.228 sec.
Spectral model in the cutoff power-law:
------------------------------------------------------------
Parameters  : value       lower 90%   higher 90%
Photon index: -0.738233     ( -0.115303   0.121279 )
Epeak [keV] : 9999.35      ( -9999.36 -9999.36 )
Norm@50keV  : 2.39681E-02    ( -0.00149821   0.0100607 )
------------------------------------------------------------
#Fit statistic : Chi-Squared =          54.33 using 59 PHA bins.
# Reduced chi-squared =         0.9702 for     56 degrees of freedom
# Null hypothesis probability =   5.381642e-01

Photon flux (15-150 keV)    in 1 sec: 2.75142 ( -0.1849  0.17943 ) ph/cm2/s
Energy fluence (15-150 keV)             : 2.86108e-07 ( 0  0 ) ergs/cm2
Time-resolved spectra
Distribution
T90 vs. Hardness ratio plot
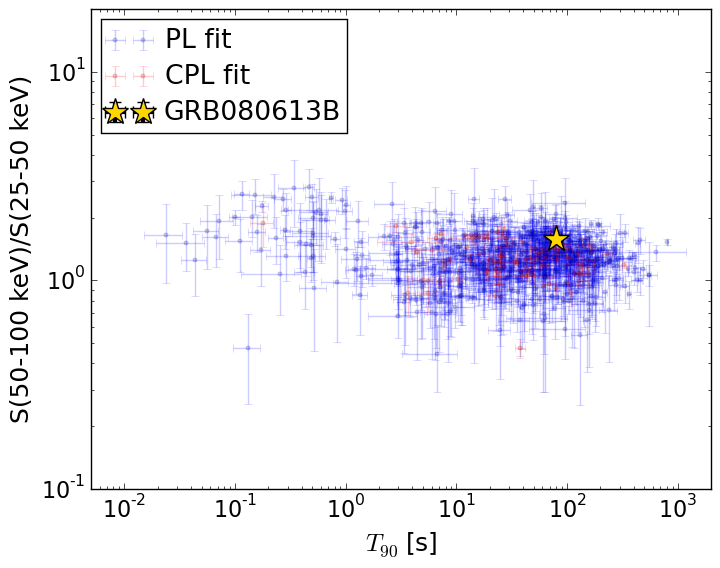
T90                                   = 79.448 sec.
Hardness ratio (energy fluence ratio) = 1.58880215892
S(15-50 keV) vs. S(50-150 keV) plot
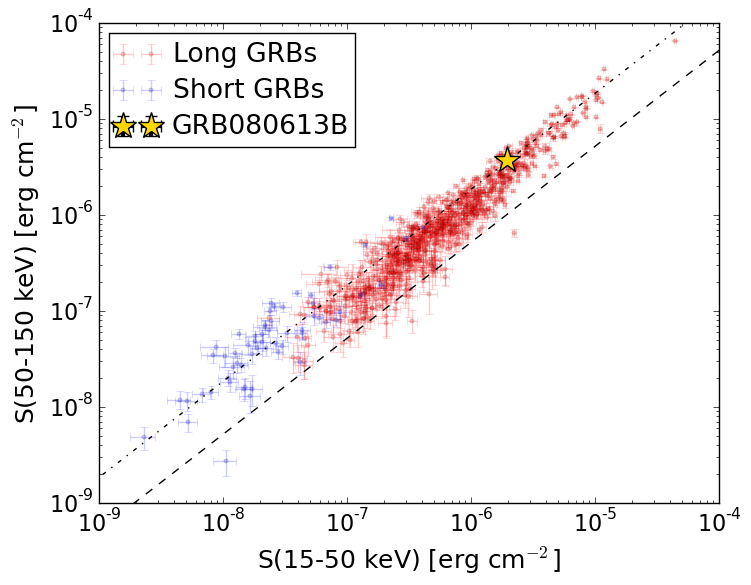
S(15-50 keV)  = 1.9315347e-06
S(50-150 keV) = 3.785646e-06
The dash-dotted line and the dashed line traces the fluences calculated from the Band function with Epeak = 15 and 150 keV, respectively. Both lines assume a canonical values of alpha = -1 and beta = -2.5.
Mask shadow pattern
IMX = 4.475861496632544E-01, IMY = -3.600562921280936E-02
Spacecraft aspect plot
Bright source in the pre-burst/pre-slew/post-slew images
Pre-burst image of 15-350 keV band
Time interval of the image:
-239.832000 -5.284000

# RAcent  DECcent POSerr Theta    Phi  PeakCts   SNR AngSep     Name
#  [deg]    [deg]    ['] [deg]  [deg]                   [']
135.5262 -40.5481    0.4  23.9 -163.0   4.7210  25.9    0.4	Vela X-1
170.4539 -60.6026    2.5  34.4  138.0   1.4653   4.6    4.2	Cen X-3
186.6113 -62.7166    7.2  39.9  128.5   0.8148   1.6    3.5	GX 301-2
193.3668 -31.7757    2.4  29.8   74.9   1.4103   4.9 ------	UNKNOWN
169.8290 -24.6541    2.4   9.7   45.6   0.7685   4.9 ------	UNKNOWN
183.5003   7.1500    2.5  41.4    5.3   1.2945   4.6 ------	UNKNOWN
 86.2651 -49.6195    3.5  59.1 -166.2   4.2633   3.3 ------	UNKNOWN
138.3801   7.2071    2.4  39.8  -66.2   2.7638   4.9 ------	UNKNOWN
 95.0508 -32.7315    4.9  55.2 -145.1   2.8397   2.4 ------	UNKNOWN
145.5851  19.3666    2.9  48.3  -50.0   3.9908   3.9 ------	UNKNOWN
Pre-slew background subtracted image of 15-350 keV band
Time interval of the image:
-5.284000 13.068600

# RAcent  DECcent POSerr Theta    Phi  PeakCts   SNR AngSep     Name
#  [deg]    [deg]    ['] [deg]  [deg]                   [']
135.4289 -40.5961    2.6  24.0 -163.0  -0.2312  -4.4    5.2	Vela X-1
169.9036 -60.6996    0.0  34.4  138.5   0.1280   1.3   13.0	Cen X-3
186.6276 -62.6391    5.4  39.8  128.4  -0.3118  -2.1    7.9	GX 301-2
184.1285 -73.9759    2.2  48.7  138.7   1.3279   5.2 ------	UNKNOWN
197.0017  12.0616    2.0  53.5   15.5   1.4076   5.9 ------	UNKNOWN
173.8051  -7.1016    0.2  24.2    4.6   3.6078  60.7 ------	UNKNOWN
Post-slew image of 15-350 keV band
Time interval of the image:
58.668600 962.203800

# RAcent  DECcent POSerr Theta    Phi  PeakCts   SNR AngSep     Name
#  [deg]    [deg]    ['] [deg]  [deg]                   [']
135.5348 -40.5506    0.7  47.8 -163.3  16.8993  16.3    0.4	Vela X-1
170.5251 -60.6502    5.9  53.6  159.2   5.1779   1.9    6.4	Cen X-3
198.2218 -41.4579    2.9  40.6  128.8   5.0031   4.0 ------	UNKNOWN
194.6408  29.0729    3.3  41.4    5.3   2.3605   3.5 ------	UNKNOWN
151.9474  39.4633    4.2  50.8  -44.5   7.9730   2.8 ------	UNKNOWN
125.3444 -17.4977    3.0  48.3 -129.9   7.6147   3.8 ------	UNKNOWN