Analysis Summary
Notes:
- 1) No attempt has been made to eliminate the non-significant decimal places.
- 2) This batgrbproduct analysis is done using the HEASARC data.
- 3) This batgrbproduct analysis is using the flight position for the mask-weighting calculation.
======================================================================
BAT GRB EVENT DATA PROCESSING REPORT
Process Script Ver: batgrbproduct v2.46
Process Start Time: Mon Jan 20 01:01:27 EST 2014
Host Name: batevent1
Current Working Dir: /local/data/batevent/batevent_reproc/trigger315080
======================================================================
Trigger: 00315080 Segment: 000
BAT Trigger Time: 235909531.328 [s; MET]
Trigger Stop: 235909531.84 [s; MET]
UTC: 2008-06-23T10:25:28.440240 [includes UTCF correction]
Where From?: TDRSS position message
BAT
RA: 237.659837169095 Dec: -62.0380947683357 [deg; J2000]
Catalogged Source?: NO
Point Source?: YES
GRB Indicated?: YES [ by BAT flight software ]
Image S/N Ratio: 7.53
Image Trigger?: NO
Rate S/N Ratio: 12.0415945787923 [ if not an image trigger ]
Image S/N Ratio: 7.53
Analysis Position: [ source = BAT ]
RA: 237.659837169095 Dec: -62.0380947683357 [deg; J2000]
Refined Position: [ source = BAT pre-slew burst ]
RA: 237.668441406388 Dec: -62.0455425189205 [deg; J2000]
{ 15h 50m 40.4s , -62d 02' 44.0" }
+/- 1.38246549980321 [arcmin] (estimated 90% radius based on SNR)
+/- 0.654216412067809 [arcmin] (formal 1-sigma fit error)
SNR: 19.1506563344011
Angular difference between the analysis and refined position is 0.508202 arcmin
Partial Coding Fraction: 0.3320312 [ including projection effects ]
Duration
T90: 15.0959999859333 +/- 5.118077772016
Measured from: -0.159999996423721
to: 14.9359999895096 [s; relative to TRIGTIME]
T50: 6.26800003647804 +/- 0.972306533017859
Measured from: 1.35599997639656
to: 7.6240000128746 [s; relative to TRIGTIME]
Fluence
Peak Flux (peak 1 second)
Measured from: 7.22799998521805
to: 8.22799998521805 [s; relative to TRIGTIME]
Total Fluence
Measured from: -0.672000020742416
to: 15.972000002861 [s; relative to TRIGTIME]
Band 1 Band 2 Band 3 Band 4
15-25 25-50 50-100 100-350 keV
Total 0.380995 0.540481 0.502730 0.148680
0.039855 0.041942 0.038905 0.038140 [error]
Peak 0.049724 0.096819 0.075989 0.024772
0.010300 0.011602 0.010847 0.009322 [error]
[ fluence units of on-axis counts / fully illuminated detector ]
======================================================================
====== Table of the duration information =============================
Value tstart tstop
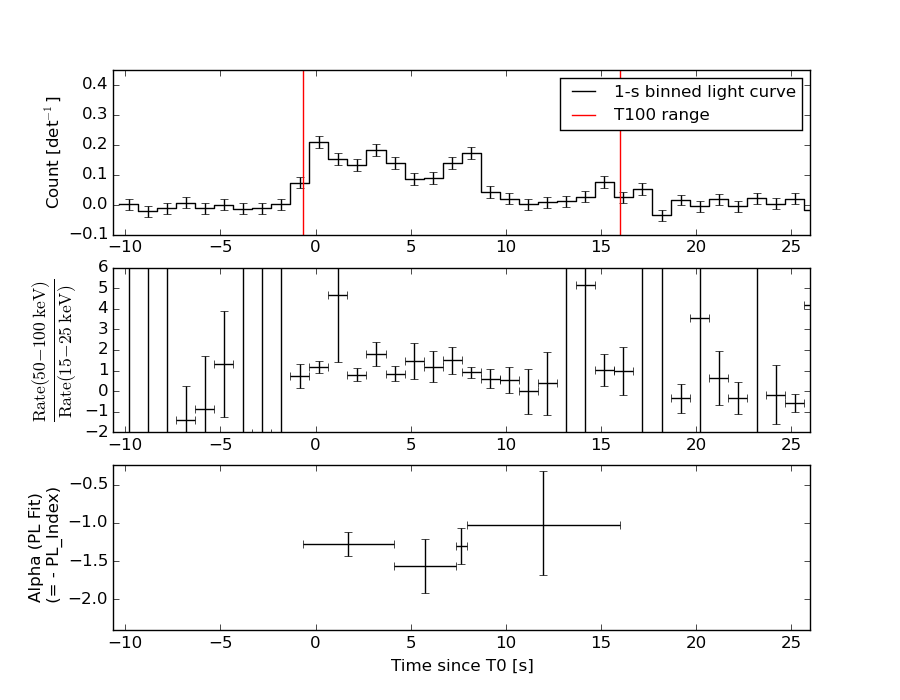
T100 16.644 -0.672 15.972
T90 15.096 -0.160 14.936
T50 6.268 1.356 7.624
Peak 1.000 7.228 8.228
====== Spectral Analysis Summary =====================================
Model : spectral model: simple power-law (PL) and cutoff power-law (CPL)
Ph_index : photon index: E^{Ph_index}
Ph_90err : 90% error of the photon index
Epeak : Epeak in keV
Epeak_90err: 90% error of Epeak
Norm : normalization at 50 keV in both the PL model and CPL model
Nomr_90err : 90% error of the normalization
chi2 : Chi-Squared
dof : degree of freedo
=== Time-averaged spectral analysis ===
(Best model with acceptable fit: PL)
Model Ph_index Ph_90err_low Ph_90err_hi Epeak Epeak_90err_low Epeak_90err_hi Norm Nomr_90err_low Norm_90err_hi chi2 dof
PL -1.271 -0.150 0.150 - - - 6.39e-03 -5.10e-04 5.10e-04 66.800 57
CPL -1.267 -0.151 0.152 9998.760 -9998.760 -9998.760 6.41e-03 -6.41e-03 4.38e-03 66.800 56
=== 1-s peak spectral analysis ===
(Best model with acceptable fit: PL)
Model Ph_index Ph_90err_low Ph_90err_hi Epeak Epeak_90err_low Epeak_90err_hi Norm Nomr_90err_low Norm_90err_hi chi2 dof
PL -1.286 -0.230 0.230 - - - 1.60e-02 -2.28e-03 2.27e-03 49.680 57
CPL -0.095 -1.079 1.495 80.221 -21.620 237.392 6.37e-02 -6.37e-02 2.86e-01 46.060 56
=== Fluence/Peak Flux Summary ===
Model Band1 Band2 Band3 Band4 Band5 Total
15-25 25-50 50-100 100-350 15-150 15-350 keV
Fluence PL 1.10e-07 2.32e-07 3.84e-07 1.44e-06 1.06e-06 2.17e-06 erg/cm2
90%_error_low -1.68e-08 -2.12e-08 -3.85e-08 -3.05e-07 -9.48e-08 -3.32e-07 erg/cm2
90%_error_hi 1.77e-08 2.10e-08 3.81e-08 3.60e-07 9.56e-08 3.78e-07 erg/cm2
Peak flux PL 5.38e-01 6.15e-01 5.04e-01 6.93e-01 1.91e+00 2.35e+00 ph/cm2/s
90%_error_low -1.27e-01 -9.54e-02 -8.58e-02 -2.12e-01 -2.71e-01 -3.46e-01 ph/cm2/s
90%_error_hi 1.35e-01 9.43e-02 8.49e-02 2.62e-01 2.72e-01 3.54e-01 ph/cm2/s
Fluence CPL 1.11e-07 2.31e-07 3.82e-07 1.47e-06 1.06e-06 2.16e-06 erg/cm2
90%_error_low -2.60e-08 -2.13e-08 -4.34e-08 -8.21e-07 -1.18e-07 -7.17e-07 erg/cm2
90%_error_hi 2.04e-08 2.31e-08 5.13e-08 3.83e-07 8.14e-08 1.89e-07 erg/cm2
Peak flux CPL 4.34e-01 6.85e-01 5.51e-01 2.26e-01 1.83e+00 1.90e+00 ph/cm2/s
90%_error_low -1.54e-01 -1.18e-01 -1.02e-01 N/A -2.85e-01 -3.28e-01 ph/cm2/s
90%_error_hi 1.63e-01 1.25e-01 1.04e-01 N/A 2.83e-01 4.39e-01 ph/cm2/s
======================================================================
Image
Pre-slew 15.0-350.0 keV image (Event data)
#   RAcent    DECcent   POSerr    Theta     Phi              Peak Cts       SNR   Name
  237.6684   -62.0455   0.0100    31.2902   107.4480         1.6282712     19.151 TRIG_00315080

Foreground time interval of the image:
 -0.672  15.972 (delta_t =  16.644 [sec])
Background time interval of the image:
-299.227  -0.672 (delta_t = 298.555 [sec])
Light Curves
Note: The mask-weighted lightcurves have units of either count/det or counts/sec/det, where a det is 0.4 x 0.4 = 0.16 sq cm.
Full-time range; 1 s binning
Other quick-look light curves:
- 64 ms binning (zoomed)
- 16 ms binning (zoomed)
- 8 ms binning (zoomed)
- 2 ms binning (zoomed)
- SN=5 or 10 s binning (full-time range)
- Raw light curve
Spectra
- 64 ms binning (zoomed)
- 16 ms binning (zoomed)
- 8 ms binning (zoomed)
- 2 ms binning (zoomed)
- SN=5 or 10 s binning (full-time range)
- Raw light curve
Spectra
Notes:
- 1) The fitting includes the systematic errors.
- 2) When the burst includes telescope slew time periods, the fitting uses an average response file made from multiple 5-s response files through out the slew time plus single time preiod for the non-slew times, and weighted by the total counts in the corresponding time period using addrmf. An average response file is needed becuase a spectral fit using the pre-slew DRM will introduce some errors in both a spectral shape and a normalization if the PHA file contains a lot of the slew/post-slew time interval.
- 3) For fits to more complicated models (e.g. a power-law over a cutoff power-law), the BAT team has decided to require a chi-square improvement of more than 6 for each extra dof.
Time averaged spectrum fit using the average DRM
Power-law model
Time interval is from   -0.672 sec. to   15.972 sec.

Spectral model in power-law:
------------------------------------------------------------
Parameters  : value       lower 90%   higher 90%
Photon index: -1.27144     ( -0.149756   0.150421 )
Norm@50keV  : 6.38708E-03    ( -0.000510119   0.00050991 )
------------------------------------------------------------
#Fit statistic : Chi-Squared =          66.80 using 59 PHA bins.
# Reduced chi-squared =          1.172 for     57 degrees of freedom
# Null hypothesis probability =   1.758210e-01

Photon flux (15-150 keV)    in 16.64 sec: 0.758138 ( -0.062639  0.062832 ) ph/cm2/s
Energy fluence (15-150 keV)             : 1.05787e-06 ( -9.48131e-08  9.56422e-08 ) ergs/cm2
Cutoff power-law model

Time interval is from   -0.672 sec. to   15.972 sec.
Spectral model in the cutoff power-law:
------------------------------------------------------------
Parameters  : value       lower 90%   higher 90%
Photon index: -1.2673     ( -0.150836   0.152385 )
Epeak [keV] : 9998.76      ( -9998.99 -9998.99 )
Norm@50keV  : 6.41484E-03    ( -0.00641482   0.00438226 )
------------------------------------------------------------
#Fit statistic : Chi-Squared =          66.80 using 59 PHA bins.
# Reduced chi-squared =          1.193 for     56 degrees of freedom
# Null hypothesis probability =   1.529744e-01

Photon flux (15-150 keV)    in 16.64 sec: 0.757974 (    ) ph/cm2/s
Energy fluence (15-150 keV)             : 1.06285e-06 ( -1.17959e-07  8.14293e-08 ) ergs/cm2
1-s peak spectrum fit
Power-law model
Time interval is from    7.228 sec. to    8.228 sec.

Spectral model in power-law:
------------------------------------------------------------
Parameters  : value       lower 90%   higher 90%
Photon index: -1.28604     ( -0.230203   0.2303 )
Norm@50keV  : 1.60441E-02    ( -0.00227505   0.0022705 )
------------------------------------------------------------
#Fit statistic : Chi-Squared =          49.68 using 59 PHA bins.
# Reduced chi-squared =         0.8716 for     57 degrees of freedom
# Null hypothesis probability =   7.435466e-01

Photon flux (15-150 keV)    in 1 sec: 1.90929 ( -0.27144  0.27178 ) ph/cm2/s
Energy fluence (15-150 keV)             : 1.59107e-07 ( -2.51424e-08  2.54668e-08 ) ergs/cm2
Cutoff power-law model
Time interval is from    7.228 sec. to    8.228 sec.
Spectral model in the cutoff power-law:
------------------------------------------------------------
Parameters  : value       lower 90%   higher 90%
Photon index: -0.0950373     ( -1.07853   1.49459 )
Epeak [keV] : 80.2209      ( -21.6201 237.392 )
Norm@50keV  : 6.36741E-02    ( -0.0636741   0.285773 )
------------------------------------------------------------
#Fit statistic : Chi-Squared =          46.06 using 59 PHA bins.
# Reduced chi-squared =         0.8226 for     56 degrees of freedom
# Null hypothesis probability =   8.256105e-01

Photon flux (15-150 keV)    in 1 sec: 1.82998 ( -0.28475  0.28286 ) ph/cm2/s
Energy fluence (15-150 keV)             : 5.51417e-08 ( -4.8258e-08  8.29491e-09 ) ergs/cm2
Time-resolved spectra
Distribution
T90 vs. Hardness ratio plot
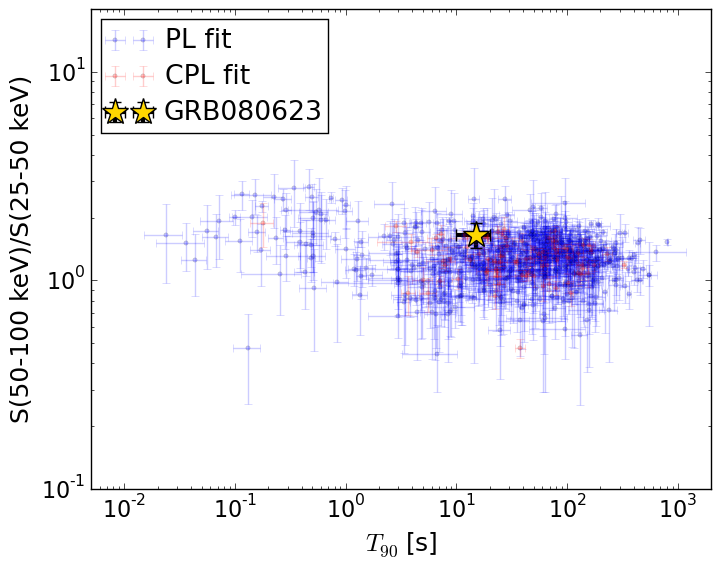
T90                                   = 15.096 sec.
Hardness ratio (energy fluence ratio) = 1.65702875489
S(15-50 keV) vs. S(50-150 keV) plot
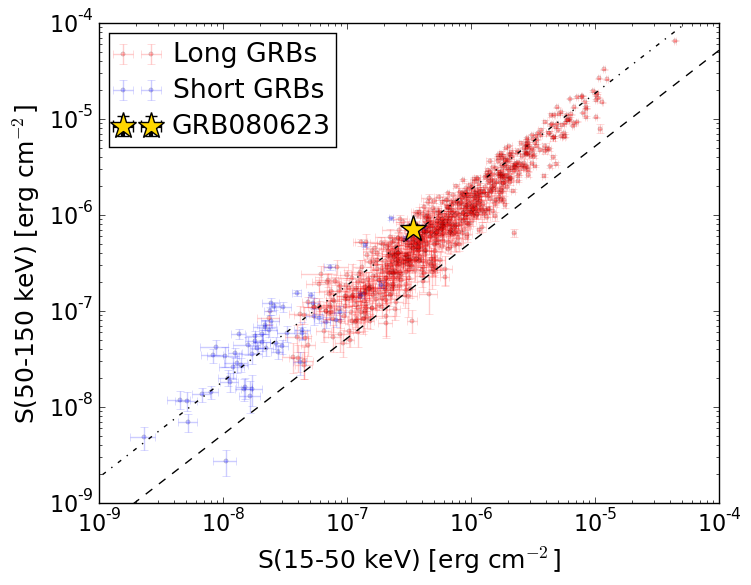
S(15-50 keV)  = 3.412625e-07
S(50-150 keV) = 7.166181e-07
The dash-dotted line and the dashed line traces the fluences calculated from the Band function with Epeak = 15 and 150 keV, respectively. Both lines assume a canonical values of alpha = -1 and beta = -2.5.
Mask shadow pattern
IMX = -1.822349757174955E-01, IMY = -5.798109609086134E-01
Spacecraft aspect plot
Bright source in the pre-burst/pre-slew/post-slew images
Pre-burst image of 15-350 keV band
Time interval of the image:
-299.227410 -0.672000

# RAcent  DECcent POSerr Theta    Phi  PeakCts   SNR AngSep     Name
#  [deg]    [deg]    ['] [deg]  [deg]                   [']
135.5503 -40.5555    1.1  28.9  -80.1   3.4765  10.6    1.0	Vela X-1
170.3005 -60.6568    0.9   0.8  165.8   2.9838  12.8    2.1	Cen X-3
186.8885 -62.6248    3.1   8.4  100.3   0.8204   3.7   10.8	GX 301-2
301.8303 -72.6110    3.5  43.5  144.8   2.0913   3.3 ------	UNKNOWN
186.6590 -54.3434    2.9  10.4   49.1   0.9035   3.9 ------	UNKNOWN
 52.7719 -73.2096    2.9  40.5 -173.0   1.4213   4.1 ------	UNKNOWN
 27.4030 -61.2813    3.2  55.6 -175.6   3.5129   3.6 ------	UNKNOWN
128.7580 -48.6088    5.4  26.2  -99.6   0.7236   2.1 ------	UNKNOWN
Pre-slew background subtracted image of 15-350 keV band
Time interval of the image:
-0.672000 15.972000

# RAcent  DECcent POSerr Theta    Phi  PeakCts   SNR AngSep     Name
#  [deg]    [deg]    ['] [deg]  [deg]                   [']
135.7080 -40.6297    4.7  28.8  -79.9  -0.1589  -2.5    9.3	Vela X-1
170.3009 -60.4647   14.8   0.6  166.3   0.0349   0.8    9.5	Cen X-3
186.3328 -62.7229    5.5   8.2  101.4   0.0982   2.1    9.3	GX 301-2
237.6684 -62.0455    0.6  31.3  107.4   1.6283  19.2 ------	UNKNOWN
 78.3178 -75.1230    2.4  33.8 -168.7   0.2657   4.8 ------	UNKNOWN
135.2435 -24.5822    1.9  42.8  -66.5   1.0832   6.1 ------	UNKNOWN
Post-slew image of 15-350 keV band
Time interval of the image:
1307.272590 1389.742600

# RAcent  DECcent POSerr Theta    Phi  PeakCts   SNR AngSep     Name
#  [deg]    [deg]    ['] [deg]  [deg]                   [']
170.2844 -60.6769    3.9  30.8  -75.7   0.4616   3.0    3.4	Cen X-3
187.0053 -62.6356    0.0  22.9  -71.6   0.0449   0.4   12.5	GX 301-2
255.8687 -37.7418    7.1  26.8   75.9   0.2227   1.6    8.3	4U 1700-377
256.2658 -36.4673    5.0  28.1   75.6   0.3327   2.3    8.6	GX 349+2
264.5682 -44.3920   10.5  23.6   96.6   0.1332   1.1    8.3	4U 1735-44
275.8636 -30.3524    4.3  40.2   98.4   1.0996   2.7    3.3	H1820-303
262.7919 -33.8681    7.7  32.4   83.8   0.2915   1.5   10.0	GX 354-0
283.8861 -57.0048    2.5  23.5  141.3   0.4832   4.6 ------	UNKNOWN
  1.8708 -52.7524    3.1  57.1 -174.1   1.6574   3.7 ------	UNKNOWN
  4.7983 -52.1929    2.7  58.4 -172.5   2.3989   4.3 ------	UNKNOWN