Analysis Summary
Notes:
- 1) No attempt has been made to eliminate the non-significant decimal places.
- 2) This batgrbproduct analysis is done using the HEASARC data.
- 3) This batgrbproduct analysis is using the flight position for the mask-weighting calculation.
======================================================================
                  BAT GRB EVENT DATA PROCESSING REPORT
    Process Script Ver: batgrbproduct v2.46
    Process Start Time: Mon Jan 20 00:55:37 EST 2014
             Host Name: batevent1
   Current Working Dir: /local/data/batevent/batevent_reproc/trigger315615
======================================================================

  Trigger: 00315615      Segment: 000

  BAT Trigger Time: 236600020.544   [s; MET]
      Trigger Stop: 236600021.568   [s; MET]
               UTC: 2008-07-01T10:13:37.636600    [includes UTCF correction]
       Where From?: TDRSS position message

  BAT
    RA: 45.8375449298875   Dec: 75.4918923999807  [deg; J2000]

     Catalogged Source?: NO
     Point Source?:      YES
     GRB Indicated?:     YES    [ by BAT flight software ]
     Image S/N Ratio:    16.1
     Image Trigger?:     NO
     Rate S/N Ratio:     26.153393661244  [ if not an image trigger ]
     Image S/N Ratio:    16.1

  Analysis Position:   [ source = BAT ]
    RA: 45.8375449298875   Dec: 75.4918923999807  [deg; J2000]

  Refined Position:   [ source = BAT pre-slew burst ]
    RA: 45.9127869201079   Dec: 75.4795842537653  [deg; J2000]
        { 03h 03m 39.1s , +75d 28' 46.5" }
         +/- 1.35916552399682 [arcmin] (estimated 90% radius based on SNR)
         +/- 0.425668605946213 [arcmin] (formal 1-sigma fit error)
    SNR: 19.6213691595353

  Angular difference between the analysis and refined position is 1.351113 arcmin

  Partial Coding Fraction: 0.5546875    [ including projection effects ]

  Duration
     T90: 17.8160000145435 +/- 6.71978603572693
        Measured from: -2.07600000500679
                   to: 15.7400000095367     [s; relative to TRIGTIME]
     T50: 4.73600000143051 +/- 1.37488909679171
        Measured from: -0.571999996900558
                   to: 4.16400000452995     [s; relative to TRIGTIME]


  Fluence
     Peak Flux  (peak 1 second)
        Measured from: -0.104000002145767
                   to: 0.895999997854233     [s; relative to TRIGTIME]
     Total Fluence
        Measured from: -2.72799998521805
                   to: 22.4600000083447     [s; relative to TRIGTIME]

             Band 1     Band 2     Band 3     Band 4
              15-25      25-50     50-100    100-350     keV
 Total     0.574259   0.555610   0.251320   0.066565
           0.034911   0.036277   0.032957   0.031352 [error]
 Peak      0.101926   0.108407   0.044157   0.009218
           0.008349   0.008538   0.007413   0.006439 [error]

     [ fluence units of on-axis counts / fully illuminated detector ]

======================================================================


====== Table of the duration information =============================

        Value   tstart    tstop
T100   25.188   -2.728   22.460
T90    17.816   -2.076   15.740
T50     4.736   -0.572    4.164
Peak    1.000   -0.104    0.896


====== Spectral Analysis Summary =====================================

Model      : spectral model: simple power-law (PL) and cutoff power-law (CPL)
Ph_index   : photon index: E^{Ph_index}
Ph_90err   : 90% error of the photon index
Epeak      : Epeak in keV
Epeak_90err: 90% error of Epeak
Norm       : normalization at 50 keV in both the PL model and CPL model
Nomr_90err : 90% error of the normalization
chi2       : Chi-Squared
dof        : degree of freedo

=== Time-averaged spectral analysis ===
(Best model with acceptable fit: PL)

Model Ph_index Ph_90err_low Ph_90err_hi  Epeak  Epeak_90err_low  Epeak_90err_hi  Norm       Nomr_90err_low    Norm_90err_hi    chi2    dof
PL      -2.119    -0.159      0.153       -           -               -         3.16e-03     -3.30e-04          3.25e-04      53.690   57
CPL     -1.646    -0.387      0.700       29.780      N/A           N/A         6.02e-03        N/A               N/A         51.880   56


=== 1-s peak spectral analysis ===
(Best model with acceptable fit: PL)

Model Ph_index Ph_90err_low Ph_90err_hi  Epeak  Epeak_90err_low  Epeak_90err_hi  Norm       Nomr_90err_low    Norm_90err_hi    chi2    dof
PL      -2.170     -0.183     0.173       -           -               -         1.43e-02     -1.84e-03          1.82e-03      58.330   57
CPL     -0.851     -0.850     1.030       32.761     -11.352         6.860      9.21e-02     -9.21e-02          3.17e-01      50.740   56


=== Fluence/Peak Flux Summary ===

              Model    Band1     Band2     Band3     Band4     Band5     Total
                       15-25     25-50    50-100    100-350    15-150    15-350    keV
Fluence         PL   1.82e-07  2.30e-07  2.12e-07  3.41e-07  7.41e-07  9.66e-07   erg/cm2
      90%_error_low -1.95e-08 -1.79e-08 -3.03e-08 -8.76e-08 -6.83e-08 -1.24e-07   erg/cm2
      90%_error_hi   2.00e-08  1.78e-08  3.12e-08  1.07e-07  6.98e-08  1.39e-07   erg/cm2
Peak flux       PL   1.12e+00  7.62e-01  3.39e-01  2.08e-01  2.33e+00  2.43e+00   ph/cm2/s
      90%_error_low -1.39e-01 -7.24e-02 -5.64e-02 -5.83e-02 -2.17e-01 -2.28e-01   ph/cm2/s
      90%_error_hi   1.42e-01  7.22e-02  5.81e-02  7.13e-02  2.17e-01  2.28e-01   ph/cm2/s

Fluence        CPL   1.76e-07  2.43e-07  2.03e-07  1.41e-07  7.00e-07  7.62e-07   erg/cm2
      90%_error_low -2.17e-08 -2.32e-08 -3.70e-08 -9.16e-08 -8.08e-08 -1.28e-07   erg/cm2
      90%_error_hi   2.17e-08  2.40e-08  3.48e-08  2.39e-07  8.56e-08  1.44e-07   erg/cm2
Peak flux      CPL   1.03e+00  8.77e-01  2.98e-01  3.64e-02  2.24e+00  2.24e+00   ph/cm2/s
      90%_error_low -1.56e-01 -1.01e-01 -7.78e-02 -3.64e-02 -2.19e-01 -2.22e-01   ph/cm2/s
      90%_error_hi   1.57e-01  1.03e-01  7.35e-02  7.00e-02  2.21e-01  2.26e-01   ph/cm2/s

======================================================================
Image
Pre-slew 15.0-350.0 keV image (Event data)
#   RAcent    DECcent   POSerr    Theta     Phi              Peak Cts       SNR   Name
   45.9128    75.4796   0.0098    27.1383   -68.0203         1.4262907     19.621 TRIG_00315615

Foreground time interval of the image:
 -2.728  22.460 (delta_t =  25.188 [sec])
Background time interval of the image:
-485.243 -443.492 (delta_t =  41.751 [sec])
-239.544  -2.728 (delta_t = 236.816 [sec])
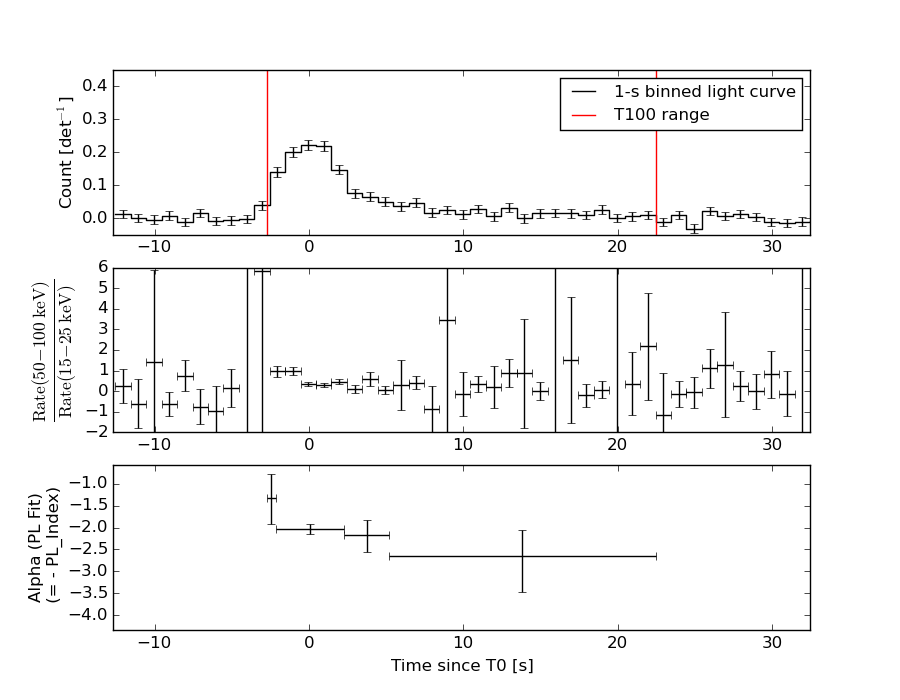
Light Curves
Note: The mask-weighted lightcurves have units of either count/det or counts/sec/det, where a det is 0.4 x 0.4 = 0.16 sq cm.
Full-time range; 1 s binning
Other quick-look light curves:
- 64 ms binning (zoomed)
- 16 ms binning (zoomed)
- 8 ms binning (zoomed)
- 2 ms binning (zoomed)
- SN=5 or 10 s binning (full-time range)
- Raw light curve
Spectra
- 64 ms binning (zoomed)
- 16 ms binning (zoomed)
- 8 ms binning (zoomed)
- 2 ms binning (zoomed)
- SN=5 or 10 s binning (full-time range)
- Raw light curve
Spectra
Notes:
- 1) The fitting includes the systematic errors.
- 2) When the burst includes telescope slew time periods, the fitting uses an average response file made from multiple 5-s response files through out the slew time plus single time preiod for the non-slew times, and weighted by the total counts in the corresponding time period using addrmf. An average response file is needed becuase a spectral fit using the pre-slew DRM will introduce some errors in both a spectral shape and a normalization if the PHA file contains a lot of the slew/post-slew time interval.
- 3) For fits to more complicated models (e.g. a power-law over a cutoff power-law), the BAT team has decided to require a chi-square improvement of more than 6 for each extra dof.
Time averaged spectrum fit using the average DRM
Power-law model
Time interval is from   -2.728 sec. to   22.460 sec.

Spectral model in power-law:
------------------------------------------------------------
Parameters  : value       lower 90%   higher 90%
Photon index: -2.11949     ( -0.159437   0.152677 )
Norm@50keV  : 3.15922E-03    ( -0.000330294   0.00032491 )
------------------------------------------------------------
#Fit statistic : Chi-Squared =          53.69 using 59 PHA bins.
# Reduced chi-squared =         0.9419 for     57 degrees of freedom
# Null hypothesis probability =   6.001044e-01

Photon flux (15-150 keV)    in 25.19 sec: 0.501907 ( -0.038263  0.038275 ) ph/cm2/s
Energy fluence (15-150 keV)             : 7.40984e-07 ( -6.83044e-08  6.98055e-08 ) ergs/cm2
Cutoff power-law model

Time interval is from   -2.728 sec. to   22.460 sec.
Spectral model in the cutoff power-law:
------------------------------------------------------------
Parameters  : value       lower 90%   higher 90%
Photon index: -1.64559     ( -0.38676   0.699769 )
Epeak [keV] : 29.7802      (   )
Norm@50keV  : 6.02330E-03    (     )
------------------------------------------------------------
#Fit statistic : Chi-Squared =          51.88 using 59 PHA bins.
# Reduced chi-squared =         0.9264 for     56 degrees of freedom
# Null hypothesis probability =   6.314736e-01

Photon flux (15-150 keV)    in 25.19 sec: 0.490773 ( -0.040564  0.040631 ) ph/cm2/s
Energy fluence (15-150 keV)             : 6.99839e-07 ( -8.07566e-08  8.56289e-08 ) ergs/cm2
1-s peak spectrum fit
Power-law model
Time interval is from   -0.104 sec. to    0.896 sec.

Spectral model in power-law:
------------------------------------------------------------
Parameters  : value       lower 90%   higher 90%
Photon index: -2.17038     ( -0.182714   0.173087 )
Norm@50keV  : 1.42676E-02    ( -0.00184292   0.00181589 )
------------------------------------------------------------
#Fit statistic : Chi-Squared =          58.33 using 59 PHA bins.
# Reduced chi-squared =          1.023 for     57 degrees of freedom
# Null hypothesis probability =   4.261152e-01

Photon flux (15-150 keV)    in 1 sec: 2.32610 ( -0.21651  0.21652 ) ph/cm2/s
Energy fluence (15-150 keV)             : 1.33638e-07 ( -1.50365e-08  1.53736e-08 ) ergs/cm2
Cutoff power-law model
Time interval is from   -0.104 sec. to    0.896 sec.
Spectral model in the cutoff power-law:
------------------------------------------------------------
Parameters  : value       lower 90%   higher 90%
Photon index: -0.851116     ( -0.850288   1.02952 )
Epeak [keV] : 32.7611      ( -11.352 6.85983 )
Norm@50keV  : 9.21156E-02    ( -0.0921125   0.316827 )
------------------------------------------------------------
#Fit statistic : Chi-Squared =          50.74 using 59 PHA bins.
# Reduced chi-squared =         0.9061 for     56 degrees of freedom
# Null hypothesis probability =   6.736613e-01

Photon flux (15-150 keV)    in 1 sec: 2.23764 ( -0.21938  0.22067 ) ph/cm2/s
Energy fluence (15-150 keV)             : 0 ( 0  0 ) ergs/cm2
Time-resolved spectra
Distribution
T90 vs. Hardness ratio plot
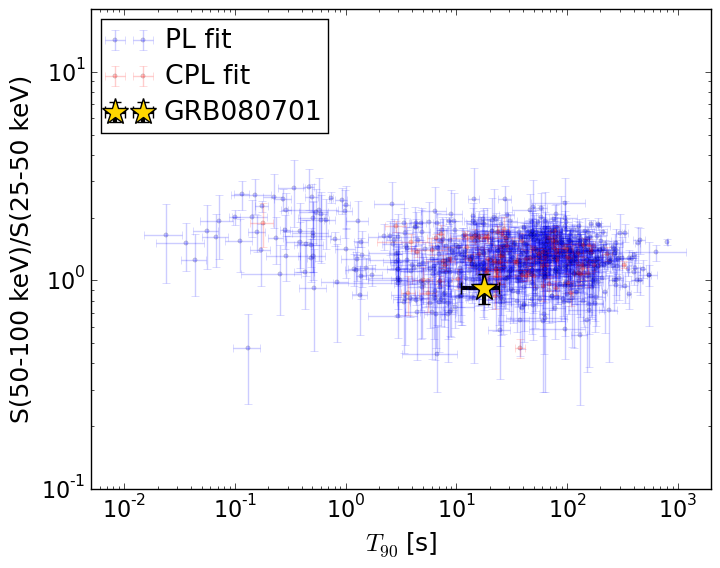
T90                                   = 17.816 sec.
Hardness ratio (energy fluence ratio) = 0.920555516246
S(15-50 keV) vs. S(50-150 keV) plot
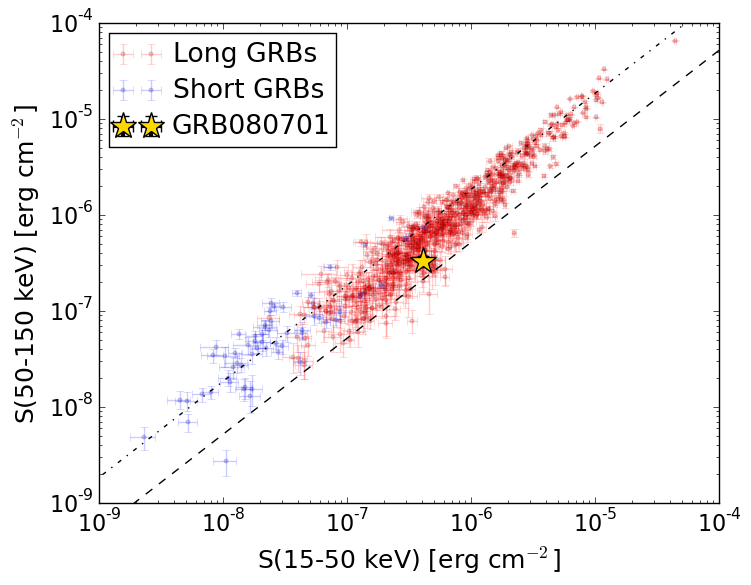
S(15-50 keV)  = 4.127925e-07
S(50-150 keV) = 3.282063e-07
The dash-dotted line and the dashed line traces the fluences calculated from the Band function with Epeak = 15 and 150 keV, respectively. Both lines assume a canonical values of alpha = -1 and beta = -2.5.
Mask shadow pattern
IMX = 1.918433682149012E-01, IMY = 4.753133698941900E-01
Spacecraft aspect plot
Bright source in the pre-burst/pre-slew/post-slew images
Pre-burst image of 15-350 keV band
Time interval of the image:
-485.243400 -443.492000
-239.544000 -2.728000

# RAcent  DECcent POSerr Theta    Phi  PeakCts   SNR AngSep     Name
#  [deg]    [deg]    ['] [deg]  [deg]                   [']
254.4913  35.2336    5.1  40.6  113.5   1.9299   2.3    6.7	Her X-1
299.6078  35.1972    0.7  41.2   56.3  10.8267  16.3    0.9	Cyg X-1
308.2852  40.8999   17.2  37.0   43.9   0.2685   0.7    8.5	Cyg X-3
325.9719  38.3015   18.2  43.2   24.6  -0.2807  -0.6    9.5	Cyg X-2
198.5852  57.1417    2.6  32.5 -171.8   0.9818   4.4 ------	UNKNOWN
172.9592  75.2812    2.5  23.3 -131.5   0.9824   4.6 ------	UNKNOWN
Pre-slew background subtracted image of 15-350 keV band
Time interval of the image:
-2.728000 22.460000

# RAcent  DECcent POSerr Theta    Phi  PeakCts   SNR AngSep     Name
#  [deg]    [deg]    ['] [deg]  [deg]                   [']
254.6193  35.3365    7.0  40.5  113.4  -0.3292  -1.6    7.9	Her X-1
299.7694  35.2514    7.4  41.1   56.1  -0.2881  -1.6    9.3	Cyg X-1
308.0567  40.9877   12.4  36.9   44.1   0.0901   0.9    3.2	Cyg X-3
326.0482  38.3620    8.3  43.2   24.5   0.1540   1.4    6.3	Cyg X-2
271.3869  43.4888    2.4  31.2   92.5   0.4318   4.9 ------	UNKNOWN
 45.9128  75.4796    0.6  27.1  -68.0   1.4263  19.6 ------	UNKNOWN
117.2505  62.9190    2.1  41.7 -107.6   1.1481   5.4 ------	UNKNOWN
Post-slew image of 15-350 keV band
Time interval of the image:
633.856600 962.514100

# RAcent  DECcent POSerr Theta    Phi  PeakCts   SNR AngSep     Name
#  [deg]    [deg]    ['] [deg]  [deg]                   [']
254.4441  35.3163    5.8  34.2 -169.5  -0.6007  -2.0    1.7	Her X-1
268.2537  -1.5282   32.2  42.7  126.8  -0.3595  -0.4    8.2	SW J1753.5-0127
288.7991  10.9414    0.6  22.4  102.2   5.7405  18.1    0.3	GRS 1915+105
299.5958  35.2023    0.2   4.3  -48.9  13.5539  56.9    0.3	Cyg X-1
308.0827  40.9276    1.2  13.1  -50.6   2.4461   9.3    2.0	Cyg X-3
325.9780  38.2419   13.7  25.2  -28.1   0.2193   0.8   10.3	Cyg X-2
344.1726   9.8943    2.5  49.9    9.5   2.9540   4.6 ------	UNKNOWN
343.6535  14.7201    3.6  46.9    4.4   1.7682   3.2 ------	UNKNOWN
358.0725  36.4623    3.9  50.7  -29.0   2.0816   2.9 ------	UNKNOWN
330.8357  68.5713    3.1  41.3  -77.5   4.0724   3.7 ------	UNKNOWN