Analysis Summary
Notes:
- 1) No attempt has been made to eliminate the non-significant decimal places.
- 2) This batgrbproduct analysis is done using the HEASARC data.
- 3) This batgrbproduct analysis is using the flight position for the mask-weighting calculation.
======================================================================
BAT GRB EVENT DATA PROCESSING REPORT
Process Script Ver: batgrbproduct v2.46
Process Start Time: Sun Jan 19 23:37:04 EST 2014
Host Name: batevent1
Current Working Dir: /local/data/batevent/batevent_reproc/trigger318832
======================================================================
Trigger: 00318832 Segment: 000
BAT Trigger Time: 239382744.064 [s; MET]
Trigger Stop: 239382748.16 [s; MET]
UTC: 2008-08-02T15:12:21.075860 [includes UTCF correction]
Where From?: TDRSS position message
BAT
RA: 270.748505066349 Dec: -32.3332776459289 [deg; J2000]
Catalogged Source?: NO
Point Source?: YES
GRB Indicated?: YES [ by BAT flight software ]
Image S/N Ratio: 7.06
Image Trigger?: NO
Rate S/N Ratio: 8.30662386291807 [ if not an image trigger ]
Image S/N Ratio: 7.06
Analysis Position: [ source = BAT ]
RA: 270.748505066349 Dec: -32.3332776459289 [deg; J2000]
Refined Position: [ source = BAT pre-slew burst ]
RA: 270.722875126477 Dec: -32.3301747866931 [deg; J2000]
{ 18h 02m 53.5s , -32d 19' 48.6" }
+/- 1.52684706467876 [arcmin] (estimated 90% radius based on SNR)
+/- 0.7207415890143 [arcmin] (formal 1-sigma fit error)
SNR: 16.6170269792582
Angular difference between the analysis and refined position is 1.312655 arcmin
Partial Coding Fraction: 1.015625 [ including projection effects ]
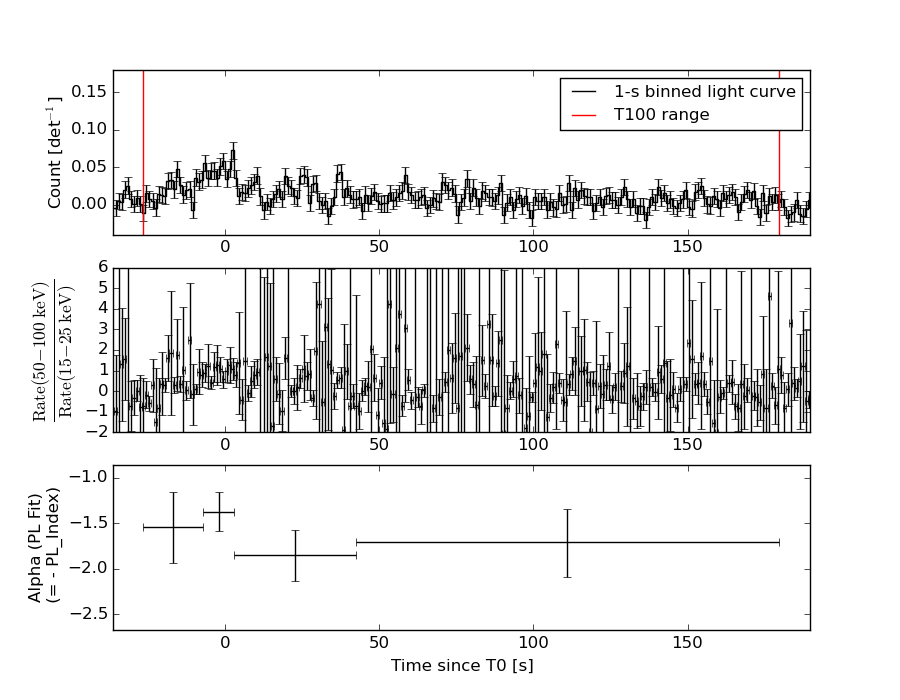
Duration
T90: 179.503999978304 +/- 22.804894904492
Measured from: -16.9040000140667
to: 162.599999964237 [s; relative to TRIGTIME]
T50: 82.3839999735355 +/- 28.1373363257791
Measured from: -0.61599999666214
to: 81.7679999768734 [s; relative to TRIGTIME]
Fluence
Peak Flux (peak 1 second)
Measured from: 1.70800000429153
to: 2.70800000429153 [s; relative to TRIGTIME]
Total Fluence
Measured from: -26.552000015974
to: 179.719999998808 [s; relative to TRIGTIME]
Band 1 Band 2 Band 3 Band 4
15-25 25-50 50-100 100-350 keV
Total 0.778267 0.977388 0.551065 0.258595
0.086507 0.081624 0.072043 0.070701 [error]
Peak 0.017802 0.022657 0.023540 0.012348
0.006230 0.005848 0.005241 0.005075 [error]
[ fluence units of on-axis counts / fully illuminated detector ]
======================================================================
====== Table of the duration information =============================
Value tstart tstop
T100 206.272 -26.552 179.720
T90 179.504 -16.904 162.600
T50 82.384 -0.616 81.768
Peak 1.000 1.708 2.708
====== Spectral Analysis Summary =====================================
Model : spectral model: simple power-law (PL) and cutoff power-law (CPL)
Ph_index : photon index: E^{Ph_index}
Ph_90err : 90% error of the photon index
Epeak : Epeak in keV
Epeak_90err: 90% error of Epeak
Norm : normalization at 50 keV in both the PL model and CPL model
Nomr_90err : 90% error of the normalization
chi2 : Chi-Squared
dof : degree of freedo
=== Time-averaged spectral analysis ===
(Best model with acceptable fit: PL)
Model Ph_index Ph_90err_low Ph_90err_hi Epeak Epeak_90err_low Epeak_90err_hi Norm Nomr_90err_low Norm_90err_hi chi2 dof
PL -1.675 -0.181 0.178 - - - 7.03e-04 -7.84e-05 7.74e-05 53.290 57
CPL -0.977 -0.734 0.907 63.339 -16.744 -63.339 1.73e-03 -1.05e-03 3.87e-03 50.700 56
=== 1-s peak spectral analysis ===
(Best model with acceptable fit: PL)
Model Ph_index Ph_90err_low Ph_90err_hi Epeak Epeak_90err_low Epeak_90err_hi Norm Nomr_90err_low Norm_90err_hi chi2 dof
PL -1.205 -0.484 0.516 - - - 4.44e-03 -1.09e-03 1.09e-03 60.950 57
CPL -1.216 -0.472 0.534 9999.350 -9999.350 -9999.350 4.45e-03 -1.09e-03 1.44e-02 60.960 56
=== Fluence/Peak Flux Summary ===
Model Band1 Band2 Band3 Band4 Band5 Total
15-25 25-50 50-100 100-350 15-150 15-350 keV
Fluence PL 2.18e-07 3.60e-07 4.52e-07 1.13e-06 1.35e-06 2.16e-06 erg/cm2
90%_error_low -3.34e-08 -3.61e-08 -6.74e-08 -3.11e-07 -1.58e-07 -3.81e-07 erg/cm2
90%_error_hi 3.45e-08 3.61e-08 6.82e-08 3.87e-07 1.61e-07 4.42e-07 erg/cm2
Peak flux PL 1.38e-01 1.65e-01 1.43e-01 2.13e-01 5.21e-01 6.59e-01 ph/cm2/s
90%_error_low -6.48e-02 -5.07e-02 -4.34e-02 -1.13e-01 -1.32e-01 -1.70e-01 ph/cm2/s
90%_error_hi 7.58e-02 4.78e-02 4.20e-02 1.87e-01 1.32e-01 1.84e-01 ph/cm2/s
Fluence CPL 2.03e-07 3.90e-07 4.42e-07 3.55e-07 1.23e-06 1.39e-06 erg/cm2
90%_error_low -3.80e-08 -4.79e-08 -8.13e-08 -2.41e-07 -1.86e-07 -3.10e-07 erg/cm2
90%_error_hi 3.82e-08 4.99e-08 7.61e-08 8.17e-07 1.97e-07 8.53e-07 erg/cm2
Peak flux CPL 1.38e-01 1.65e-01 1.43e-01 2.11e-01 5.28e-01 6.63e-01 ph/cm2/s
90%_error_low N/A N/A N/A N/A N/A -2.26e-01 ph/cm2/s
90%_error_hi N/A N/A N/A N/A N/A 1.56e-01 ph/cm2/s
======================================================================
Image
Pre-slew 15.0-350.0 keV image (Event data)
#   RAcent    DECcent   POSerr    Theta     Phi              Peak Cts       SNR   Name
  270.7229   -32.3302   0.0116     4.8637   173.5421         1.6623892     16.617 TRIG_00318832

Foreground time interval of the image:
-26.552  41.437 (delta_t =  67.989 [sec])
Background time interval of the image:
-239.064 -26.552 (delta_t = 212.512 [sec])
Light Curves
Note: The mask-weighted lightcurves have units of either count/det or counts/sec/det, where a det is 0.4 x 0.4 = 0.16 sq cm.
Full-time range; 1 s binning
Other quick-look light curves:
- 64 ms binning (zoomed)
- 16 ms binning (zoomed)
- 8 ms binning (zoomed)
- 2 ms binning (zoomed)
- SN=5 or 10 s binning (full-time range)
- Raw light curve
Spectra
- 64 ms binning (zoomed)
- 16 ms binning (zoomed)
- 8 ms binning (zoomed)
- 2 ms binning (zoomed)
- SN=5 or 10 s binning (full-time range)
- Raw light curve
Spectra
Notes:
- 1) The fitting includes the systematic errors.
- 2) When the burst includes telescope slew time periods, the fitting uses an average response file made from multiple 5-s response files through out the slew time plus single time preiod for the non-slew times, and weighted by the total counts in the corresponding time period using addrmf. An average response file is needed becuase a spectral fit using the pre-slew DRM will introduce some errors in both a spectral shape and a normalization if the PHA file contains a lot of the slew/post-slew time interval.
- 3) For fits to more complicated models (e.g. a power-law over a cutoff power-law), the BAT team has decided to require a chi-square improvement of more than 6 for each extra dof.
Time averaged spectrum fit using the average DRM
Power-law model
Time interval is from  -26.552 sec. to  179.720 sec.

Spectral model in power-law:
------------------------------------------------------------
Parameters  : value       lower 90%   higher 90%
Photon index: -1.67467     ( -0.181227   0.177902 )
Norm@50keV  : 7.02763E-04    ( -7.84184e-05   7.74007e-05 )
------------------------------------------------------------
#Fit statistic : Chi-Squared =          53.29 using 59 PHA bins.
# Reduced chi-squared =         0.9350 for     57 degrees of freedom
# Null hypothesis probability =   6.149158e-01

Photon flux (15-150 keV)    in 206.3 sec: 9.25279E-02 ( -0.0092831  0.0092891 ) ph/cm2/s
Energy fluence (15-150 keV)             : 1.34539e-06 ( -1.58015e-07  1.61141e-07 ) ergs/cm2
Cutoff power-law model
Time interval is from  -26.552 sec. to  179.720 sec.
Spectral model in the cutoff power-law:
------------------------------------------------------------
Parameters  : value       lower 90%   higher 90%
Photon index: -0.976517     ( -0.734489   0.906591 )
Epeak [keV] : 63.3388      ( -16.7436 -63.3388 )
Norm@50keV  : 1.73367E-03    ( -0.00104595   0.00386776 )
------------------------------------------------------------
#Fit statistic : Chi-Squared =          50.70 using 59 PHA bins.
# Reduced chi-squared =         0.9053 for     56 degrees of freedom
# Null hypothesis probability =   6.751479e-01

Photon flux (15-150 keV)    in 206.3 sec: 8.94573E-02 ( -0.0098187  0.0098238 ) ph/cm2/s
Energy fluence (15-150 keV)             : 1.23441e-06 ( -1.86317e-07  1.9659e-07 ) ergs/cm2
1-s peak spectrum fit
Power-law model

Time interval is from    1.708 sec. to    2.708 sec.

Spectral model in power-law:
------------------------------------------------------------
Parameters  : value       lower 90%   higher 90%
Photon index: -1.20474     ( -0.483638   0.51574 )
Norm@50keV  : 4.43585E-03    ( -0.00108748   0.00108754 )
------------------------------------------------------------
#Fit statistic : Chi-Squared =          60.95 using 59 PHA bins.
# Reduced chi-squared =          1.069 for     57 degrees of freedom
# Null hypothesis probability =   3.357925e-01

Photon flux (15-150 keV)    in 1 sec: 0.521030 ( -0.131543  0.132433 ) ph/cm2/s
Energy fluence (15-150 keV)             : 4.4949e-08 ( -1.24837e-08  1.28513e-08 ) ergs/cm2
Cutoff power-law model
Time interval is from    1.708 sec. to    2.708 sec.
Spectral model in the cutoff power-law:
------------------------------------------------------------
Parameters  : value       lower 90%   higher 90%
Photon index: -1.21579     ( -0.473115   0.533195 )
Epeak [keV] : 9999.35      ( -9999.36 -9999.36 )
Norm@50keV  : 4.45419E-03    ( -0.00109278   0.0143967 )
------------------------------------------------------------
#Fit statistic : Chi-Squared =          60.96 using 59 PHA bins.
# Reduced chi-squared =          1.089 for     56 degrees of freedom
# Null hypothesis probability =   3.021822e-01

Photon flux (15-150 keV)    in 1 sec: 0.527798 (    ) ph/cm2/s
Energy fluence (15-150 keV)             : 4.53785e-08 ( -1.54393e-08  1.46476e-08 ) ergs/cm2
Time-resolved spectra
Distribution
T90 vs. Hardness ratio plot
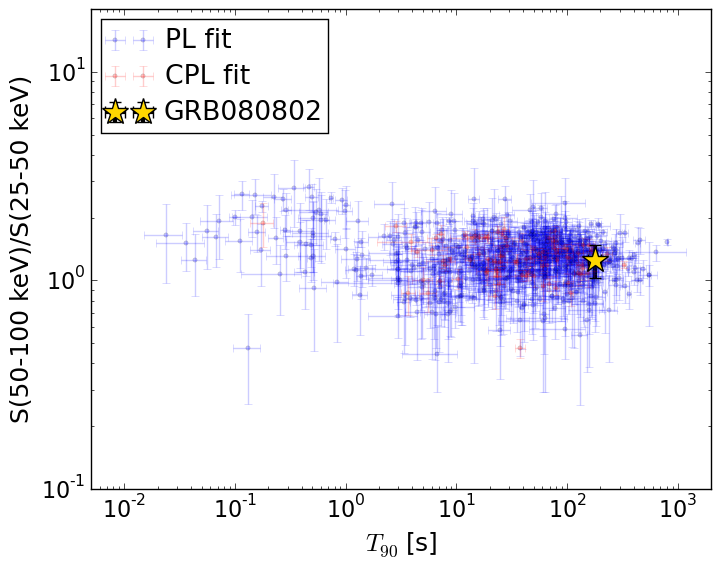
T90                                   = 179.504 sec.
Hardness ratio (energy fluence ratio) = 1.25299684595
S(15-50 keV) vs. S(50-150 keV) plot
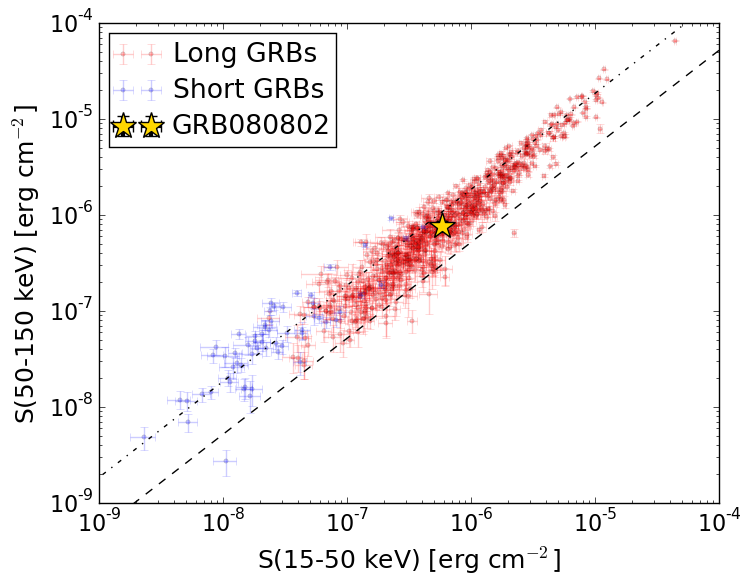
S(15-50 keV)  = 5.785092e-07
S(50-150 keV) = 7.669019e-07
The dash-dotted line and the dashed line traces the fluences calculated from the Band function with Epeak = 15 and 150 keV, respectively. Both lines assume a canonical values of alpha = -1 and beta = -2.5.
Mask shadow pattern
IMX = -8.455161124743028E-02, IMY = -9.570568996833929E-03
Spacecraft aspect plot
Bright source in the pre-burst/pre-slew/post-slew images
Pre-burst image of 15-350 keV band
Time interval of the image:
-239.064000 -26.552000

# RAcent  DECcent POSerr Theta    Phi  PeakCts   SNR AngSep     Name
#  [deg]    [deg]    ['] [deg]  [deg]                   [']
244.9731 -15.6420    0.4  25.0  -49.4   6.6167  28.2    0.4	Sco X-1
256.1350 -37.8474   16.7  14.4 -120.9   0.1352   0.7    7.0	4U 1700-377
256.5846 -36.4187    3.4  13.2 -117.1   0.6741   3.4    7.2	GX 349+2
263.1259 -24.8734    6.4   5.7  -43.2   0.3624   1.8   10.0	GX 1+4
264.5781 -44.5712    7.7  17.0 -154.2   0.3023   1.5   10.1	4U 1735-44
268.3795  -1.4286    2.2  26.4   15.9   1.1544   5.3    1.6	SW J1753.5-0127
270.2948 -25.0071    2.2   3.3   45.9   1.0045   5.2    4.4	GX 5-1
270.4288 -25.6493    4.8   2.8   54.5   0.5026   2.5    8.9	GRS 1758-258
274.0042 -14.0585    3.3  14.7   37.7   0.7002   3.5    1.3	GX 17+2
275.8785 -30.3995    2.5   6.9  129.5   0.8769   4.7    3.1	H1820-303
285.2162 -25.0018    4.8  15.2   99.2   0.4917   2.4   11.0	HT1900.1-2455
288.7934  10.9009    4.1  43.5   45.9   1.8694   2.9    2.7	GRS 1915+105
262.9319 -33.8924    2.4   7.7 -126.8   0.9618   4.8    4.5	GX 354-0
333.1862 -55.0116    3.1  53.2  155.8   4.3603   3.7 ------	UNKNOWN
278.3592  13.9271    2.1  42.9   30.3   2.3278   5.6 ------	UNKNOWN
278.5370 -13.0355    2.1  17.5   50.5   1.0699   5.5 ------	UNKNOWN
325.7487 -73.1877    3.2  54.1  178.7   2.8485   3.6 ------	UNKNOWN
278.6495 -53.5424    2.3  26.7 -177.2   1.0434   5.0 ------	UNKNOWN
275.7964 -65.7524    2.0  38.2 -168.6   1.4430   5.8 ------	UNKNOWN
206.5144 -72.6773    4.8  55.3 -145.1   3.3360   2.4 ------	UNKNOWN
225.9556   1.9574    2.5  50.6  -44.8   4.8379   4.6 ------	UNKNOWN
Pre-slew background subtracted image of 15-350 keV band
Time interval of the image:
-26.552000 41.436620

# RAcent  DECcent POSerr Theta    Phi  PeakCts   SNR AngSep     Name
#  [deg]    [deg]    ['] [deg]  [deg]                   [']
245.1044 -15.4743   24.7  25.0  -48.9   0.0594   0.5   12.3	Sco X-1
256.0550 -37.9841    4.7  14.5 -121.1   0.2802   2.5    9.0	4U 1700-377
256.5854 -36.2548    0.0  13.1 -116.6  -0.2377  -2.2   12.4	GX 349+2
263.1014 -24.8789    3.0   5.7  -43.4  -0.3836  -3.8    9.5	GX 1+4
264.6709 -44.5204   12.2  16.9 -154.4  -0.0952  -0.9    5.2	4U 1735-44
268.2848  -1.3206    5.9  26.5   15.7  -0.2330  -2.0    9.4	SW J1753.5-0127
270.2153 -24.9415   17.1   3.3   44.3  -0.0706  -0.7    9.1	GX 5-1
270.4794 -25.7513   20.4   2.7   56.5   0.0605   0.6    9.6	GRS 1758-258
273.9111 -14.2201    0.0  14.5   37.5   0.1579   1.5   12.3	GX 17+2
275.7051 -30.2796  737.0   6.7  129.0   0.0016   0.0   12.5	H1820-303
285.1515 -24.7851    5.1  15.2   98.4   0.2652   2.3   10.3	HT1900.1-2455
288.8396  10.9785   10.5  43.5   45.9  -0.4051  -1.1    3.1	GRS 1915+105
263.1762 -33.9114    8.5   7.6 -128.0   0.1368   1.4   10.4	GX 354-0
270.7229 -32.3301    0.7   4.9  173.5   1.6623  16.6 ------	UNKNOWN
279.8439 -53.0811    2.2  26.6 -179.1   0.5914   5.2 ------	UNKNOWN
Post-slew image of 15-350 keV band
Time interval of the image:
67.036600 404.336600

# RAcent  DECcent POSerr Theta    Phi  PeakCts   SNR AngSep     Name
#  [deg]    [deg]    ['] [deg]  [deg]                   [']
244.9764 -15.6408    0.5  28.7  -49.7   9.2757  24.7    0.2	Sco X-1
256.1260 -37.7435    3.4  13.1 -107.5   0.9525   3.4    9.0	4U 1700-377
256.4093 -36.3859   13.1  12.5 -102.0   0.2461   0.9    2.6	GX 349+2
263.1090 -24.8840    6.5  10.0  -33.0   0.4637   1.8    9.9	GX 1+4
264.9622 -44.5755   95.6  13.1 -150.5  -0.0350  -0.1   12.0	4U 1735-44
268.3428  -1.4878    1.6  30.9    6.3   2.2694   7.0    2.6	SW J1753.5-0127
270.2905 -25.0505    1.7   7.3    7.7   1.7417   7.0    1.8	GX 5-1
270.3108 -25.6880    4.0   6.6    7.5   0.7760   3.1    3.3	GRS 1758-258
274.0193 -13.9909    3.4  18.6   21.0   0.9039   3.4    2.8	GX 17+2
275.8567 -30.3120    3.0   4.8   77.6   1.0181   3.8    4.8	H1820-303
285.0520 -25.0538    4.3  14.5   74.5   0.7171   2.7    8.0	HT1900.1-2455
288.7976  10.9824    3.0  46.6   35.7   3.4171   3.9    2.2	GRS 1915+105
263.0938 -33.7964    3.3   6.6  -94.1   0.9851   3.5    5.7	GX 354-0
322.4896 -36.6978    2.6  42.4  121.8   4.8780   4.4 ------	UNKNOWN
311.5024 -46.1973    3.1  34.0  137.0   1.7563   3.8 ------	UNKNOWN
236.0012  11.9969    3.2  55.4  -31.7   5.6540   3.6 ------	UNKNOWN
229.3365  -5.4242    3.7  47.0  -53.2   4.3568   3.2 ------	UNKNOWN