Analysis Summary
Notes:
- 1) No attempt has been made to eliminate the non-significant decimal places.
- 2) This batgrbproduct analysis is done using the HEASARC data.
- 3) This batgrbproduct analysis is using the flight position for the mask-weighting calculation.
======================================================================
BAT GRB EVENT DATA PROCESSING REPORT
Process Script Ver: batgrbproduct v2.46
Process Start Time: Sun Jan 19 23:32:23 EST 2014
Host Name: batevent1
Current Working Dir: /local/data/batevent/batevent_reproc/trigger319016
======================================================================
Trigger: 00319016 Segment: 000
BAT Trigger Time: 239584817.664 [s; MET]
Trigger Stop: 239584818.688 [s; MET]
UTC: 2008-08-04T23:20:14.670000 [includes UTCF correction]
Where From?: TDRSS position message
BAT
RA: 328.700699569253 Dec: -53.1947513223728 [deg; J2000]
Catalogged Source?: NO
Point Source?: YES
GRB Indicated?: YES [ by BAT flight software ]
Image S/N Ratio: 7.49
Image Trigger?: NO
Rate S/N Ratio: 12.8840987267251 [ if not an image trigger ]
Image S/N Ratio: 7.49
Analysis Position: [ source = BAT ]
RA: 328.700699569253 Dec: -53.1947513223728 [deg; J2000]
Refined Position: [ source = BAT pre-slew burst ]
RA: 328.673059820948 Dec: -53.1894744732047 [deg; J2000]
{ 21h 54m 41.5s , -53d 11' 22.1" }
+/- 1.15810163702579 [arcmin] (estimated 90% radius based on SNR)
+/- 0.372542331838535 [arcmin] (formal 1-sigma fit error)
SNR: 24.6633292495005
Angular difference between the analysis and refined position is 1.042819 arcmin
Partial Coding Fraction: 0.1972656 [ including projection effects ]
Duration
T90: 37.8720000088215 +/- 42.3550184846043
Measured from: 0.780000001192093
to: 38.6520000100136 [s; relative to TRIGTIME]
T50: 11.4040000140667 +/- 2.24436807837188
Measured from: 4.16799998283386
to: 15.5719999969006 [s; relative to TRIGTIME]
Fluence
Peak Flux (peak 1 second)
Measured from: 1.60400000214577
to: 2.60400000214577 [s; relative to TRIGTIME]
Total Fluence
Measured from: -0.351999998092651
to: 112.856000006199 [s; relative to TRIGTIME]
Band 1 Band 2 Band 3 Band 4
15-25 25-50 50-100 100-350 keV
Total 0.965022 1.498148 1.894939 0.633596
0.096247 0.095805 0.084934 0.072120 [error]
Peak 0.062872 0.129847 0.111745 0.049366
0.016184 0.016230 0.015997 0.012335 [error]
[ fluence units of on-axis counts / fully illuminated detector ]
======================================================================
====== Table of the duration information =============================
Value tstart tstop
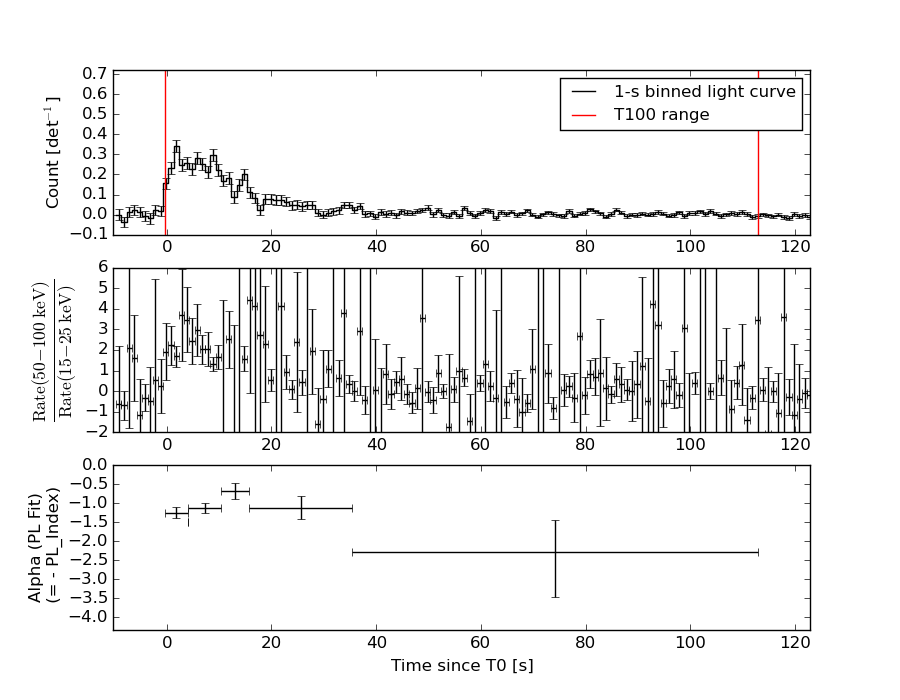
T100 113.208 -0.352 112.856
T90 37.872 0.780 38.652
T50 11.404 4.168 15.572
Peak 1.000 1.604 2.604
====== Spectral Analysis Summary =====================================
Model : spectral model: simple power-law (PL) and cutoff power-law (CPL)
Ph_index : photon index: E^{Ph_index}
Ph_90err : 90% error of the photon index
Epeak : Epeak in keV
Epeak_90err: 90% error of Epeak
Norm : normalization at 50 keV in both the PL model and CPL model
Nomr_90err : 90% error of the normalization
chi2 : Chi-Squared
dof : degree of freedo
=== Time-averaged spectral analysis ===
(Best model with acceptable fit: PL)
Model Ph_index Ph_90err_low Ph_90err_hi Epeak Epeak_90err_low Epeak_90err_hi Norm Nomr_90err_low Norm_90err_hi chi2 dof
PL -1.087 -0.102 0.104 - - - 3.19e-03 -1.86e-04 1.84e-04 47.860 57
CPL -1.000 -0.131 0.363 719.173 -719.173 -719.173 3.46e-03 -4.29e-04 1.30e-03 47.880 56
=== 1-s peak spectral analysis ===
(Best model with acceptable fit: PL)
Model Ph_index Ph_90err_low Ph_90err_hi Epeak Epeak_90err_low Epeak_90err_hi Norm Nomr_90err_low Norm_90err_hi chi2 dof
PL -1.310 -0.238 0.240 - - - 2.56e-02 -3.53e-03 3.53e-03 44.630 57
CPL -1.017 -0.516 1.091 183.654 -183.654 -183.654 3.52e-02 -3.52e-02 7.62e-02 44.340 56
=== Fluence/Peak Flux Summary ===
Model Band1 Band2 Band3 Band4 Band5 Total
15-25 25-50 50-100 100-350 15-150 15-350 keV
Fluence PL 3.14e-07 7.43e-07 1.40e-06 6.38e-06 3.79e-06 8.84e-06 erg/cm2
90%_error_low -3.90e-08 -5.60e-08 -8.10e-08 -8.43e-07 -2.12e-07 -8.70e-07 erg/cm2
90%_error_hi 4.11e-08 5.57e-08 8.07e-08 9.34e-07 2.13e-07 9.46e-07 erg/cm2
Peak flux PL 8.80e-01 9.91e-01 7.99e-01 1.07e+00 3.06e+00 3.74e+00 ph/cm2/s
90%_error_low -2.24e-01 -1.63e-01 -1.27e-01 -3.20e-01 -4.44e-01 -5.22e-01 ph/cm2/s
90%_error_hi 2.45e-01 1.60e-01 1.25e-01 3.93e-01 4.47e-01 5.26e-01 ph/cm2/s
Fluence CPL 3.17e-07 7.44e-07 1.40e-06 6.48e-06 3.79e-06 8.41e-06 erg/cm2
90%_error_low -7.01e-08 -5.67e-08 -8.32e-08 -2.68e-06 -2.04e-07 -2.00e-06 erg/cm2
90%_error_hi 3.16e-08 5.67e-08 1.07e-07 5.07e-07 2.10e-07 9.21e-07 erg/cm2
Peak flux CPL 8.23e-01 1.01e+00 8.27e-01 7.95e-01 3.03e+00 3.46e+00 ph/cm2/s
90%_error_low -2.76e-01 -1.74e-01 -1.47e-01 -4.79e-01 -4.59e-01 -7.05e-01 ph/cm2/s
90%_error_hi 2.86e-01 1.82e-01 1.56e-01 3.84e-01 4.61e-01 7.60e-01 ph/cm2/s
======================================================================
Image
Pre-slew 15.0-350.0 keV image (Event data)
#   RAcent    DECcent   POSerr    Theta     Phi              Peak Cts       SNR   Name
  328.6731   -53.1895   0.0078    45.8481   158.5852         3.1199011     24.663 TRIG_00319016

Foreground time interval of the image:
 -0.352  11.237 (delta_t =  11.589 [sec])
Background time interval of the image:
-239.664  -0.352 (delta_t = 239.312 [sec])
Light Curves
Note: The mask-weighted lightcurves have units of either count/det or counts/sec/det, where a det is 0.4 x 0.4 = 0.16 sq cm.
Full-time range; 1 s binning
Other quick-look light curves:
- 64 ms binning (zoomed)
- 16 ms binning (zoomed)
- 8 ms binning (zoomed)
- 2 ms binning (zoomed)
- SN=5 or 10 s binning (full-time range)
- Raw light curve
Spectra
- 64 ms binning (zoomed)
- 16 ms binning (zoomed)
- 8 ms binning (zoomed)
- 2 ms binning (zoomed)
- SN=5 or 10 s binning (full-time range)
- Raw light curve
Spectra
Notes:
- 1) The fitting includes the systematic errors.
- 2) When the burst includes telescope slew time periods, the fitting uses an average response file made from multiple 5-s response files through out the slew time plus single time preiod for the non-slew times, and weighted by the total counts in the corresponding time period using addrmf. An average response file is needed becuase a spectral fit using the pre-slew DRM will introduce some errors in both a spectral shape and a normalization if the PHA file contains a lot of the slew/post-slew time interval.
- 3) For fits to more complicated models (e.g. a power-law over a cutoff power-law), the BAT team has decided to require a chi-square improvement of more than 6 for each extra dof.
Time averaged spectrum fit using the average DRM
Power-law model
Time interval is from   -0.352 sec. to  112.856 sec.

Spectral model in power-law:
------------------------------------------------------------
Parameters  : value       lower 90%   higher 90%
Photon index: -1.08729     ( -0.102103   0.104098 )
Norm@50keV  : 3.19232E-03    ( -0.000185688   0.000184387 )
------------------------------------------------------------
#Fit statistic : Chi-Squared =          47.86 using 59 PHA bins.
# Reduced chi-squared =         0.8396 for     57 degrees of freedom
# Null hypothesis probability =   8.005593e-01

Photon flux (15-150 keV)    in 113.2 sec: 0.369845 ( -0.022794  0.022923 ) ph/cm2/s
Energy fluence (15-150 keV)             : 3.79408e-06 ( -2.12319e-07  2.12617e-07 ) ergs/cm2
Cutoff power-law model

Time interval is from   -0.352 sec. to  112.856 sec.
Spectral model in the cutoff power-law:
------------------------------------------------------------
Parameters  : value       lower 90%   higher 90%
Photon index: -1.0815     ( -0.127421   0.366997 )
Epeak [keV] : 9997.51      ( -9997.37 -9997.37 )
Norm@50keV  : 3.20962E-03    ( -0.000176142   0.00155649 )
------------------------------------------------------------
#Fit statistic : Chi-Squared =          47.85 using 59 PHA bins.
# Reduced chi-squared =         0.8545 for     56 degrees of freedom
# Null hypothesis probability =   7.725379e-01

Photon flux (15-150 keV)    in 113.2 sec: 0.369259 ( -0.025247  0.021609 ) ph/cm2/s
Energy fluence (15-150 keV)             : 3.79242e-06 ( -2.043e-07  2.09948e-07 ) ergs/cm2
1-s peak spectrum fit
Power-law model
Time interval is from    1.604 sec. to    2.604 sec.

Spectral model in power-law:
------------------------------------------------------------
Parameters  : value       lower 90%   higher 90%
Photon index: -1.31032     ( -0.238197   0.24034 )
Norm@50keV  : 2.56359E-02    ( -0.00352884   0.00352854 )
------------------------------------------------------------
#Fit statistic : Chi-Squared =          44.63 using 59 PHA bins.
# Reduced chi-squared =         0.7830 for     57 degrees of freedom
# Null hypothesis probability =   8.831824e-01

Photon flux (15-150 keV)    in 1 sec: 3.06435 ( -0.44449  0.44675 ) ph/cm2/s
Energy fluence (15-150 keV)             : 2.52726e-07 ( -3.72792e-08  3.74891e-08 ) ergs/cm2
Cutoff power-law model
Time interval is from    1.604 sec. to    2.604 sec.
Spectral model in the cutoff power-law:
------------------------------------------------------------
Parameters  : value       lower 90%   higher 90%
Photon index: -1.01664     ( -0.51614   1.09074 )
Epeak [keV] : 183.654      ( -183.712 -183.712 )
Norm@50keV  : 3.52074E-02    ( -0.0352026   0.0761767 )
------------------------------------------------------------
#Fit statistic : Chi-Squared =          44.34 using 59 PHA bins.
# Reduced chi-squared =         0.7917 for     56 degrees of freedom
# Null hypothesis probability =   8.697521e-01

Photon flux (15-150 keV)    in 1 sec: 3.02688 ( -0.45891  0.461 ) ph/cm2/s
Energy fluence (15-150 keV)             : 2.4919e-07 ( -4.01208e-08  3.91003e-08 ) ergs/cm2
Time-resolved spectra
Distribution
T90 vs. Hardness ratio plot
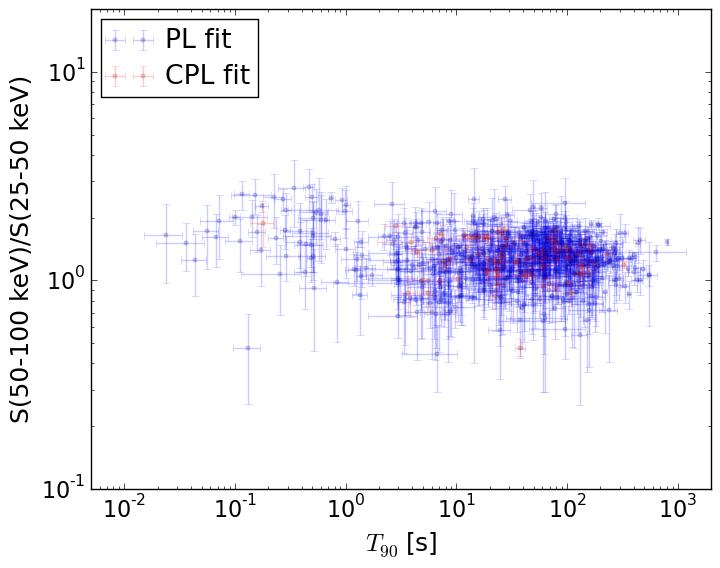
T90                                   = N/A sec.
Hardness ratio (energy fluence ratio) = N/A
S(15-50 keV) vs. S(50-150 keV) plot
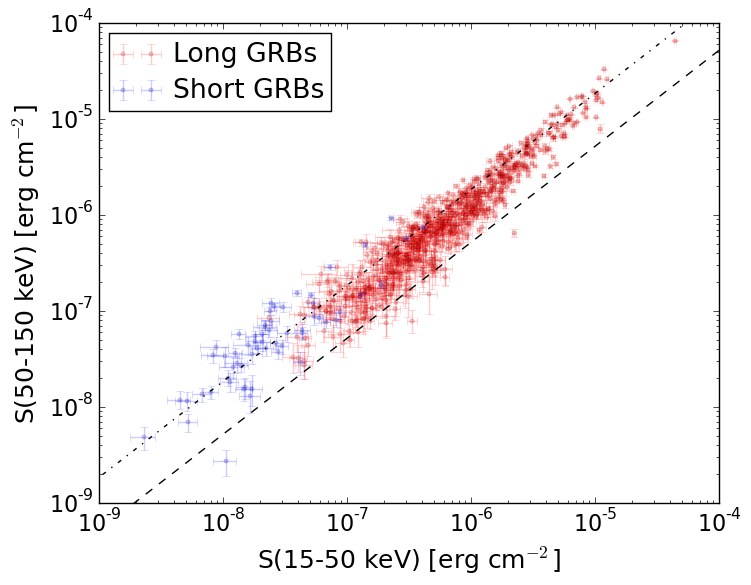
S(15-50 keV)  = N/A
S(50-150 keV) = N/A
The dash-dotted line and the dashed line traces the fluences calculated from the Band function with Epeak = 15 and 150 keV, respectively. Both lines assume a canonical values of alpha = -1 and beta = -2.5.
Mask shadow pattern
IMX = -9.589372706662448E-01, IMY = -3.760898952945209E-01
Spacecraft aspect plot
Bright source in the pre-burst/pre-slew/post-slew images
Pre-burst image of 15-350 keV band
Time interval of the image:
-239.664000 -0.352000

# RAcent  DECcent POSerr Theta    Phi  PeakCts   SNR AngSep     Name
#  [deg]    [deg]    ['] [deg]  [deg]                   [']
244.9825 -15.6379    0.4  28.7  -36.9   6.8397  30.7    0.2	Sco X-1
255.9877 -37.8502    3.1  13.2  -95.1   0.7682   3.8    0.4	4U 1700-377
256.4674 -36.4365    3.0  12.4  -89.6   0.7698   3.9    1.7	GX 349+2
263.1509 -24.6669   16.2  10.1  -19.1   0.1246   0.7    9.1	GX 1+4
264.8966 -44.3221   13.9  12.8 -137.3   0.1564   0.8   10.1	4U 1735-44
268.2079  -1.3543    3.6  31.1   18.8   0.7112   3.2   11.3	SW J1753.5-0127
270.3559 -24.9439    3.9   7.4   21.3   0.5463   3.0    9.0	GX 5-1
270.3696 -25.8288    5.1   6.5   21.1   0.4239   2.3    6.3	GRS 1758-258
273.8139 -13.9863    4.3  18.6   33.2   0.5135   2.7   11.6	GX 17+2
275.9311 -30.3649    2.5   4.9   91.4   0.8789   4.5    0.3	H1820-303
284.8983 -25.0040    8.1  14.4   86.8  -0.3080  -1.4    9.0	HT1900.1-2455
263.0922 -33.8339    3.2   6.5  -81.7   0.7166   3.6    5.1	GX 354-0
327.8765 -39.2014    2.9  46.1  139.1   3.0169   4.0 ------	UNKNOWN
286.1352   6.0921    2.4  41.1   47.4   2.5788   4.9 ------	UNKNOWN
208.4083 -71.9101    3.7  50.9 -135.6   3.6196   3.1 ------	UNKNOWN
Pre-slew background subtracted image of 15-350 keV band
Time interval of the image:
-0.352000 11.236600

# RAcent  DECcent POSerr Theta    Phi  PeakCts   SNR AngSep     Name
#  [deg]    [deg]    ['] [deg]  [deg]                   [']
244.9665 -15.4941    4.3  28.8  -36.7   0.1244   2.7    8.8	Sco X-1
255.8885 -37.9116   76.8  13.3  -95.3   0.0064   0.2    6.2	4U 1700-377
256.4868 -36.2594    6.5  12.4  -88.8  -0.0778  -1.8   10.1	GX 349+2
263.1052 -24.5537  284.4  10.2  -18.9  -0.0015  -0.0   12.7	GX 1+4
264.7765 -44.5722    3.7  13.1 -137.4   0.1223   3.1    7.5	4U 1735-44
268.2634  -1.3337    6.0  31.1   19.0  -0.0957  -1.9    9.5	SW J1753.5-0127
270.3731 -24.8919   31.4   7.4   21.4   0.0147   0.4   12.2	GX 5-1
270.2400 -25.6997   22.5   6.6   20.1  -0.0203  -0.5    4.3	GRS 1758-258
273.8279 -14.0136    9.2  18.5   33.3  -0.0514  -1.3   10.4	GX 17+2
275.8171 -30.4198   33.5   4.8   91.5  -0.0140  -0.3    6.4	H1820-303
285.1443 -24.9631    4.5  14.6   87.2   0.1177   2.6    6.4	HT1900.1-2455
263.0263 -33.7143    2.9   6.6  -80.6   0.1500   4.0    7.5	GX 354-0
328.6731 -53.1895    0.5  45.8  158.6   3.1200  24.7 ------	UNKNOWN
261.2148  -2.0594    2.1  31.6    5.3   0.2579   5.5 ------	UNKNOWN
326.9480 -71.7117    2.0  49.1 -176.5   0.5411   5.8 ------	UNKNOWN
263.1379 -74.1530    2.1  42.0 -153.3   0.3587   5.5 ------	UNKNOWN
233.6706  -5.1709    2.4  43.9  -36.1   0.3533   4.7 ------	UNKNOWN
202.9689 -78.7294    3.1  54.1 -143.4   0.7148   3.7 ------	UNKNOWN
222.4572 -26.7876    2.1  42.0  -71.7   0.8105   5.5 ------	UNKNOWN
Post-slew image of 15-350 keV band
Time interval of the image:
87.436600 962.426400

# RAcent  DECcent POSerr Theta    Phi  PeakCts   SNR AngSep     Name
#  [deg]    [deg]    ['] [deg]  [deg]                   [']
255.9610 -37.7252    4.5  50.9    8.0   3.2549   2.6    7.2	4U 1700-377
256.4659 -36.3281    7.6  51.5    9.7   2.0893   1.5    5.9	GX 349+2
264.7484 -44.4770    4.7  41.5    6.6   1.6141   2.5    1.6	4U 1735-44
270.2392 -25.8484    4.2  50.9   29.9   5.4183   2.7    7.2	GRS 1758-258
275.8514 -30.3308    2.9  44.2   30.8   4.1469   3.9    4.4	H1820-303
285.1053 -24.9657    5.7  43.0   44.9   2.5225   2.0    4.6	HT1900.1-2455
263.0130 -33.8607    3.1  49.4   16.8   4.1531   3.7    2.0	GX 354-0
341.0817 -47.3037    3.5   9.9  169.6   1.2836   3.3 ------	UNKNOWN
326.7799 -56.8035    2.7   3.8  -52.7   1.8842   4.4 ------	UNKNOWN
238.8310 -44.4972    2.8  55.8   -9.1   6.7723   4.2 ------	UNKNOWN
208.3047 -68.4781    4.8  50.7  -44.6   6.9363   2.4 ------	UNKNOWN
 48.1654 -43.5586    3.5  50.9 -135.4  10.0354   3.3 ------	UNKNOWN