Analysis Summary
Notes:
- 1) No attempt has been made to eliminate the non-significant decimal places.
- 2) This batgrbproduct analysis is done using the HEASARC data.
- 3) This batgrbproduct analysis is using the flight position for the mask-weighting calculation.
======================================================================
BAT GRB EVENT DATA PROCESSING REPORT
Process Script Ver: batgrbproduct v2.46
Process Start Time: Sun Jan 19 23:26:37 EST 2014
Host Name: batevent1
Current Working Dir: /local/data/batevent/batevent_reproc/trigger319036
======================================================================
Trigger: 00319036 Segment: 000
BAT Trigger Time: 239614897.728 [s; MET]
Trigger Stop: 239614898.752 [s; MET]
UTC: 2008-08-05T07:41:34.733120 [includes UTCF correction]
Where From?: TDRSS position message
BAT
RA: 314.231247555151 Dec: -62.4380396223226 [deg; J2000]
Catalogged Source?: NO
Point Source?: YES
GRB Indicated?: YES [ by BAT flight software ]
Image S/N Ratio: 8.81
Image Trigger?: NO
Rate S/N Ratio: 27.1845544381364 [ if not an image trigger ]
Image S/N Ratio: 8.81
Analysis Position: [ source = BAT ]
RA: 314.231247555151 Dec: -62.4380396223226 [deg; J2000]
Refined Position: [ source = BAT pre-slew burst ]
RA: 314.222972951419 Dec: -62.4365555965257 [deg; J2000]
{ 20h 56m 53.5s , -62d 26' 11.6" }
+/- 0.856706784498019 [arcmin] (estimated 90% radius based on SNR)
+/- 0.298281019843104 [arcmin] (formal 1-sigma fit error)
SNR: 37.9378199533404
Angular difference between the analysis and refined position is 0.246381 arcmin
Partial Coding Fraction: 1.015625 [ including projection effects ]
Duration
T90: 106.624000012875 +/- 15.8916330223281
Measured from: -1.07199999690056
to: 105.552000015974 [s; relative to TRIGTIME]
T50: 38.8480000197887 +/- 5.73612831018499
Measured from: 7.18400001525879
to: 46.0320000350475 [s; relative to TRIGTIME]
Fluence
Peak Flux (peak 1 second)
Measured from: 2.30000001192093
to: 3.30000001192093 [s; relative to TRIGTIME]
Total Fluence
Measured from: -6.51199999451637
to: 131.472000002861 [s; relative to TRIGTIME]
Band 1 Band 2 Band 3 Band 4
15-25 25-50 50-100 100-350 keV
Total 1.324744 1.619143 1.258101 0.329742
0.056532 0.059053 0.052418 0.044999 [error]
Peak 0.012494 0.044806 0.062726 0.022443
0.004859 0.005546 0.005419 0.004372 [error]
[ fluence units of on-axis counts / fully illuminated detector ]
======================================================================
====== Table of the duration information =============================
Value tstart tstop
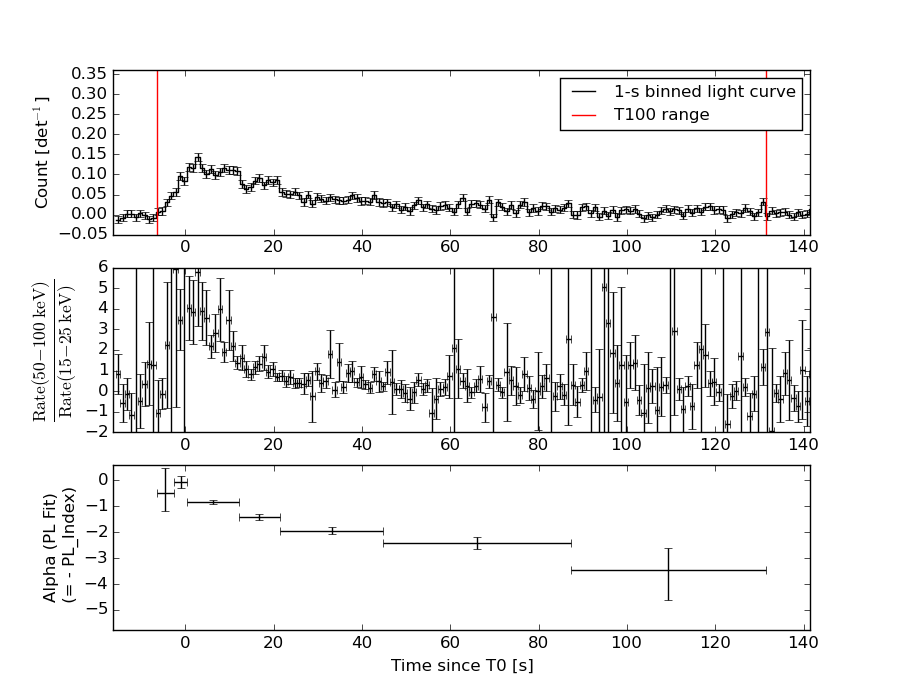
T100 137.984 -6.512 131.472
T90 106.624 -1.072 105.552
T50 38.848 7.184 46.032
Peak 1.000 2.300 3.300
====== Spectral Analysis Summary =====================================
Model : spectral model: simple power-law (PL) and cutoff power-law (CPL)
Ph_index : photon index: E^{Ph_index}
Ph_90err : 90% error of the photon index
Epeak : Epeak in keV
Epeak_90err: 90% error of Epeak
Norm : normalization at 50 keV in both the PL model and CPL model
Nomr_90err : 90% error of the normalization
chi2 : Chi-Squared
dof : degree of freedo
=== Time-averaged spectral analysis ===
(Best model with acceptable fit: PL)
Model Ph_index Ph_90err_low Ph_90err_hi Epeak Epeak_90err_low Epeak_90err_hi Norm Nomr_90err_low Norm_90err_hi chi2 dof
PL -1.516 -0.081 0.081 - - - 2.03e-03 -8.60e-05 8.58e-05 56.770 57
CPL -1.486 -0.112 0.195 912.809 -912.809 -912.809 2.10e-03 -1.47e-04 4.51e-04 57.000 56
=== 1-s peak spectral analysis ===
(Best model with acceptable fit: PL)
Model Ph_index Ph_90err_low Ph_90err_hi Epeak Epeak_90err_low Epeak_90err_hi Norm Nomr_90err_low Norm_90err_hi chi2 dof
PL -0.580 -0.192 0.204 - - - 8.87e-03 -1.12e-03 1.10e-03 61.350 57
CPL 0.630 -0.956 1.261 138.212 -39.141 252.663 2.64e-02 -1.50e-02 4.82e-02 56.430 56
=== Fluence/Peak Flux Summary ===
Model Band1 Band2 Band3 Band4 Band5 Total
15-25 25-50 50-100 100-350 15-150 15-350 keV
Fluence PL 3.63e-07 6.60e-07 9.23e-07 2.70e-06 2.65e-06 4.65e-06 erg/cm2
90%_error_low -2.81e-08 -2.97e-08 -5.23e-08 -3.30e-07 -1.23e-07 -3.66e-07 erg/cm2
90%_error_hi 2.89e-08 2.96e-08 5.22e-08 3.61e-07 1.24e-07 3.92e-07 erg/cm2
Peak flux PL 1.52e-01 2.67e-01 3.57e-01 9.78e-01 1.04e+00 1.75e+00 ph/cm2/s
90%_error_low -3.84e-02 -4.41e-02 -3.95e-02 -2.14e-01 -1.19e-01 -2.31e-01 ph/cm2/s
90%_error_hi 4.29e-02 4.40e-02 3.94e-02 2.55e-01 1.19e-01 2.49e-01 ph/cm2/s
Fluence CPL 3.62e-07 6.55e-07 9.19e-07 2.97e-06 2.67e-06 4.66e-06 erg/cm2
90%_error_low N/A N/A -4.81e-08 N/A -1.45e-07 -8.12e-07 erg/cm2
90%_error_hi N/A N/A 5.64e-08 N/A 1.02e-07 1.66e-07 erg/cm2
Peak flux CPL 1.01e-01 2.67e-01 4.09e-01 4.07e-01 9.98e-01 1.18e+00 ph/cm2/s
90%_error_low -4.62e-02 -5.20e-02 -5.60e-02 -1.79e-01 -1.23e-01 -2.21e-01 ph/cm2/s
90%_error_hi 5.53e-02 5.05e-02 5.75e-02 3.82e-01 1.24e-01 3.88e-01 ph/cm2/s
======================================================================
Image
Pre-slew 15.0-350.0 keV image (Event data)
#   RAcent    DECcent   POSerr    Theta     Phi              Peak Cts       SNR   Name
  314.2230   -62.4366   0.0051    11.9906   -34.9244         1.9317205     37.938 TRIG_00319036

Foreground time interval of the image:
 -6.512  15.573 (delta_t =  22.085 [sec])
Background time interval of the image:
-239.728  -6.512 (delta_t = 233.216 [sec])
Light Curves
Note: The mask-weighted lightcurves have units of either count/det or counts/sec/det, where a det is 0.4 x 0.4 = 0.16 sq cm.
Full-time range; 1 s binning
Other quick-look light curves:
- 64 ms binning (zoomed)
- 16 ms binning (zoomed)
- 8 ms binning (zoomed)
- 2 ms binning (zoomed)
- SN=5 or 10 s binning (full-time range)
- Raw light curve
Spectra
- 64 ms binning (zoomed)
- 16 ms binning (zoomed)
- 8 ms binning (zoomed)
- 2 ms binning (zoomed)
- SN=5 or 10 s binning (full-time range)
- Raw light curve
Spectra
Notes:
- 1) The fitting includes the systematic errors.
- 2) When the burst includes telescope slew time periods, the fitting uses an average response file made from multiple 5-s response files through out the slew time plus single time preiod for the non-slew times, and weighted by the total counts in the corresponding time period using addrmf. An average response file is needed becuase a spectral fit using the pre-slew DRM will introduce some errors in both a spectral shape and a normalization if the PHA file contains a lot of the slew/post-slew time interval.
- 3) For fits to more complicated models (e.g. a power-law over a cutoff power-law), the BAT team has decided to require a chi-square improvement of more than 6 for each extra dof.
Time averaged spectrum fit using the average DRM
Power-law model
Time interval is from   -6.512 sec. to  131.472 sec.

Spectral model in power-law:
------------------------------------------------------------
Parameters  : value       lower 90%   higher 90%
Photon index: -1.51567     ( -0.0811204   0.0808513 )
Norm@50keV  : 2.02720E-03    ( -8.60568e-05   8.57587e-05 )
------------------------------------------------------------
#Fit statistic : Chi-Squared =          56.77 using 59 PHA bins.
# Reduced chi-squared =         0.9960 for     57 degrees of freedom
# Null hypothesis probability =   4.835136e-01

Photon flux (15-150 keV)    in 138 sec: 0.254163 ( -0.01103  0.011061 ) ph/cm2/s
Energy fluence (15-150 keV)             : 2.64759e-06 ( -1.23354e-07  1.24005e-07 ) ergs/cm2
Cutoff power-law model

Time interval is from   -6.512 sec. to  131.472 sec.
Spectral model in the cutoff power-law:
------------------------------------------------------------
Parameters  : value       lower 90%   higher 90%
Photon index: -1.51321     ( -0.109659   0.196499 )
Epeak [keV] : 9999.28      ( -9999.29 -9999.29 )
Norm@50keV  : 2.03302E-03    ( -8.41438e-05   0.0005145 )
------------------------------------------------------------
#Fit statistic : Chi-Squared =          56.79 using 59 PHA bins.
# Reduced chi-squared =          1.014 for     56 degrees of freedom
# Null hypothesis probability =   4.453514e-01

Photon flux (15-150 keV)    in 138 sec: 0.255898 ( -0.007329  0.009332 ) ph/cm2/s
Energy fluence (15-150 keV)             : 2.66667e-06 ( -1.45402e-07  1.02432e-07 ) ergs/cm2
1-s peak spectrum fit
Power-law model
Time interval is from    2.300 sec. to    3.300 sec.

Spectral model in power-law:
------------------------------------------------------------
Parameters  : value       lower 90%   higher 90%
Photon index: -0.579819     ( -0.192157   0.204226 )
Norm@50keV  : 8.86654E-03    ( -0.00111754   0.00109626 )
------------------------------------------------------------
#Fit statistic : Chi-Squared =          61.35 using 59 PHA bins.
# Reduced chi-squared =          1.076 for     57 degrees of freedom
# Null hypothesis probability =   3.229293e-01

Photon flux (15-150 keV)    in 1 sec: 1.03784 ( -0.118919  0.11937 ) ph/cm2/s
Energy fluence (15-150 keV)             : 1.14506e-07 ( -1.32409e-08  1.32849e-08 ) ergs/cm2
Cutoff power-law model
Time interval is from    2.300 sec. to    3.300 sec.
Spectral model in the cutoff power-law:
------------------------------------------------------------
Parameters  : value       lower 90%   higher 90%
Photon index: 0.629883     ( -0.956167   1.26104 )
Epeak [keV] : 138.212      ( -39.1405 252.664 )
Norm@50keV  : 2.64316E-02    ( -0.0150495   0.0481574 )
------------------------------------------------------------
#Fit statistic : Chi-Squared =          56.43 using 59 PHA bins.
# Reduced chi-squared =          1.008 for     56 degrees of freedom
# Null hypothesis probability =   4.586670e-01

Photon flux (15-150 keV)    in 1 sec: 0.998446 ( -0.123435  0.123534 ) ph/cm2/s
Energy fluence (15-150 keV)             : 1.10365e-07 ( -1.45044e-08  1.42183e-08 ) ergs/cm2
Time-resolved spectra
Distribution
T90 vs. Hardness ratio plot
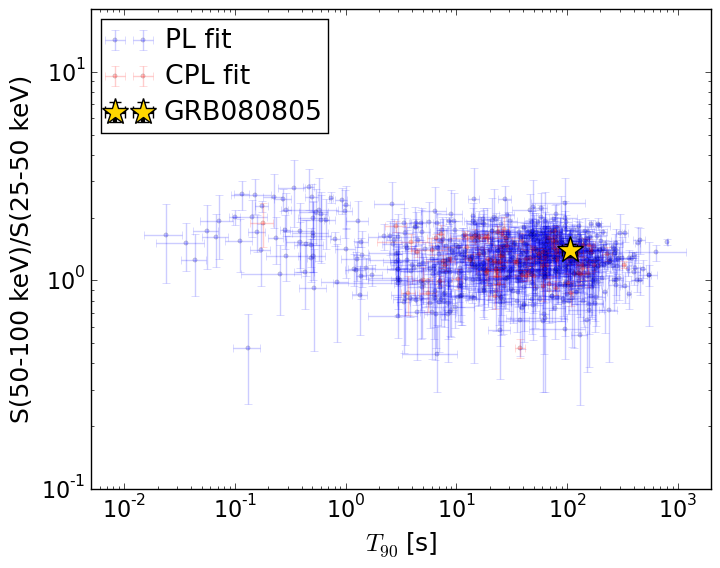
T90                                   = 106.624 sec.
Hardness ratio (energy fluence ratio) = 1.39897505899
S(15-50 keV) vs. S(50-150 keV) plot
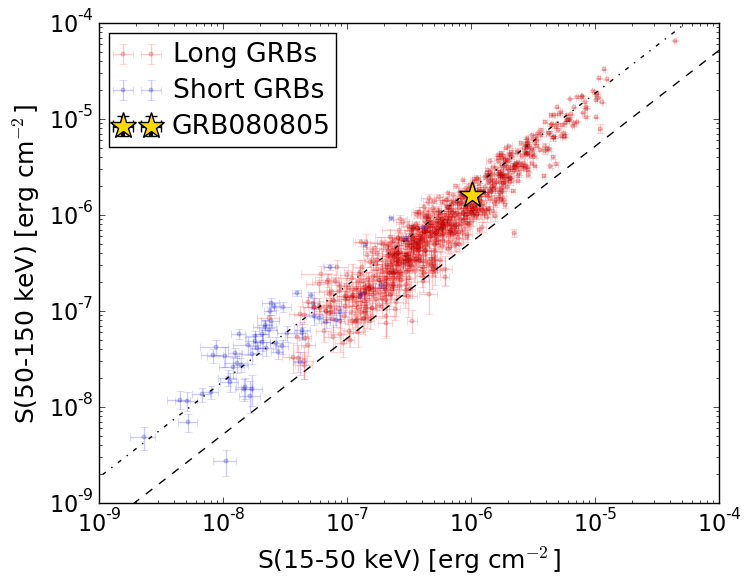
S(15-50 keV)  = 1.0222741e-06
S(50-150 keV) = 1.6252886e-06
The dash-dotted line and the dashed line traces the fluences calculated from the Band function with Epeak = 15 and 150 keV, respectively. Both lines assume a canonical values of alpha = -1 and beta = -2.5.
Mask shadow pattern
IMX = 1.741365060462937E-01, IMY = 1.215893857885950E-01
Spacecraft aspect plot
Bright source in the pre-burst/pre-slew/post-slew images
Pre-burst image of 15-350 keV band
Time interval of the image:
-239.728000 -6.512000

# RAcent  DECcent POSerr Theta    Phi  PeakCts   SNR AngSep     Name
#  [deg]    [deg]    ['] [deg]  [deg]                   [']
256.0443 -37.7596    4.2  50.8    8.0   1.3435   2.7    5.8	4U 1700-377
256.4771 -36.3710    4.7  51.5    9.6  -1.3210  -2.5    3.7	GX 349+2
264.7311 -44.4512   33.1  41.5    6.5   0.0953   0.3    0.5	4U 1735-44
270.3765 -25.6387    4.8  50.9   30.1   1.9830   2.4    7.4	GRS 1758-258
275.7555 -30.3514   11.5  44.3   30.6   0.3885   1.0    8.8	H1820-303
285.1307 -24.9539    4.3  43.0   44.9   1.3647   2.7    5.5	HT1900.1-2455
263.1043 -33.9565   13.1  49.3   16.7   0.4338   0.9    9.3	GX 354-0
 26.3358 -16.0039    2.4  58.1 -175.6   5.0351   4.7 ------	UNKNOWN
208.3459 -68.4816    3.2  50.7  -44.6   3.7079   3.7 ------	UNKNOWN
Pre-slew background subtracted image of 15-350 keV band
Time interval of the image:
-6.512000 15.572610

# RAcent  DECcent POSerr Theta    Phi  PeakCts   SNR AngSep     Name
#  [deg]    [deg]    ['] [deg]  [deg]                   [']
256.1195 -37.8067    3.5  50.8    8.0  -0.5032  -3.3    6.7	4U 1700-377
256.4096 -36.3623    6.4  51.6    9.6   0.3048   1.8    3.9	GX 349+2
264.4748 -44.4784    0.0  41.7    6.3  -0.1438  -1.7   11.6	4U 1735-44
270.1378 -25.7544    3.4  51.0   29.8   0.8845   3.4    8.9	GRS 1758-258
275.9846 -30.2603    5.6  44.2   30.9   0.2732   2.1    7.1	H1820-303
285.0074 -24.9651   27.8  43.0   44.7   0.0714   0.4    3.1	HT1900.1-2455
262.8739 -33.8523   10.2  49.5   16.6   0.1785   1.1    5.8	GX 354-0
314.2230 -62.4366    0.3  12.0  -34.9   1.9318  37.9 ------	UNKNOWN
289.8638 -66.8312    2.5  23.1  -29.8   0.2392   4.7 ------	UNKNOWN
Post-slew image of 15-350 keV band
Time interval of the image:
51.772590 422.372000

# RAcent  DECcent POSerr Theta    Phi  PeakCts   SNR AngSep     Name
#  [deg]    [deg]    ['] [deg]  [deg]                   [']
255.9842 -37.8450   42.1  42.6    5.4   0.6329   0.3    0.1	4U 1700-377
256.5724 -36.5259   21.7  43.4    7.0  -1.2587  -0.5    9.0	GX 349+2
263.1337 -24.8369   31.3  50.5   22.0   1.7972   0.4    8.7	GX 1+4
264.9835 -44.4876    8.6  33.2    7.5   2.3303   1.3   10.5	4U 1735-44
270.4776 -25.0918   23.5  47.2   29.7  -1.9671  -0.5   10.5	GX 5-1
270.3083 -25.7019    6.3  46.8   29.1   7.1700   1.8    2.5	GRS 1758-258
275.8632 -30.2065    0.0  40.6   32.7   0.5534   0.2   10.1	H1820-303
285.1902 -24.9427    5.1  42.2   47.3  -8.9669  -2.3    8.5	HT1900.1-2455
263.1007 -33.7624    4.8  42.8   15.8   6.2160   2.4    7.1	GX 354-0
277.4083 -23.7949    3.1  45.8   38.4  16.0736   3.7 ------	UNKNOWN
295.2957 -28.0862    2.3  36.5   59.5  15.2112   4.9 ------	UNKNOWN
257.5981 -31.6568    2.1  47.0   11.8  16.0681   5.5 ------	UNKNOWN
 22.1302 -46.0447    2.3  40.6 -172.8  10.2014   5.0 ------	UNKNOWN