Analysis Summary
Notes:
- 1) No attempt has been made to eliminate the non-significant decimal places.
- 2) This batgrbproduct analysis is done using the HEASARC data.
- 3) This batgrbproduct analysis is using the flight position for the mask-weighting calculation.
======================================================================
BAT GRB EVENT DATA PROCESSING REPORT
Process Script Ver: batgrbproduct v2.46
Process Start Time: Sun Jan 19 23:21:37 EST 2014
Host Name: batevent1
Current Working Dir: /local/data/batevent/batevent_reproc/trigger319584
======================================================================
Trigger: 00319584 Segment: 000
BAT Trigger Time: 240066615.296 [s; MET]
Trigger Stop: 240066616.32 [s; MET]
UTC: 2008-08-10T13:10:12.287980 [includes UTCF correction]
Where From?: TDRSS position message
BAT
RA: 356.779571156542 Dec: 0.319715625427062 [deg; J2000]
Catalogged Source?: NO
Point Source?: YES
GRB Indicated?: YES [ by BAT flight software ]
Image S/N Ratio: 7.59
Image Trigger?: NO
Rate S/N Ratio: 14.7309198626562 [ if not an image trigger ]
Image S/N Ratio: 7.59
Analysis Position: [ source = BAT ]
RA: 356.779571156542 Dec: 0.319715625427062 [deg; J2000]
Refined Position: [ source = BAT pre-slew burst ]
RA: 356.78300404361 Dec: 0.312256406462367 [deg; J2000]
{ 23h 47m 07.9s , +00d 18' 44.1" }
+/- 1.1690293015403 [arcmin] (estimated 90% radius based on SNR)
+/- 0.594737582105186 [arcmin] (formal 1-sigma fit error)
SNR: 24.3346416899719
Angular difference between the analysis and refined position is 0.492674 arcmin
Partial Coding Fraction: 0.6875 [ including projection effects ]
Duration
T90: 107.668000012636 +/- 3.47154376061863
Measured from: -6.22400000691414
to: 101.444000005722 [s; relative to TRIGTIME]
T50: 38.9480000138283 +/- 2.52967428011403
Measured from: 10.447999984026
to: 49.3959999978542 [s; relative to TRIGTIME]
Fluence
Peak Flux (peak 1 second)
Measured from: 24.6800000071526
to: 25.6800000071526 [s; relative to TRIGTIME]
Total Fluence
Measured from: -20.4959999918938
to: 106.491999983788 [s; relative to TRIGTIME]
Band 1 Band 2 Band 3 Band 4
15-25 25-50 50-100 100-350 keV
Total 1.844654 2.445282 2.153071 0.800968
0.065791 0.069537 0.063197 0.058147 [error]
Peak 0.063743 0.087361 0.076435 0.027669
0.006959 0.007607 0.007309 0.006267 [error]
[ fluence units of on-axis counts / fully illuminated detector ]
======================================================================
====== Table of the duration information =============================
Value tstart tstop
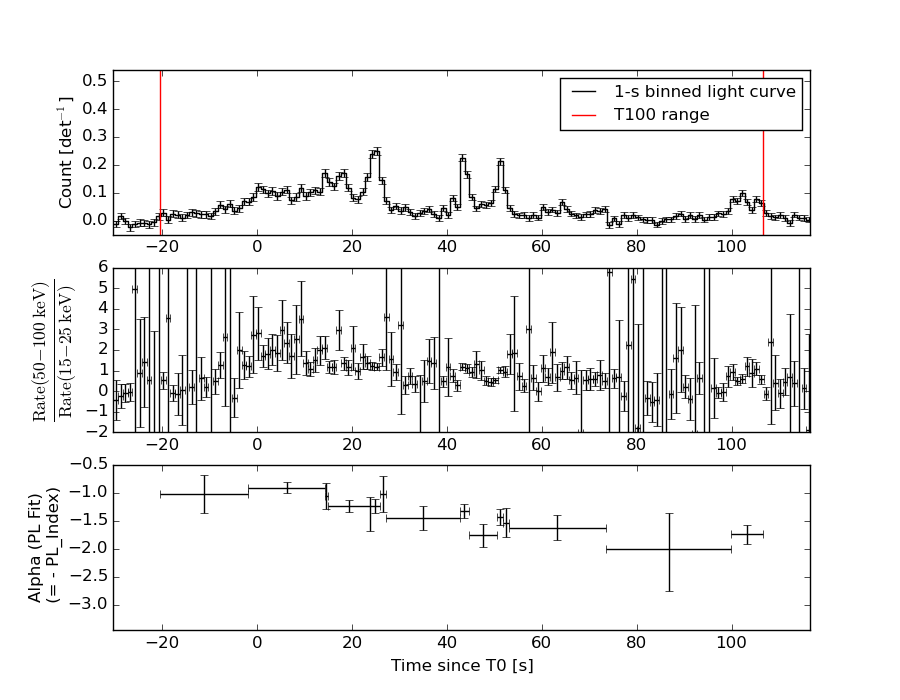
T100 126.988 -20.496 106.492
T90 107.668 -6.224 101.444
T50 38.948 10.448 49.396
Peak 1.000 24.680 25.680
====== Spectral Analysis Summary =====================================
Model : spectral model: simple power-law (PL) and cutoff power-law (CPL)
Ph_index : photon index: E^{Ph_index}
Ph_90err : 90% error of the photon index
Epeak : Epeak in keV
Epeak_90err: 90% error of Epeak
Norm : normalization at 50 keV in both the PL model and CPL model
Nomr_90err : 90% error of the normalization
chi2 : Chi-Squared
dof : degree of freedo
=== Time-averaged spectral analysis ===
(Best model with acceptable fit: PL)
Model Ph_index Ph_90err_low Ph_90err_hi Epeak Epeak_90err_low Epeak_90err_hi Norm Nomr_90err_low Norm_90err_hi chi2 dof
PL -1.270 -0.065 0.065 - - - 3.67e-03 -1.16e-04 1.16e-04 61.170 57
CPL -1.265 -0.067 0.064 9999.350 -9999.350 -9999.350 3.69e-03 -1.16e-04 4.33e-04 61.380 56
=== 1-s peak spectral analysis ===
(Best model with acceptable fit: PL)
Model Ph_index Ph_90err_low Ph_90err_hi Epeak Epeak_90err_low Epeak_90err_hi Norm Nomr_90err_low Norm_90err_hi chi2 dof
PL -1.236 -0.170 0.170 - - - 1.68e-02 -1.51e-03 1.51e-03 60.020 57
CPL -1.230 -0.174 0.271 9999.360 -9999.360 -9999.360 1.69e-02 -1.34e-02 -9.97e-03 60.040 56
=== Fluence/Peak Flux Summary ===
Model Band1 Band2 Band3 Band4 Band5 Total
15-25 25-50 50-100 100-350 15-150 15-350 keV
Fluence PL 4.80e-07 1.02e-06 1.68e-06 6.34e-06 4.64e-06 9.52e-06 erg/cm2
90%_error_low -3.32e-08 -3.95e-08 -6.50e-08 -5.81e-07 -1.60e-07 -6.11e-07 erg/cm2
90%_error_hi 3.41e-08 3.93e-08 6.48e-08 6.24e-07 1.61e-07 6.47e-07 erg/cm2
Peak flux PL 5.37e-01 6.32e-01 5.37e-01 7.73e-01 1.98e+00 2.48e+00 ph/cm2/s
90%_error_low -9.11e-02 -6.48e-02 -6.10e-02 -1.76e-01 -1.79e-01 -2.41e-01 ph/cm2/s
90%_error_hi 9.59e-02 6.38e-02 6.01e-02 2.07e-01 1.80e-01 2.48e-01 ph/cm2/s
Fluence CPL 4.80e-07 1.01e-06 1.66e-06 6.40e-06 4.68e-06 9.08e-06 erg/cm2
90%_error_low -3.32e-08 -3.39e-08 -4.30e-08 -1.11e-06 -2.01e-07 -2.24e-07 erg/cm2
90%_error_hi 3.41e-08 4.50e-08 8.71e-08 7.92e-07 1.21e-07 1.01e-06 erg/cm2
Peak flux CPL 5.37e-01 6.32e-01 5.37e-01 8.40e-01 1.98e+00 2.49e+00 ph/cm2/s
90%_error_low N/A -6.48e-02 -6.09e-02 N/A -1.79e-01 -3.31e-01 ph/cm2/s
90%_error_hi N/A 6.52e-02 6.03e-02 N/A 1.79e-01 2.16e-01 ph/cm2/s
======================================================================
Image
Pre-slew 15.0-350.0 keV image (Event data)
#   RAcent    DECcent   POSerr    Theta     Phi              Peak Cts       SNR   Name
  356.7830     0.3123   0.0079    20.4484    63.9740         1.9488337     24.335 TRIG_00319584

Foreground time interval of the image:
-20.496  12.005 (delta_t =  32.501 [sec])
Background time interval of the image:
-239.296 -20.496 (delta_t = 218.800 [sec])
Light Curves
Note: The mask-weighted lightcurves have units of either count/det or counts/sec/det, where a det is 0.4 x 0.4 = 0.16 sq cm.
Full-time range; 1 s binning
Other quick-look light curves:
- 64 ms binning (zoomed)
- 16 ms binning (zoomed)
- 8 ms binning (zoomed)
- 2 ms binning (zoomed)
- SN=5 or 10 s binning (full-time range)
- Raw light curve
Spectra
- 64 ms binning (zoomed)
- 16 ms binning (zoomed)
- 8 ms binning (zoomed)
- 2 ms binning (zoomed)
- SN=5 or 10 s binning (full-time range)
- Raw light curve
Spectra
Notes:
- 1) The fitting includes the systematic errors.
- 2) When the burst includes telescope slew time periods, the fitting uses an average response file made from multiple 5-s response files through out the slew time plus single time preiod for the non-slew times, and weighted by the total counts in the corresponding time period using addrmf. An average response file is needed becuase a spectral fit using the pre-slew DRM will introduce some errors in both a spectral shape and a normalization if the PHA file contains a lot of the slew/post-slew time interval.
- 3) For fits to more complicated models (e.g. a power-law over a cutoff power-law), the BAT team has decided to require a chi-square improvement of more than 6 for each extra dof.
Time averaged spectrum fit using the average DRM
Power-law model
Time interval is from  -20.496 sec. to  106.492 sec.

Spectral model in power-law:
------------------------------------------------------------
Parameters  : value       lower 90%   higher 90%
Photon index: -1.27     ( -0.0647763   0.0650173 )
Norm@50keV  : 3.66994E-03    ( -0.000115863   0.000115819 )
------------------------------------------------------------
#Fit statistic : Chi-Squared =          61.17 using 59 PHA bins.
# Reduced chi-squared =          1.073 for     57 degrees of freedom
# Null hypothesis probability =   3.286188e-01

Photon flux (15-150 keV)    in 127 sec: 0.435510 ( -0.014836  0.014921 ) ph/cm2/s
Energy fluence (15-150 keV)             : 4.64091e-06 ( -1.60439e-07  1.60997e-07 ) ergs/cm2
Cutoff power-law model
Time interval is from  -20.496 sec. to  106.492 sec.
Spectral model in the cutoff power-law:
------------------------------------------------------------
Parameters  : value       lower 90%   higher 90%
Photon index: -1.26481     ( -0.0663852   0.0642971 )
Epeak [keV] : 9999.35      ( -9999.36 -9999.36 )
Norm@50keV  : 3.68524E-03    ( -0.000115857   0.000433316 )
------------------------------------------------------------
#Fit statistic : Chi-Squared =          61.38 using 59 PHA bins.
# Reduced chi-squared =          1.096 for     56 degrees of freedom
# Null hypothesis probability =   2.892792e-01

Photon flux (15-150 keV)    in 127 sec: 0.435387 ( -0.01486  0.014899 ) ph/cm2/s
Energy fluence (15-150 keV)             : 4.67933e-06 ( -2.00919e-07  1.20589e-07 ) ergs/cm2
1-s peak spectrum fit
Power-law model
Time interval is from   24.680 sec. to   25.680 sec.

Spectral model in power-law:
------------------------------------------------------------
Parameters  : value       lower 90%   higher 90%
Photon index: -1.23648     ( -0.169763   0.170409 )
Norm@50keV  : 1.67943E-02    ( -0.00151453   0.00151155 )
------------------------------------------------------------
#Fit statistic : Chi-Squared =          60.02 using 59 PHA bins.
# Reduced chi-squared =          1.053 for     57 degrees of freedom
# Null hypothesis probability =   3.669285e-01

Photon flux (15-150 keV)    in 1 sec: 1.98204 ( -0.17926  0.17952 ) ph/cm2/s
Energy fluence (15-150 keV)             : 1.68702e-07 ( -1.77566e-08  1.79875e-08 ) ergs/cm2
Cutoff power-law model
Time interval is from   24.680 sec. to   25.680 sec.
Spectral model in the cutoff power-law:
------------------------------------------------------------
Parameters  : value       lower 90%   higher 90%
Photon index: -2.10816     ( -0.173403   0.271026 )
Epeak [keV] : 39.6177      ( -9999.36 -9999.36 )
Norm@50keV  : 5.23895E-03    ( -0.00184635   0.00158911 )
------------------------------------------------------------
#Fit statistic : Chi-Squared =          58.97 using 59 PHA bins.
# Reduced chi-squared =          1.053 for     56 degrees of freedom
# Null hypothesis probability =   3.676036e-01

Photon flux (15-150 keV)    in 1 sec: 1.98162 ( -0.17932  0.17944 ) ph/cm2/s
Energy fluence (15-150 keV)             : 6.08177e-08 ( -1.8745e-08  1.68249e-08 ) ergs/cm2
Time-resolved spectra
Distribution
T90 vs. Hardness ratio plot
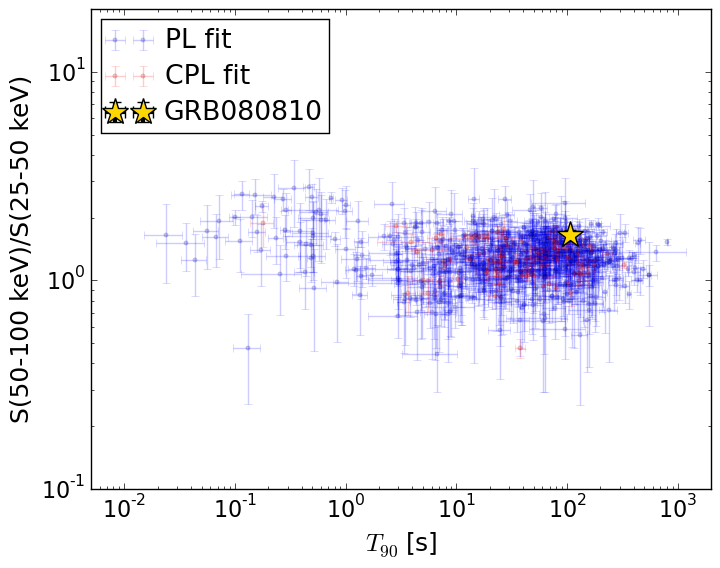
T90                                   = 107.668 sec.
Hardness ratio (energy fluence ratio) = 1.65867067648
S(15-50 keV) vs. S(50-150 keV) plot
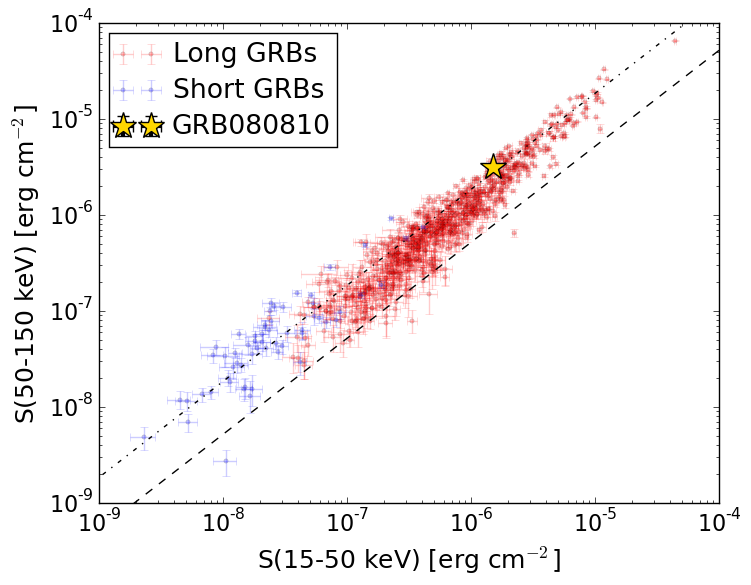
S(15-50 keV)  = 1.4954565e-06
S(50-150 keV) = 3.14544e-06
The dash-dotted line and the dashed line traces the fluences calculated from the Band function with Epeak = 15 and 150 keV, respectively. Both lines assume a canonical values of alpha = -1 and beta = -2.5.
Mask shadow pattern
IMX = 1.636026670224270E-01, IMY = -3.350496201258050E-01
Spacecraft aspect plot
Bright source in the pre-burst/pre-slew/post-slew images
Pre-burst image of 15-350 keV band
Time interval of the image:
-239.296000 -20.496000

# RAcent  DECcent POSerr Theta    Phi  PeakCts   SNR AngSep     Name
#  [deg]    [deg]    ['] [deg]  [deg]                   [']
308.0956  40.9530    7.6  49.6  177.2   0.7097   1.5    0.7	Cyg X-3
326.1064  38.2214    4.2  35.5  178.3   0.6165   2.7    6.8	Cyg X-2
298.3003  41.6244    2.7  57.0  177.3   4.9412   4.3 ------	UNKNOWN
299.7602  56.0420    3.2  57.7 -165.5   3.1562   3.6 ------	UNKNOWN
 40.0868  37.7223    2.6  37.6  -76.1   2.2549   4.5 ------	UNKNOWN
 47.4341  33.8875    2.7  42.7  -68.4   3.8220   4.3 ------	UNKNOWN
 35.6286  51.6138    4.5  41.1  -98.0   2.6470   2.7 ------	UNKNOWN
 35.5568  51.9695    5.3  41.3  -98.5   2.5599   2.7 ------	UNKNOWN
Pre-slew background subtracted image of 15-350 keV band
Time interval of the image:
-20.496000 12.004600

# RAcent  DECcent POSerr Theta    Phi  PeakCts   SNR AngSep     Name
#  [deg]    [deg]    ['] [deg]  [deg]                   [']
308.0741  41.0581    7.4  49.6  177.4   0.2529   1.6    6.5	Cyg X-3
326.2455  38.3776    3.6  35.5  178.7   0.2829   3.2    4.8	Cyg X-2
356.7830   0.3122    0.5  20.4   64.0   1.9491  24.3  193.9	UNKNOWN
Post-slew image of 15-350 keV band
Time interval of the image:
64.004600 482.834000

# RAcent  DECcent POSerr Theta    Phi  PeakCts   SNR AngSep     Name
#  [deg]    [deg]    ['] [deg]  [deg]                   [']
326.1689  38.3152  100.2  47.3  172.6   0.4311   0.1    0.4	Cyg X-2
319.9531  24.1376    2.3  42.9  152.1  17.9640   5.1 ------	UNKNOWN
  0.1368 -31.7760    2.6  32.2   20.2   7.6153   4.4 ------	UNKNOWN
353.8194 -21.6099    3.0  22.1   32.9   5.7089   3.9 ------	UNKNOWN
340.1769  54.5879    2.9  56.0 -166.0  20.8807   4.0 ------	UNKNOWN
 35.4886  15.1323    3.0  41.0  -87.5  21.4450   3.9 ------	UNKNOWN