Analysis Summary
Notes:
- 1) No attempt has been made to eliminate the non-significant decimal places.
- 2) This batgrbproduct analysis is done using the HEASARC data.
- 3) This batgrbproduct analysis is using the flight position for the mask-weighting calculation.
======================================================================
                  BAT GRB EVENT DATA PROCESSING REPORT
    Process Script Ver: batgrbproduct v2.46
    Process Start Time: Sun Jan 19 23:16:39 EST 2014
             Host Name: batevent1
   Current Working Dir: /local/data/batevent/batevent_reproc/trigger323542
======================================================================

  Trigger: 00323542      Segment: 000

  BAT Trigger Time: 242097146.368   [s; MET]
      Trigger Stop: 242097147.392   [s; MET]
               UTC: 2008-09-03T01:12:23.300160    [includes UTCF correction]
       Where From?: TDRSS position message

  BAT
    RA: 86.796749000734   Dec: 51.3264586033656  [deg; J2000]

     Catalogged Source?: NO
     Point Source?:      YES
     GRB Indicated?:     YES    [ by BAT flight software ]
     Image S/N Ratio:    8.95
     Image Trigger?:     NO
     Rate S/N Ratio:     14.2126704035519  [ if not an image trigger ]
     Image S/N Ratio:    8.95

  Analysis Position:   [ source = BAT ]
    RA: 86.796749000734   Dec: 51.3264586033656  [deg; J2000]

  Refined Position:   [ source = BAT pre-slew burst ]
    RA: 86.7882630712467   Dec: 51.2581266424858  [deg; J2000]
        { 05h 47m 09.2s , +51d 15' 29.3" }
         +/- 0.9181082291117 [arcmin] (estimated 90% radius based on SNR)
         +/- 0.23508820080697 [arcmin] (formal 1-sigma fit error)
    SNR: 34.3658525819496

  Angular difference between the analysis and refined position is 4.112262 arcmin

  Partial Coding Fraction: 1    [ including projection effects ]

  Duration
     T90: 66.3400000035763 +/- 10.4208652304861
        Measured from: -7.74399998784065
                   to: 58.5960000157356     [s; relative to TRIGTIME]
     T50: 23.5320000052452 +/- 3.19928051920323
        Measured from: -0.259999990463257
                   to: 23.272000014782     [s; relative to TRIGTIME]


  Fluence
     Peak Flux  (peak 1 second)
        Measured from: -2.7960000038147
                   to: -1.7960000038147     [s; relative to TRIGTIME]
     Total Fluence
        Measured from: -10.5439999997616
                   to: 68.0079999864101     [s; relative to TRIGTIME]

             Band 1     Band 2     Band 3     Band 4
              15-25      25-50     50-100    100-350     keV
 Total     0.864568   1.128191   0.654836   0.128058
           0.043561   0.046027   0.042238   0.042137 [error]
 Peak      0.021214   0.041373   0.036303   0.009894
           0.005023   0.005400   0.005145   0.004775 [error]

     [ fluence units of on-axis counts / fully illuminated detector ]

======================================================================


====== Table of the duration information =============================

        Value   tstart    tstop
T100   78.552  -10.544   68.008
T90    66.340   -7.744   58.596
T50    23.532   -0.260   23.272
Peak    1.000   -2.796   -1.796


====== Spectral Analysis Summary =====================================

Model      : spectral model: simple power-law (PL) and cutoff power-law (CPL)
Ph_index   : photon index: E^{Ph_index}
Ph_90err   : 90% error of the photon index
Epeak      : Epeak in keV
Epeak_90err: 90% error of Epeak
Norm       : normalization at 50 keV in both the PL model and CPL model
Nomr_90err : 90% error of the normalization
chi2       : Chi-Squared
dof        : degree of freedo

=== Time-averaged spectral analysis ===
(Best model with acceptable fit: PL)

Model Ph_index Ph_90err_low Ph_90err_hi  Epeak  Epeak_90err_low  Epeak_90err_hi  Norm       Nomr_90err_low    Norm_90err_hi    chi2    dof
PL      -1.663    -0.098      0.097       -           -               -         2.17e-03     -1.21e-04          1.21e-04      53.290   57
CPL     -0.933    -0.447      0.500       67.964     -11.449        35.009      5.24e-03     -2.15e-03          4.26e-03      45.020   56


=== 1-s peak spectral analysis ===
(Best model with acceptable fit: PL)

Model Ph_index Ph_90err_low Ph_90err_hi  Epeak  Epeak_90err_low  Epeak_90err_hi  Norm       Nomr_90err_low    Norm_90err_hi    chi2    dof
PL      -1.156     -0.246     0.249       -           -               -         6.73e-03     -1.02e-03          1.01e-03      65.450   57
CPL      0.787     -1.466     2.267       71.497     -14.853        67.378      6.21e-02     -6.21e-02          6.29e-01      59.820   56


=== Fluence/Peak Flux Summary ===

              Model    Band1     Band2     Band3     Band4     Band5     Total
                       15-25     25-50    50-100    100-350    15-150    15-350    keV
Fluence         PL   2.53e-07  4.21e-07  5.32e-07  1.34e-06  1.58e-06  2.55e-06   erg/cm2
      90%_error_low -2.15e-08 -2.19e-08 -4.09e-08 -2.07e-07 -9.46e-08 -2.44e-07   erg/cm2
      90%_error_hi   2.21e-08  2.19e-08  4.11e-08  2.32e-07  9.55e-08  2.64e-07   erg/cm2
Peak flux       PL   1.99e-01  2.46e-01  2.21e-01  3.43e-01  7.85e-01  1.01e+00   ph/cm2/s
      90%_error_low -5.11e-02 -4.16e-02 -3.95e-02 -1.11e-01 -1.19e-01 -1.65e-01   ph/cm2/s
      90%_error_hi   5.52e-02  4.11e-02  3.92e-02  1.40e-01  1.19e-01  1.72e-01   ph/cm2/s

Fluence        CPL   2.54e-07  3.44e-07  3.63e-07  8.47e-07  1.19e-06  1.80e-06   erg/cm2
      90%_error_low -3.84e-08 -4.77e-08 -3.83e-08 -5.83e-07 -8.54e-08 -1.84e-07   erg/cm2
      90%_error_hi   3.33e-08  3.54e-08  3.50e-08  -3.77e-09  6.18e-08  1.56e-07   erg/cm2
Peak flux      CPL   1.37e-01  2.85e-01  2.45e-01  6.66e-02  7.22e-01  7.35e-01   ph/cm2/s
      90%_error_low -6.81e-02 -5.32e-02 -4.96e-02 -4.74e-02 -1.31e-01 -1.41e-01   ph/cm2/s
      90%_error_hi   7.12e-02  5.53e-02  5.03e-02  1.39e-01  1.29e-01  1.73e-01   ph/cm2/s

======================================================================
Image
Pre-slew 15.0-350.0 keV image (Event data)
#   RAcent    DECcent   POSerr    Theta     Phi              Peak Cts       SNR   Name
   86.7883    51.2581   0.0056     9.7185  -123.4694         1.9600793     34.366 TRIG_00323542

Foreground time interval of the image:
-10.544  15.733 (delta_t =  26.277 [sec])
Background time interval of the image:
-239.368 -10.544 (delta_t = 228.824 [sec])
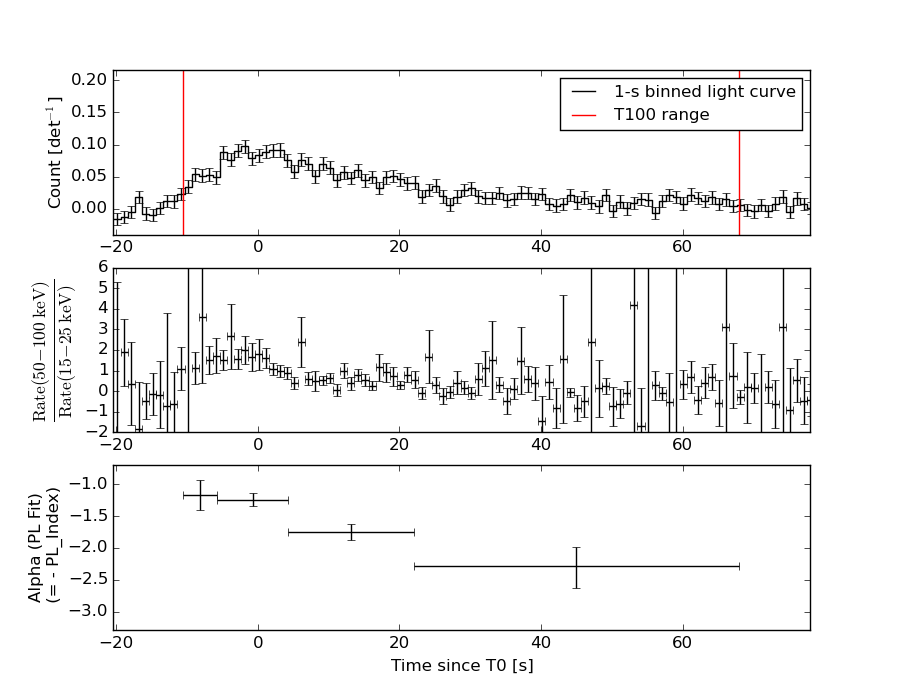
Light Curves
Note: The mask-weighted lightcurves have units of either count/det or counts/sec/det, where a det is 0.4 x 0.4 = 0.16 sq cm.
Full-time range; 1 s binning
Other quick-look light curves:
- 64 ms binning (zoomed)
- 16 ms binning (zoomed)
- 8 ms binning (zoomed)
- 2 ms binning (zoomed)
- SN=5 or 10 s binning (full-time range)
- Raw light curve
Spectra
- 64 ms binning (zoomed)
- 16 ms binning (zoomed)
- 8 ms binning (zoomed)
- 2 ms binning (zoomed)
- SN=5 or 10 s binning (full-time range)
- Raw light curve
Spectra
Notes:
- 1) The fitting includes the systematic errors.
- 2) When the burst includes telescope slew time periods, the fitting uses an average response file made from multiple 5-s response files through out the slew time plus single time preiod for the non-slew times, and weighted by the total counts in the corresponding time period using addrmf. An average response file is needed becuase a spectral fit using the pre-slew DRM will introduce some errors in both a spectral shape and a normalization if the PHA file contains a lot of the slew/post-slew time interval.
- 3) For fits to more complicated models (e.g. a power-law over a cutoff power-law), the BAT team has decided to require a chi-square improvement of more than 6 for each extra dof.
Time averaged spectrum fit using the average DRM
Power-law model
Time interval is from  -10.544 sec. to   68.008 sec.

Spectral model in power-law:
------------------------------------------------------------
Parameters  : value       lower 90%   higher 90%
Photon index: -1.66327     ( -0.0983887   0.0970922 )
Norm@50keV  : 2.16604E-03    ( -0.000121392   0.000120561 )
------------------------------------------------------------
#Fit statistic : Chi-Squared =          53.29 using 59 PHA bins.
# Reduced chi-squared =         0.9349 for     57 degrees of freedom
# Null hypothesis probability =   6.150331e-01

Photon flux (15-150 keV)    in 78.55 sec: 0.284093 ( -0.014782  0.014798 ) ph/cm2/s
Energy fluence (15-150 keV)             : 1.58058e-06 ( -9.45498e-08  9.5549e-08 ) ergs/cm2
Cutoff power-law model
Time interval is from  -10.544 sec. to   68.008 sec.
Spectral model in the cutoff power-law:
------------------------------------------------------------
Parameters  : value       lower 90%   higher 90%
Photon index: -0.933336     ( -0.446565   0.499844 )
Epeak [keV] : 67.9640      ( -11.4481 35.0092 )
Norm@50keV  : 5.23537E-03    ( -0.00215133   0.00426318 )
------------------------------------------------------------
#Fit statistic : Chi-Squared =          45.02 using 59 PHA bins.
# Reduced chi-squared =         0.8040 for     56 degrees of freedom
# Null hypothesis probability =   8.531460e-01

Photon flux (15-150 keV)    in 78.55 sec: 0.271367 ( -0.016568  0.016549 ) ph/cm2/s
Energy fluence (15-150 keV)             : 1.18786e-06 ( -8.53705e-08  6.17504e-08 ) ergs/cm2
1-s peak spectrum fit
Power-law model
Time interval is from   -2.796 sec. to   -1.796 sec.

Spectral model in power-law:
------------------------------------------------------------
Parameters  : value       lower 90%   higher 90%
Photon index: -1.15635     ( -0.245487   0.24889 )
Norm@50keV  : 6.72627E-03    ( -0.00101527   0.00101445 )
------------------------------------------------------------
#Fit statistic : Chi-Squared =          65.45 using 59 PHA bins.
# Reduced chi-squared =          1.148 for     57 degrees of freedom
# Null hypothesis probability =   2.068168e-01

Photon flux (15-150 keV)    in 1 sec: 0.785028 ( -0.118829  0.11893 ) ph/cm2/s
Energy fluence (15-150 keV)             : 6.91162e-08 ( -1.18221e-08  1.20303e-08 ) ergs/cm2
Cutoff power-law model
Time interval is from   -2.796 sec. to   -1.796 sec.
Spectral model in the cutoff power-law:
------------------------------------------------------------
Parameters  : value       lower 90%   higher 90%
Photon index: 0.786596     ( -1.46623   2.26622 )
Epeak [keV] : 71.4971      ( -14.8446 67.3861 )
Norm@50keV  : 6.21414E-02    ( -0.0621965   0.628576 )
------------------------------------------------------------
#Fit statistic : Chi-Squared =          59.82 using 59 PHA bins.
# Reduced chi-squared =          1.068 for     56 degrees of freedom
# Null hypothesis probability =   3.386569e-01

Photon flux (15-150 keV)    in 1 sec: 0.722301 ( -0.130844  0.129468 ) ph/cm2/s
Energy fluence (15-150 keV)             : 5.87003e-08 ( -1.25675e-08  1.41229e-08 ) ergs/cm2
Time-resolved spectra
Distribution
T90 vs. Hardness ratio plot
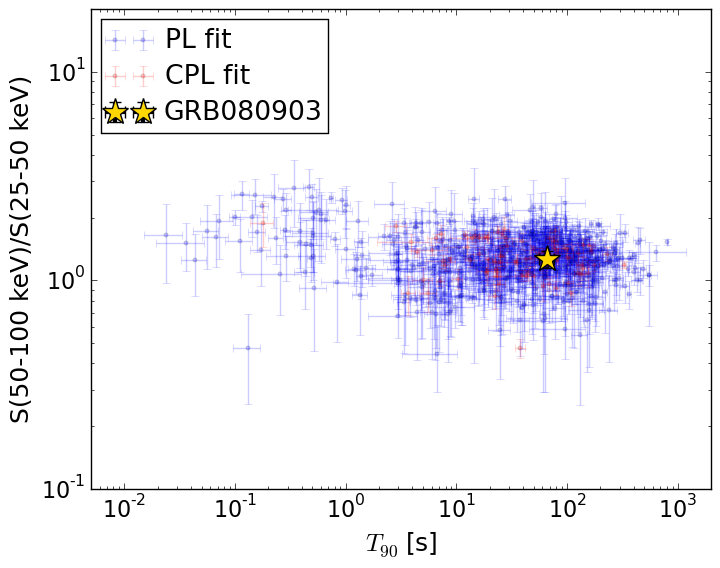
T90                                   = 66.34 sec.
Hardness ratio (energy fluence ratio) = 1.26293209236
S(15-50 keV) vs. S(50-150 keV) plot
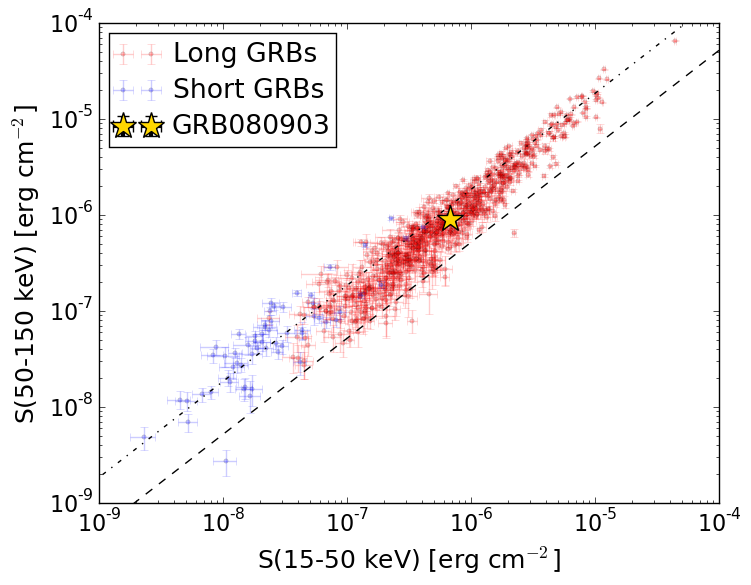
S(15-50 keV)  = 6.745818e-07
S(50-150 keV) = 9.059883e-07
The dash-dotted line and the dashed line traces the fluences calculated from the Band function with Epeak = 15 and 150 keV, respectively. Both lines assume a canonical values of alpha = -1 and beta = -2.5.
Mask shadow pattern
IMX = -9.445175407291447E-02, IMY = 1.428667928175362E-01
Spacecraft aspect plot
Bright source in the pre-burst/pre-slew/post-slew images
Pre-burst image of 15-350 keV band
Time interval of the image:
-239.368000 -10.544000

# RAcent  DECcent POSerr Theta    Phi  PeakCts   SNR AngSep     Name
#  [deg]    [deg]    ['] [deg]  [deg]                   [']
 83.6309  22.0185    0.2  24.2  -10.4  10.0944  53.4    0.3	Crab
 22.7287  43.9526    2.4  36.8  116.0   2.1583   4.8 ------	UNKNOWN
 73.1758 -10.1712    2.5  55.5   11.3   4.6149   4.6 ------	UNKNOWN
123.7990  47.6596    2.1  33.0 -103.2   1.8692   5.6 ------	UNKNOWN
Pre-slew background subtracted image of 15-350 keV band
Time interval of the image:
-10.544000 15.732600

# RAcent  DECcent POSerr Theta    Phi  PeakCts   SNR AngSep     Name
#  [deg]    [deg]    ['] [deg]  [deg]                   [']
 83.6762  21.8678    5.5  24.4  -10.4  -0.1238  -2.1    9.1	Crab
  3.7223  57.1245    2.3  44.2  141.1   0.8618   5.0 ------	UNKNOWN
 86.7883  51.2581    0.3   9.7 -123.5   1.9601  34.4 ------	UNKNOWN
139.7625  66.5909    2.4  39.4 -136.9   0.4554   4.8 ------	UNKNOWN
Post-slew image of 15-350 keV band
Time interval of the image:
47.132600 962.687700

# RAcent  DECcent POSerr Theta    Phi  PeakCts   SNR AngSep     Name
#  [deg]    [deg]    ['] [deg]  [deg]                   [']
 83.6347  22.0229    0.2  29.4   -0.4  39.3628  70.8    0.5	Crab
 34.9233  36.0651    2.6  39.5   81.7   9.7241   4.4 ------	UNKNOWN
 45.5069  39.4657    2.3  30.8   77.4   4.9567   5.0 ------	UNKNOWN
 98.4724  24.6325    2.8  28.1  -29.4   2.2071   4.2 ------	UNKNOWN
103.9515  24.6574    2.9  29.7  -39.2   2.3968   4.0 ------	UNKNOWN