Analysis Summary
Notes:
- 1) No attempt has been made to eliminate the non-significant decimal places.
- 2) This batgrbproduct analysis is done using the HEASARC data.
- 3) This batgrbproduct analysis is using the flight position for the mask-weighting calculation.
======================================================================
BAT GRB EVENT DATA PROCESSING REPORT
Process Script Ver: batgrbproduct v2.46
Process Start Time: Sun Jan 19 22:56:04 EST 2014
Host Name: batevent1
Current Working Dir: /local/data/batevent/batevent_reproc/trigger323984
======================================================================
Trigger: 00323984 Segment: 000
BAT Trigger Time: 242400799.424 [s; MET]
Trigger Stop: 242400800.448 [s; MET]
UTC: 2008-09-06T13:33:16.347220 [includes UTCF correction]
Where From?: TDRSS position message
BAT
RA: 227.890126999499 Dec: -80.4861395765144 [deg; J2000]
Catalogged Source?: NO
Point Source?: YES
GRB Indicated?: YES [ by BAT flight software ]
Image S/N Ratio: 6.72
Image Trigger?: NO
Rate S/N Ratio: 10.6301458127346 [ if not an image trigger ]
Image S/N Ratio: 6.72
Analysis Position: [ source = BAT ]
RA: 227.890126999499 Dec: -80.4861395765144 [deg; J2000]
Refined Position: [ source = BAT pre-slew burst ]
RA: 228.057031570565 Dec: -80.537933222545 [deg; J2000]
{ 15h 12m 13.7s , -80d 32' 16.6" }
+/- 1.62491979375274 [arcmin] (estimated 90% radius based on SNR)
+/- 0.678895355668262 [arcmin] (formal 1-sigma fit error)
SNR: 15.203021510086
Angular difference between the analysis and refined position is 3.518845 arcmin
Partial Coding Fraction: 0.59375 [ including projection effects ]
Duration
T90: 148.212000012398 +/- 19.610295759031
Measured from: -67.7319999933243
to: 80.4800000190735 [s; relative to TRIGTIME]
T50: 40.66400000453 +/- 5.79279036844568
Measured from: 2.69200000166893
to: 43.3560000061989 [s; relative to TRIGTIME]
Fluence
Peak Flux (peak 1 second)
Measured from: 8.24000000953674
to: 9.24000000953674 [s; relative to TRIGTIME]
Total Fluence
Measured from: -104.995999991894
to: 109.555999994278 [s; relative to TRIGTIME]
Band 1 Band 2 Band 3 Band 4
15-25 25-50 50-100 100-350 keV
Total 1.635900 2.296052 1.603514 0.307856
0.085671 0.087392 0.077216 0.069248 [error]
Peak 0.032740 0.050433 0.041392 0.006256
0.006790 0.006956 0.006267 0.005383 [error]
[ fluence units of on-axis counts / fully illuminated detector ]
======================================================================
====== Table of the duration information =============================
Value tstart tstop
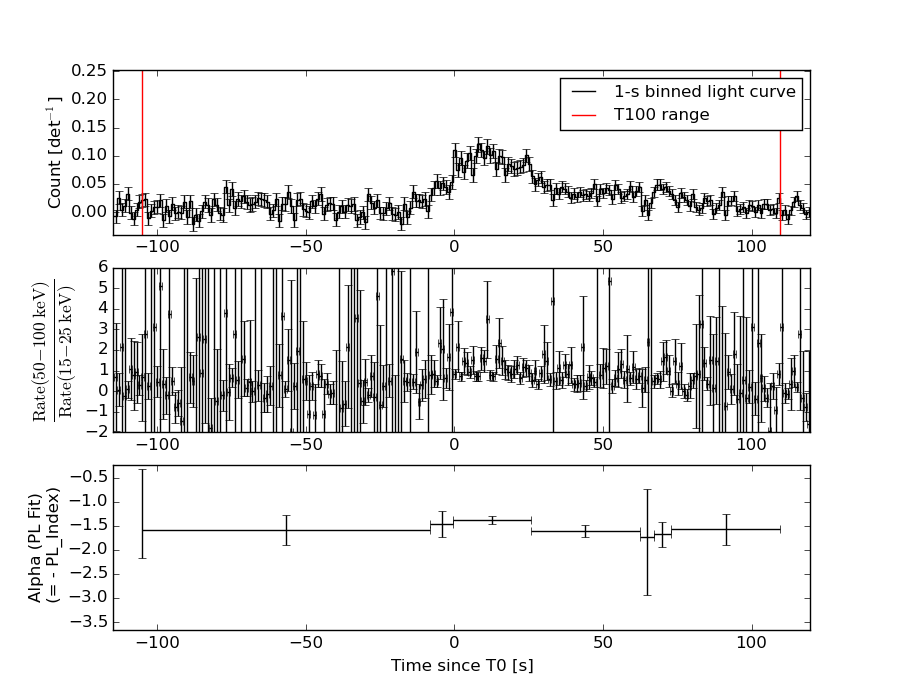
T100 214.552 -104.996 109.556
T90 148.212 -67.732 80.480
T50 40.664 2.692 43.356
Peak 1.000 8.240 9.240
====== Spectral Analysis Summary =====================================
Model : spectral model: simple power-law (PL) and cutoff power-law (CPL)
Ph_index : photon index: E^{Ph_index}
Ph_90err : 90% error of the photon index
Epeak : Epeak in keV
Epeak_90err: 90% error of Epeak
Norm : normalization at 50 keV in both the PL model and CPL model
Nomr_90err : 90% error of the normalization
chi2 : Chi-Squared
dof : degree of freedo
=== Time-averaged spectral analysis ===
(Best model with acceptable fit: PL)
Model Ph_index Ph_90err_low Ph_90err_hi Epeak Epeak_90err_low Epeak_90err_hi Norm Nomr_90err_low Norm_90err_hi chi2 dof
PL -1.517 -0.085 0.084 - - - 1.80e-03 -8.30e-05 8.27e-05 43.810 57
CPL -1.391 -0.169 0.325 243.417 -243.417 -243.417 2.08e-03 -3.50e-04 9.14e-04 43.320 56
=== 1-s peak spectral analysis ===
(Best model with acceptable fit: PL)
Model Ph_index Ph_90err_low Ph_90err_hi Epeak Epeak_90err_low Epeak_90err_hi Norm Nomr_90err_low Norm_90err_hi chi2 dof
PL -1.399 -0.268 0.267 - - - 8.40e-03 -1.35e-03 1.35e-03 37.570 57
CPL -0.398 -1.100 1.558 80.126 -22.165 -80.126 2.67e-02 -2.67e-02 1.25e-01 35.440 56
=== Fluence/Peak Flux Summary ===
Model Band1 Band2 Band3 Band4 Band5 Total
15-25 25-50 50-100 100-350 15-150 15-350 keV
Fluence PL 5.01e-07 9.10e-07 1.27e-06 3.72e-06 3.65e-06 6.40e-06 erg/cm2
90%_error_low -4.08e-08 -4.42e-08 -7.72e-08 -4.76e-07 -1.84e-07 -5.33e-07 erg/cm2
90%_error_hi 4.19e-08 4.40e-08 7.70e-08 5.23e-07 1.85e-07 5.72e-07 erg/cm2
Peak flux PL 3.14e-01 3.35e-01 2.54e-01 3.14e-01 1.02e+00 1.22e+00 ph/cm2/s
90%_error_low -8.23e-02 -5.78e-02 -5.02e-02 -1.10e-01 -1.64e-01 -1.98e-01 ph/cm2/s
90%_error_hi 8.88e-02 5.71e-02 4.97e-02 1.42e-01 1.65e-01 2.01e-01 ph/cm2/s
Fluence CPL 4.89e-07 9.21e-07 1.28e-06 3.04e-06 3.61e-06 5.73e-06 erg/cm2
90%_error_low -4.87e-08 -5.04e-08 -8.03e-08 -1.15e-06 -2.10e-07 -1.16e-06 erg/cm2
90%_error_hi 4.58e-08 5.15e-08 8.12e-08 1.23e-06 2.08e-07 8.68e-07 erg/cm2
Peak flux CPL 2.61e-01 3.66e-01 2.73e-01 1.19e-01 9.81e-01 1.02e+00 ph/cm2/s
90%_error_low -1.02e-01 -6.91e-02 -5.80e-02 -1.19e-01 -1.73e-01 -1.98e-01 ph/cm2/s
90%_error_hi 1.07e-01 7.26e-02 6.00e-02 2.40e-01 1.72e-01 2.91e-01 ph/cm2/s
======================================================================
Image
Pre-slew 15.0-350.0 keV image (Event data)
#   RAcent    DECcent   POSerr    Theta     Phi              Peak Cts       SNR   Name
  228.0570   -80.5379   0.0127    26.2719  -109.9811         2.5864169     15.203 TRIG_00323984

Foreground time interval of the image:
-104.996  12.877 (delta_t = 117.873 [sec])
Background time interval of the image:
-239.424 -104.996 (delta_t = 134.428 [sec])
Light Curves
Note: The mask-weighted lightcurves have units of either count/det or counts/sec/det, where a det is 0.4 x 0.4 = 0.16 sq cm.
Full-time range; 1 s binning
Other quick-look light curves:
- 64 ms binning (zoomed)
- 16 ms binning (zoomed)
- 8 ms binning (zoomed)
- 2 ms binning (zoomed)
- SN=5 or 10 s binning (full-time range)
- Raw light curve
Spectra
- 64 ms binning (zoomed)
- 16 ms binning (zoomed)
- 8 ms binning (zoomed)
- 2 ms binning (zoomed)
- SN=5 or 10 s binning (full-time range)
- Raw light curve
Spectra
Notes:
- 1) The fitting includes the systematic errors.
- 2) When the burst includes telescope slew time periods, the fitting uses an average response file made from multiple 5-s response files through out the slew time plus single time preiod for the non-slew times, and weighted by the total counts in the corresponding time period using addrmf. An average response file is needed becuase a spectral fit using the pre-slew DRM will introduce some errors in both a spectral shape and a normalization if the PHA file contains a lot of the slew/post-slew time interval.
- 3) For fits to more complicated models (e.g. a power-law over a cutoff power-law), the BAT team has decided to require a chi-square improvement of more than 6 for each extra dof.
Time averaged spectrum fit using the average DRM
Power-law model
Time interval is from -104.996 sec. to  109.556 sec.

Spectral model in power-law:
------------------------------------------------------------
Parameters  : value       lower 90%   higher 90%
Photon index: -1.51673     ( -0.0845144   0.0843159 )
Norm@50keV  : 1.79826E-03    ( -8.30342e-05   8.27559e-05 )
------------------------------------------------------------
#Fit statistic : Chi-Squared =          43.81 using 59 PHA bins.
# Reduced chi-squared =         0.7686 for     57 degrees of freedom
# Null hypothesis probability =   9.000920e-01

Photon flux (15-150 keV)    in 214.6 sec: 0.225524 ( -0.010597  0.010615 ) ph/cm2/s
Energy fluence (15-150 keV)             : 3.65157e-06 ( -1.83884e-07  1.84882e-07 ) ergs/cm2
Cutoff power-law model
Time interval is from -104.996 sec. to  109.556 sec.
Spectral model in the cutoff power-law:
------------------------------------------------------------
Parameters  : value       lower 90%   higher 90%
Photon index: -1.39106     ( -0.169451   0.325186 )
Epeak [keV] : 243.417      ( -243.44 -243.44 )
Norm@50keV  : 2.07822E-03    ( -0.000350043   0.000913732 )
------------------------------------------------------------
#Fit statistic : Chi-Squared =          43.32 using 59 PHA bins.
# Reduced chi-squared =         0.7736 for     56 degrees of freedom
# Null hypothesis probability =   8.921391e-01

Photon flux (15-150 keV)    in 214.6 sec: 0.223829 ( -0.011341  0.011323 ) ph/cm2/s
Energy fluence (15-150 keV)             : 3.61028e-06 ( -2.09882e-07  2.08457e-07 ) ergs/cm2
1-s peak spectrum fit
Power-law model
Time interval is from    8.240 sec. to    9.240 sec.

Spectral model in power-law:
------------------------------------------------------------
Parameters  : value       lower 90%   higher 90%
Photon index: -1.39868     ( -0.268493   0.267021 )
Norm@50keV  : 8.39811E-03    ( -0.00135394   0.00134742 )
------------------------------------------------------------
#Fit statistic : Chi-Squared =          37.57 using 59 PHA bins.
# Reduced chi-squared =         0.6590 for     57 degrees of freedom
# Null hypothesis probability =   9.781528e-01

Photon flux (15-150 keV)    in 1 sec: 1.02244 ( -0.164236  0.16457 ) ph/cm2/s
Energy fluence (15-150 keV)             : 8.11802e-08 ( -1.43889e-08  1.46142e-08 ) ergs/cm2
Cutoff power-law model
Time interval is from    8.240 sec. to    9.240 sec.
Spectral model in the cutoff power-law:
------------------------------------------------------------
Parameters  : value       lower 90%   higher 90%
Photon index: -0.397876     ( -1.09961   1.55835 )
Epeak [keV] : 80.1256      ( -22.1651 -80.1256 )
Norm@50keV  : 2.67223E-02    ( -0.0267223   0.124731 )
------------------------------------------------------------
#Fit statistic : Chi-Squared =          35.44 using 59 PHA bins.
# Reduced chi-squared =         0.6329 for     56 degrees of freedom
# Null hypothesis probability =   9.855320e-01

Photon flux (15-150 keV)    in 1 sec: 0.980547 ( -0.172899  0.172283 ) ph/cm2/s
Energy fluence (15-150 keV)             : 7.53894e-08 ( -1.554e-08  1.6123e-08 ) ergs/cm2
Time-resolved spectra
Distribution
T90 vs. Hardness ratio plot
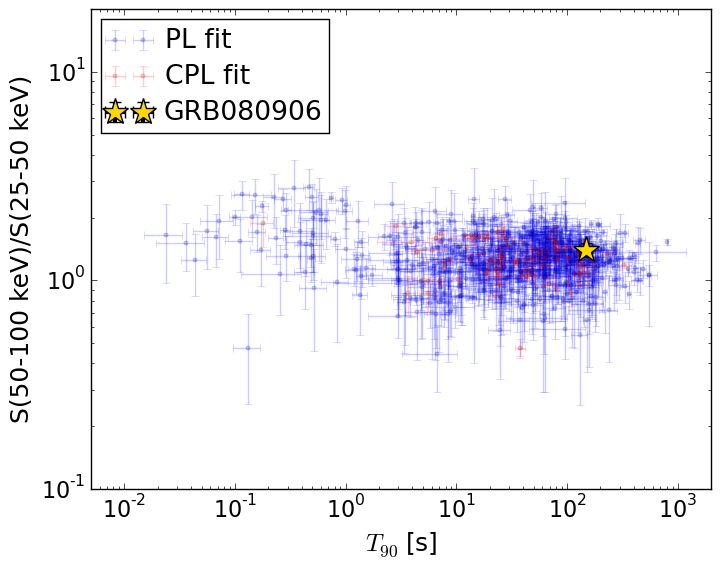
T90                                   = 148.212 sec.
Hardness ratio (energy fluence ratio) = 1.39794467841
S(15-50 keV) vs. S(50-150 keV) plot
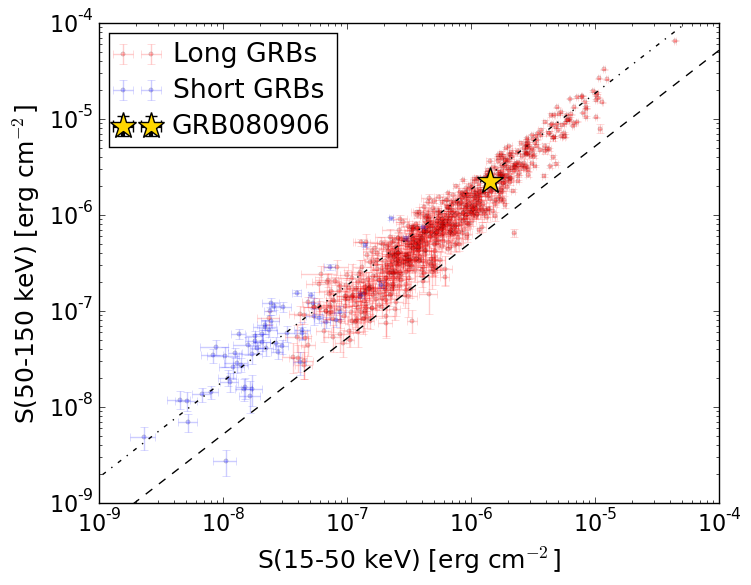
S(15-50 keV)  = 1.4109892e-06
S(50-150 keV) = 2.2405937e-06
The dash-dotted line and the dashed line traces the fluences calculated from the Band function with Epeak = 15 and 150 keV, respectively. Both lines assume a canonical values of alpha = -1 and beta = -2.5.
Mask shadow pattern
IMX = -1.686745831372712E-01, IMY = 4.639067118422541E-01
Spacecraft aspect plot
Bright source in the pre-burst/pre-slew/post-slew images
Pre-burst image of 15-350 keV band
Time interval of the image:
-239.424000 -104.996000

# RAcent  DECcent POSerr Theta    Phi  PeakCts   SNR AngSep     Name
#  [deg]    [deg]    ['] [deg]  [deg]                   [']
255.9916 -37.8294    1.0  37.0  -20.8   1.8181  11.6    0.9	4U 1700-377
256.3341 -36.6013    8.0  37.9  -19.3   0.2279   1.4   11.8	GX 349+2
263.0254 -24.7936   12.0  45.7   -3.3   0.2090   1.0    3.0	GX 1+4
264.9367 -44.4435    7.1  27.7  -17.4  -0.2094  -1.6    8.3	4U 1735-44
270.1537 -25.0911    4.5  42.9    5.1   0.5150   2.6    7.1	GX 5-1
270.2622 -25.6393    4.1  42.4    4.9   0.5521   2.8    6.6	GRS 1758-258
274.0024 -13.8779    5.7  52.5   14.5   1.0598   2.1    9.5	GX 17+2
275.8684 -30.3305    5.4  36.3    9.7   0.3590   2.1    3.7	H1820-303
285.0354 -24.8154    4.1  39.3   24.9   0.5925   2.8    6.3	HT1900.1-2455
263.0750 -33.7885    2.7  37.5   -9.2   0.6293   4.2    5.1	GX 354-0
297.6307 -48.9958    3.3  13.7   37.9   0.4331   3.5 ------	UNKNOWN
 46.6900 -48.4586    3.2  54.2  177.0   1.6905   3.5 ------	UNKNOWN
 51.2745 -47.1396    3.4  57.0  179.3   3.0214   3.4 ------	UNKNOWN
Pre-slew background subtracted image of 15-350 keV band
Time interval of the image:
-104.996000 12.876590

# RAcent  DECcent POSerr Theta    Phi  PeakCts   SNR AngSep     Name
#  [deg]    [deg]    ['] [deg]  [deg]                   [']
256.0729 -37.7652    5.2  37.0  -20.6  -0.4176  -2.2    6.3	4U 1700-377
256.4493 -36.2660   14.8  38.1  -18.9   0.1487   0.8    9.4	GX 349+2
263.0625 -24.5655    0.0  45.9   -3.1   0.2564   1.0   11.2	GX 1+4
264.8774 -44.4134    5.1  27.8  -17.5   0.3356   2.3    6.2	4U 1735-44
270.1596 -25.1014    7.8  42.9    5.1  -0.3478  -1.5    6.9	GX 5-1
270.4175 -25.8296    3.8  42.2    5.0   0.6977   3.0    8.1	GRS 1758-258
273.9000 -13.9574    2.7  52.4   14.3  -2.4471  -4.3    7.8	GX 17+2
275.8411 -30.4818   11.5  36.1    9.6  -0.2018  -1.0    8.1	H1820-303
284.8832 -24.9516   10.7  39.2   24.7  -0.2693  -1.1    8.5	HT1900.1-2455
262.9046 -34.0209    0.0  37.4   -9.6   0.5665   3.3   11.9	GX 354-0
277.7664 -11.7825    2.9  53.6   19.6   2.9837   4.0 ------	UNKNOWN
259.3095 -21.8655    2.0  49.7   -5.9   1.8148   5.9 ------	UNKNOWN
 53.3580 -56.6816    2.5  49.6 -172.9   1.3408   4.6 ------	UNKNOWN
261.8082 -47.7604    2.7  26.5  -25.7   0.5982   4.4 ------	UNKNOWN
228.0627 -80.5389    0.8  26.3 -110.0   2.5726  15.1 ------	UNKNOWN
Post-slew image of 15-350 keV band
Time interval of the image:
60.476600 962.575500

# RAcent  DECcent POSerr Theta    Phi  PeakCts   SNR AngSep     Name
#  [deg]    [deg]    ['] [deg]  [deg]                   [']
170.5644 -60.4682    8.7  25.6 -102.1   0.8453   1.3   11.8	Cen X-3
186.8446 -62.7637    2.7  21.0  -85.3   2.4737   4.2    5.2	GX 301-2
256.0026 -37.8379    1.2  43.9    4.4   7.2485   9.7    0.8	4U 1700-377
256.3435 -36.2691    9.7  45.5    4.5   1.0038   1.2   10.3	GX 349+2
264.6618 -44.3051   10.3  38.4   15.5  -0.6801  -1.1    9.4	4U 1735-44
263.0481 -33.7964    3.3  48.6   11.6   3.7430   3.5    3.7	GX 354-0
280.6092 -43.8186    2.5  40.9   33.1   3.7896   4.6 ------	UNKNOWN
 55.2708 -50.0262    3.3  49.4  158.2   5.2818   3.5 ------	UNKNOWN
255.2687 -41.6151    2.3  40.1    4.2   3.2594   5.0 ------	UNKNOWN
 83.5260 -66.3066    3.2  31.9  178.3   1.9076   3.6 ------	UNKNOWN
242.5725 -59.3413    3.7  21.6   -7.5   1.4339   3.1 ------	UNKNOWN
 86.3185 -40.5112    4.3  57.2 -173.8   7.4876   2.7 ------	UNKNOWN
114.8976 -63.6684    2.4  31.2 -156.0   2.3621   4.8 ------	UNKNOWN
116.3273 -46.9125    3.0  47.3 -148.1   4.2273   3.9 ------	UNKNOWN
232.4010 -21.7986    3.8  58.7  -23.2  10.1610   3.1 ------	UNKNOWN